

Abstract
Structural changes in rabbit muscle pyruvate kinase (PK) induced by phosphoenolpyruvate (PEP) and Mg2+ binding were studied by attenuated total reflection Fourier transform infrared spectroscopy in combination with a dialysis accessory. The experiments indicated a largely preserved secondary structure upon PEP and Mg2+ binding but also revealed small backbone conformational changes of PK involving all types of secondary structure. To assess the effect of the protein environment on the bound PEP, we assigned and evaluated the infrared absorption bands of bound PEP. These were identified using 2,3-13C2-labeled PEP. We obtained the following assignments: 1589 cm−1 (antisymmetric carboxylate stretching vibration); 1415 cm−1 (symmetric carboxylate stretching vibration); 1214 cm−1 (C-O stretching vibration); 1124 and 1110 cm−1 (asymmetric PO32- stretching vibrations); and 967 cm−1 (symmetric PO32- stretching vibration). The corresponding band positions in solution are 1567, 1407, 1229, 1107, and 974 cm−1. The differences for bound and free PEP indicate specific interactions between ligand and protein. Quantification of the interactions with the phosphate group indicated that the enzyme environment has little influence on the P-O bond strengths, and that the bridging P-O bond, which is broken in the catalytic reaction, is weakened by <3%. Thus, there is only little distortion toward a dissociative transition state of the phosphate transfer reaction when PEP binds to PK. Therefore, our results are in line with an associative transition state. Carboxylate absorption bands indicated a maximal shortening of the length of the shorter C-O bond by 1.3 pm. PEP bound to PK in the presence of the monovalent ion Na+ exhibited the same band positions as in the presence of K+, indicating very similar interaction strengths between ligand and protein in both cases.
Introduction
Pyruvate kinase (PK) is a key enzyme of the glycolytic pathway that catalyzes the transfer of phosphate from phosphoenolpyruvate (PEP) (Fig. 1 a) to adenosine diphosphate (ADP):
Figure 1.
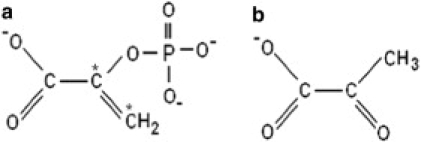
Chemical structures of (a) PEP and (b) pyruvate. Asterisks indicate the 13C-labeled carbon atoms in panel a.
The physiological reaction of pyruvate kinase proceeds in two chemical steps. The first step is phosphoryl transfer from PEP to ADP which produces ATP and the enolate of pyruvate (1). The second step is the addition of a proton to the enolate of pyruvate to produce pyruvate (2).
Rabbit muscle pyruvate kinase (EC 2.7.1.40, sequence code AAB61963) consists of four subunits of 530 residues each. Each subunit folds into four domains: A, B, C, and N. Domain N (residues 1–42) is a short helix-turn-helix motif, domain A (residues 43–115 and residues 224–387) is a parallel (β/α)8 barrel, domain B (residues 116–223) is a nine-stranded β-barrel, and domain C (residues 388–530) is composed of five α-helices and a five stranded β-sheet. The active site lies in the pocket between domains A and B of the same subunit. Structures of the active site with bound ligands indicate that the side chains of Arg72 and Lys269 bind the phosphate group of PEP or the γ-phosphate of ATP (3,4).
Pyruvate kinase has four metal binding sites; it requires divalent cations (5–7) and monovalent cations (8–10) for activity. In the presence of divalent cations, pyruvate kinase is active in a medium containing the univalent cations K+, Rb+, or NH4+, but only weakly active in the presence of Na+ (11,12). By use of nuclear magnetic resonance (NMR), Mildvan and Cohn (13) have observed that K+ enhances the relaxation rate of water protons in the ternary complex pyruvate kinase-manganese-phosphoenolpyruvate. This indicates that K+ affects the conformation of the enzyme in the presence of PEP and Mn2+. The crystal structure of rabbit muscle pyruvate kinase (14) provides insight into the roles of various groups in binding of divalent and monovalent cations. Mn2+ (14) or Mg2+ (4) coordinates to the protein through the carboxylate side chains of Glu271 and Asp295 and K+ coordinates to four protein ligands: Thr113, Ser76, Asn74, and Asp112. Crystal structures have been obtained with several ligands (3,4,14) but not with PEP due to the slow hydratase activity of pyruvate kinase. As a close analog, L-phospholactate has been used (4). Interestingly, the active sites of different subunits adopt different conformations that result in different degrees of closure of the cleft that forms the active site (4). One of eight sites is closed and Mg2+ coordinates to L-phospholactate and protein. The other sites are open and coordination between Mg2+ and L-phospholactate is lost. Open and closed conformations have also been observed in NMR relaxation measurements, indicating an open conformation in the complex with Mn2+ but closed conformations in the ternary complexes with PEP and L-phospholactate (15).
In this study, we used reaction-induced infrared (IR) difference spectroscopy to study structural changes of PK induced by PEP binding. The method is more sensitive than a comparison of IR absorption spectra of samples with and without PEP and yields valuable information on ligand-induced structural changes (16–20). We used a variant of the attenuated total reflectance (ATR) technique in which a sample compartment in contact to the ATR crystal is separated by a dialysis membrane from a reservoir (21,22). The absorption of the solution in the sample compartment is probed by the IR beam. The protein is confined to the sample compartment. The ligands on the other hand can exchange freely between the sample compartment and the reservoir via the dialysis membrane. Therefore, the sample composition can be altered by adding a substance to the reservoir. Our results demonstrate a conformational change of pyruvate kinase upon binding of PEP and small changes in the bond strengths of PEP when it binds.
Materials and Methods
Materials
Pyruvate kinase (PK) from rabbit muscle, monopotassium salt of PEP, pyruvate, ADP, and MOPS (3-[n-morpholino] propanesulphonic acid) and deuterium oxide (99.9 atom % D) were purchased from Sigma (St. Louis, MO). Labeled PEP (2,3-13C2) was purchased from Cambridge Isotopes Laboratories (Andover, MA). The labeled carbon atoms are indicated by asterisks in Fig. 1 a. Tris-HCl was obtained from Angus Chemical (Buffalo Grove, IL). KCl, NaCl, and MgSO4 were obtained from Scharlau Chemie (Sentmenat, Spain). Cellulose dialysis membranes CelluSep F3 of molecular weight cutoff 12,000–14,000 were purchased from Orange Scientific (Braine-l'Alleud, Belgium).
Methods
PK sample preparation
For difference spectroscopy, 0.8 mM of rabbit muscle PK (23) was prepared in buffer (Tris-HCl + MOPS, pH, 7.5) containing 200 mM KCl or NaCl and 4 mM of MgSO4. Deuterated samples of PK were prepared in a similar way, and the pD adjusted to 7.6. The pH meter reading was corrected by +0.4 to obtain pD (24). For recording of absorption spectra, labeled and unlabeled PEP, and pyruvate (Fig. 1 b) were dissolved in H2O and the absorption spectrum measured at pH 7.5.
Fourier transform infrared studies
Our ATR-dialysis setup has been described previously (22). The PK sample was placed between the ATR reflection element and the dialysis membrane in the following way: A 2 μL drop of PK sample was placed on the ATR crystal and another 4 μL were deposited as a hanging drop on the dialysis membrane at the bottom of the reservoir. The sample compartment was then closed by bringing the reservoir toward the ATR crystal. The solution in the reservoir was stirred with a small mechanical stirrer for fast equilibration.
Fourier transform infrared (FTIR) spectra were recorded at 4 cm−1 resolution on a Vertex 70 FTIR spectrometer (Bruker Optik CpmbH, Ettingen, Germany) equipped with an HgCdTe detector. The experiments were performed at room temperature. PK was equilibrated by continuous diffusion of buffer and salts across the dialysis membrane. The absorbance spectrum was recorded at regular intervals. Within 2–3 h, the protein absorption increased because the protein settled on the ATR crystal. After the absorption spectrum of the sample became time-independent, a 500-scan, single-beam spectrum (background spectrum) was recorded. Then 2 μL of PEP (50 mM, pH 7.5) were added to the 4 mL solution in the reservoir, after which 20 spectra in the absorption mode (150 scans each) were recorded for 4 min. Addition of PEP and spectra recording was repeated up to three times. For activity measurements, 50 μM of ADP was added to the reservoir before recording of the background spectra and the addition of PEP.
Evaluation of bond strengths and bond lengths
Bond parameters for the phosphate group were then derived, using our work on the Ca2+-ATPase (25) that was based on a study by Deng et al. (26). From the band positions of the symmetric and asymmetric stretching vibrations of the terminal P-O bonds, a fundamental frequency or wavenumber ν can be calculated according to ν = [(νs2+2νas2) / 3]1/2 (26). The fundamental wavenumber can be used to calculate the bond valence of P-O bonds using the formula (26)
| (1) |
where s is bond valence in valence units (vu) of the terminal phosphate bonds and ν the fundamental wavenumber. Interactions between terminal phosphate oxygens and their environment were quantified according to the bond-valence model (27), which states that the sum of all bond valences around oxygen atoms is two. This sum includes covalent bonds and external bonds, i.e., interactions with the environment. Thus, the bond valence due to the interactions to each of the terminal oxygens is 2 minus the bond valance of the terminal bond. Parameters for the bridging P-O bond can similarly be obtained by subtracting the summed bond valences of the terminal P-O bonds from the atomic valence of phosphorus, which is five.
Because bond valences are defined by experimentally determined bond lengths, bond lengths can be determined from bond valences. In Eq. 2 (27), we applied the same parameters as had been used to derive the frequency versus bond valence correlation (Eq. 1) (26),
| (2) |
where Ls is the bond length of a bond with bond valence s measured in vu, and L1 is the bond length of a bond with a bond valence of 1 vu. The values L1 and N are constants for a given type of bond (28,29). For P-O bonds, they are N = 4.29 and L1 = 1.622 Å (29).
Two approaches were used to estimate the reduction of bond dissociation energy of the bridging P-O bond due to binding of PEP to PK:
Approach 1. Bond dissociation energy can be regarded as linear to bond valence (30).
Approach 2. Bond length L and bond dissociation energy E are correlated: for several oxides, the inverse relationship
Results
Infrared absorption spectra of PEP and pyruvate
In our study of PEP binding to PK we first measured the infrared (IR) absorption of the substrate PEP and the product pyruvate. Absorption spectra of ADP and ATP have been published before, both by us (33) and by others (34). The absorption spectrum of unlabeled PEP at pH 7.5 is presented in Fig. 2 a. The absorption band at 1569 cm−1 is attributed to the COO- antisymmetric stretching vibration and the band of the symmetric stretching vibration was observed at 1407 cm−1 (35). The band at 1229 cm−1 is attributed to the C-O(P) stretching vibration according to density functional theory calculations (36) and in analogy to the phenyl C-O-P linkage (35). In the phosphate absorption region, the (-PO32-) stretching vibration bands were observed at 1103 and 974 cm−1 and a mode composed of C-C stretching and COO- scissoring vibrations at 879 cm−1 (36). The band positions in D2O were the same as in H2O except for the COO− stretching vibrations and for the symmetric -PO32- stretching vibration, which were observed at 1574 cm−1 (+5 cm−1), 1411 cm−1 (+3 cm−1), and 972 (−2 cm−1), respectively. The spectrum of (2,3-13C2)-labeled PEP at pH 7.5 is presented in Fig. 2 b. The antisymmetric COO− stretching vibration splits into two bands at 1589 and 1558 cm−1 with the main band shifting downwards by 11 cm−1. The symmetric stretching vibration shifts by only 5 cm−1 to lower wavenumbers, whereas a strong 24 cm−1 downshift is observed for the C-O stretching vibration. All other band positions are only slightly affected by labeling shifting down 1, 2, and 4 cm−1 for the asymmetric and the symmetric -PO32- stretching vibrations and the C-C stretching/COO- scissoring vibration, respectively.
Figure 2.

Infrared spectra of (a) 100 mM unlabeled PEP, (b) 50 mM labeled PEP, and (c) 100 mM pyruvate dissolved in H2O at pH 7.5.
The absorption spectrum of pyruvate at pH 7.5 is presented in Fig. 2 c. The keto carbonyl stretch is observed at 1708 cm−1, whereas the COO- antisymmetric stretching vibration absorbs at 1600 cm−1 (37). The COO- symmetric stretching vibration contributes to two bands at 1421 cm−1 and 1399 cm−1 (37) and the band of the CH3 deformation vibration is observed at 1358 cm−1. The band at 1175 cm−1 is due to the C-CH3 stretching vibration (38). The COO- antisymmetric stretching vibration was observed at 1616 cm−1 in D2O, whereas other band positions were the same as in H2O.
Infrared difference spectra of PEP binding to PK: general features and data evaluation
In the following, we will discuss absorbance changes upon PEP binding to PK. The spectra shown are difference spectra, revealing the absorbance change due to binding. Positive bands in the difference spectra are due to bound and free PEP as well as to protein absorption of the quaternary complex PK·PEP·Mg2+·K+, while negative bands are due to protein absorption of PK·Mg2+·K+. The effect of three PEP additions to PK samples in H2O and in the presence of K+ is shown in Fig. 3 (difference spectra in Fig. 3, a–e). The difference spectra were recorded at pH 7.5 at room temperature within 4 min after PEP addition. Difference spectra a–c show absorbance changes due to PEP binding to PK upon the first addition of PEP at different times after the addition (84, 180, and 240 s). Protein conformational changes are indicated particularly by bands in the amide I region (1700–1610 cm−1). Subsequent additions of PEP (difference spectra in Fig. 3, d and e, for the second and third additions, respectively) cause absorbance changes due to an increase of the concentration of free PEP (bands at 1567, 1407, 1229, 1107, and 974 cm−1). These band positions are slightly different from those found in the absorption spectra because of different buffer and salt concentrations. No distinct features are observed in the amide I region in the second and third additions demonstrating the absence of conformational changes and that the amount of PEP added in the first addition was sufficient to saturate the binding sites.
Figure 3.

Infrared absorbance changes of PK upon PEP binding in the presence of K+ and Mg2+ in H2O. Traces a–c reflect 96, 180, and 240 s spectra after addition of 25 μM PEP. Traces d and e show spectra of the subsequent additions of 25 μM PEP measured 240 s after each addition. The spectra have been shifted vertically for a clearer presentation.
The initial difference spectrum at 84 s after the first addition is mainly due to formation of the PK·PEP complex, whereas the difference spectrum 240 s after the first addition also contains a contribution of the absorption of free PEP. This is concluded from the shift of the symmetric PO32- band near 970 cm−1, which is evident in the difference spectra from Fig. 3, a–c. The shift is shown more clearly in Fig. 4. Fig. 4 a depicts the evolution of this band upon the first addition of PEP. The -PO32- stretching vibration band shifts gradually from 966.6 cm−1 to 970.5 cm−1, as the PEP concentration increases. This is because, initially, all PEP is bound to PK, whereas later, the proportion of free PEP increases. Fig. 4 b shows the kinetics of the band shift. In addition 2 (Fig. 4 b) and addition 3, the band position is 974.5 cm−1, which coincides with the position of PEP in aqueous solution (Fig. 2 a). The final band position after the first addition is still 4 cm−1 below that of the second addition, indicating ∼50% free PEP at the end of the first addition.
Figure 4.

Evolution of the 970 cm−1 band after addition of PEP to PK. (a) Series of overlaid spectra showing the band of the symmetric PO32- stretching vibration after the first PEP addition. The spectra were recorded in H2O within 240 s after the addition of PEP and were smoothed over 25 cm−1. The band amplitude increased with time and the band position shifted. (b) Time course of the band position after the first (I) and the second addition (II) of PEP. Spectra were smoothed over 25 data points before evaluation of the band position. Kinetics of the IR absorbance change of PK, monitored by integrated band intensities at 1695 cm−1, upon PEP binding in H2O (c).
To determine the best time-interval for the observation of the PEP·PK complex with only little-contribution by free PEP, we evaluated also the kinetics of secondary structure changes of PK upon PEP binding, using the band at 1696 cm−1. The result is shown in Fig. 4 c. At 150 s, this signal of protein structural change saturates, indicating that binding is essentially complete. The rate-limiting step in our experiments is the diffusion of the ligand into the sample compartment. To minimize the contribution of free PEP and to maximize the signal of the PEP·PK complex, we evaluated the time-interval 84–144 s and normalized the spectrum to the amplitude of the amide I signals in the 240-s spectrum. The resulting difference spectrum, i.e., the PEP binding spectrum, is shown in Fig. 5 a. It has the symmetric PO32- stretching band at 968.1 cm−1, indicating <20% of free PEP.
Figure 5.

Binding-induced absorbance changes of PK and ligand. All spectra were recorded 84–144 s after the addition of ligand and normalized to the amplitude of the amide I signals in the 240 s spectrum. (a and b) Binding of unlabeled PEP in the presence of K+ and Mg2+ in (a) H2O and (b) D2O. (c) Binding of [2,3-13C] PEP in H2O. (d) Binding of PEP in the presence of Na+ and Mg2+ in H2O. (e and f) Mg2+ binding to PK in the presence of K+ in (e) H2O and (f) D2O. Band positions are labeled in panels b–d if they differ from the respective positions in panel a. In panel f, only those bands are labeled that have a different position in panel e. The spectra have been shifted vertically for a clearer presentation.
Infrared difference spectra of PEP binding to PK: band assignment
Fig. 5 compares PEP binding spectra for different conditions. They were obtained as described in the previous section. In PEP binding spectrum a, difference bands are observed in the amide I spectral region, which is predominantly a C=O vibration of the protein backbone and absorbs between 1700 and 1610 cm−1. The amide I absorption is sensitive to protein backbone structure, and has been used for secondary structure analysis. According to the literature (39–47), we tentatively assign the 1696(+) and 1678(−) cm−1 bands to turns or β-sheets, the signal at 1663(+) cm−1 to α-helical structures, and the bands in the spectral region 1647–1621 cm−1 to β-sheets. The assignment of the 1696, 1678, 1663, and 1647 cm−1 bands to amide I modes is supported by the respective PEP binding spectrum recorded in D2O (spectrum in Fig. 5 b) where these bands are found at slightly lower wavenumbers. These results indicate that PK undergoes conformational changes when the substrate PEP binds, and it involves all types of secondary structures.
The positive bands at 1590 and 1551 cm−1 (difference spectra in Fig. 3, a–c) are assigned to the antisymmetric stretching mode of COO- groups, which is supported by their upshifts in spectra recorded in D2O (Fig. 5 b). The positive band at 1415 cm−1 (Fig. 5 a) is assigned to the symmetric stretching mode of COO- groups.
The band at 1485 cm−1 is in the spectral range of the absorption of the asymmetric CH3 bending vibration. The band shifts in D2O to 1467 cm−1, which is indicative of Thr CH3 absorption (48). Because the side chain of Thr327 lies in the active site and interacts with the carboxylate of L-phospholactate (4), we tentatively assign the band at 1485 cm−1 to the asymmetric CH3 bending vibration of Thr327. Bands at 1214 cm−1 and below will be assigned in the following paragraph with help of a PEP binding spectrum obtained with labeled PEP.
Infrared difference spectra of PEP binding to PK: bands of bound PEP
Bands of bound PEP were assigned with help of 2,3-13C2 labeling of PEP (see Fig. 1). The PEP binding spectrum obtained for the labeled PEP is shown in Fig. 5 c and is compared in the following to the respective spectrum for unlabeled PEP in Fig. 5 a. The coincidence of all signals in the amide I region (1700–1610 cm−1) illustrates the excellent reproducibility of our spectra. Isotopic labeling perturbs the bands at 1590, 1415, 1214, and 968 cm−1. The latter three shift down by a few cm−1, as expected for isotopic labeling of PEP according to Fig. 2, and are therefore assigned to the symmetric carboxylate stretching vibration, the C-O stretching vibration, and the symmetric PO32- stretching vibration, respectively, of bound PEP. The respective band positions of PEP in solution are 1407, 1229, and 974 cm−1, which indicates that binding changes geometry and bond strengths of the carboxylate and phosphate groups. Regarding the 1111 cm−1 band, the second derivative of the two PEP binding spectra (data not shown) reveals two components at 1124 and 1110 cm−1. The former can clearly be seen as shoulder in the PEP binding spectrum, and the latter corresponds to the main band. We assign both components to the phosphate group of bound PEP because the band area of the asymmetric stretching vibration, according to Fig. 2, is considerably larger than that of the symmetric stretching vibration. The expected isotope shift of 1 cm−1 will be difficult to detect in the difference spectrum, partly due to the presence of a small fraction of free PEP molecules that alters the position of the main band. Both component bands of the asymmetric PO32- stretching vibration of bound PEP are upshifted with respect to the respective band of PEP in aqueous solution, which is found at 1107 cm−1 under the conditions of our experiment (Fig. 3 e).
The situation is more complicated for the 1590 cm−1 band. It clearly loses intensity and splits into two bands at 1596 and 1576 cm−1. According to the component band positions in the second derivative spectra (not shown), the downshift is 15 cm−1. This number is close to the 11 cm−1 shift observed in aqueous solution. Therefore, we assign the 1590 cm−1 band to the antisymmetric carboxylate stretching vibration of bound PEP. The upshift for the high-frequency component at 1596 cm−1 is 6 cm−1, which is smaller than the expected 21 cm−1. We note that the upshifted component band, according to Fig. 2, is expected to have a very low intensity and might be masked by overlapping protein bands or bands from minor binding modes of PEP.
In conclusion, the isotope effect on the 1590 cm−1 band clearly indicates that the antisymmetric carboxylate stretching vibration of bound PEP absorbs near 1590 cm−1. The band position is 21 cm−1 upshifted compared to the band position in aqueous solution, revealing a distinct interaction with the protein that will be further discussed below. The adjacent carboxylate band at 1551 cm−1 is not perturbed by isotopic labeling of PEP. It is therefore assigned to carboxylate groups of Asp or Glu residues—tentatively to those of Glu271 and Asp295, which coordinate Mg2+, or to Asp112, which binds K+ (4).
PEP binding spectrum in the presence of the activating monovalent ion Na+
The effect of the activating monovalent cation on PEP binding was also studied. Fig. 5 d shows the PEP binding spectrum in the presence of Na+, whereas those previously discussed were in the presence of K+ (Fig. 5 a). The shape of the PEP binding spectrum is similar, with both cations above 1650 cm−1. Thus α-helical and turn secondary structure elements are perturbed in a similar way by PEP binding with both cations. Differences are observed in the β-sheet region where a band at 1647 in the presence of K+ shifts to 1641 cm−1 in the presence of Na+ and the negative band at 1632 cm−1 (K+) is not observed with Na+. Bands of bound PEP are found at the same positions for Na+ and K+, with the exception of the band of the symmetric carboxylate vibration of PEP that shifts from 1415 cm−1 with K+ to 1417 with Na+. Overall, the spectra indicate very similar interactions between protein and substrate with both cations, with a slight modification of the interactions of the carboxylate group.
Infrared difference spectra of Mg2+ binding to PK
The following section discusses absorbance changes upon Mg2+ binding to PK. The difference spectra obtained are named Mg2+ binding spectra. Positive bands in the Mg2+ binding spectra are due to PK·Mg2+·K+, whereas negative bands are due to PK·K+. The Mg2+ binding spectrum in the presence of K+ in H2O is shown in Fig. 5 e. Spectrum e was obtained upon the first addition of Mg2+. Second and third additions gave featureless spectra (data not shown). In the Mg2+ binding spectrum, difference bands are observed in the spectral region 1750–900 cm−1. Upon comparison with the respective spectrum in D2O (spectrum in Fig. 5 f), some of the bands can be assigned. The band at 1694 cm−1 shifts down to 1675 cm−1, which is indicative of the C=O stretching vibration of Asn or Gln. The bands at 1485 cm−1 in H2O and 1467 cm−1 in D2O induced by PEP binding (Fig. 5 a) are also found upon Mg2+ binding, and are again tentatively assigned to the asymmetric CH3 bending mode of Thr327. The positive band at 1417 cm−1 is due to the symmetric stretching mode of COO− groups, which is supported by its upshift in spectra recorded in D2O (Fig. 5 f). All other bands are in convoluted regions of the spectrum and there is no unique way to interpret the shifts observed in D2O. Possible assignments (47,49,50) and deuteration-induced shifts are:
1664 cm−1 (H2O) → 1647 cm−1 (D2O, Asn, Gln),
1664 cm−1 → 1606 cm−1 (Arg),
1645 → 1647 cm−1 (β-sheet, band shift probably only apparent because of overlap by other bands),
1645/1630 cm−1 → 1606/1587 cm−1 (Arg),
1616, 1596 cm−1 (H2O, not observed in D2O, Asn, Gln),
1569/1545 cm−1 → 1587/1569 cm−1 (Asp, Glu, shift is larger than usual probably because of overlap by other bands),
1545 cm−1 (H2O, not observed in D2O, amide II).
Infrared difference spectrum of the catalytic reaction
The spectrum shown in Fig. 6 shows absorbance changes due to the catalytic reaction of PK. The initial state of the sample was a mixture of PK and ADP to which PEP was then added, and the difference spectra reveal the absorbance changes upon PEP addition. The spectrum shown in Fig. 6 is the average of spectra recorded during 4 min after PEP addition. Because of coincidence of the band positions in the difference spectrum (Fig. 6) with those of reactants and products (Fig. 2, a and c, (33,34)), we attribute the positive bands at 1600, 1358, and 1176 cm−1 to the formation of pyruvate (Fig. 2 c), absorption at 1248–1232, 989, and 914 cm−1 to ATP production (35,36), the negative band at 940 cm−1 to ADP consumption (33,34), and the negative bands at 975 cm−1 and 1103 cm−1 to PEP consumption (Fig. 2 a). This indicates that PK is active in our IR samples.
Figure 6.

Enzymatic reaction of PK. Changes of IR absorbance induced by addition of PEP to PK and ADP. The initial state of the sample was a mixture of PK·Mg2+·K+ and ADP, then PEP was added. The spectrum shown is averaged over the first 4 min after PEP addition.
The spectra are difficult to interpret in the amide I region because some bands are caused by protein backbone changes and others by the formation of pyruvate and ATP. For example, the bands at 1702 and 1619 cm−1 could be due to bound pyruvate. Compared to the PEP binding spectrum (Fig. 5 a), new bands are observed at 1680(+) and 1638(−) cm−1 and the positive band at 1644 cm−1 is missing in the spectrum of steady-state turnover. This indicates that the conformation at steady state is different from that induced by PEP binding.
Discussion
The structural change of PK upon PEP binding
Spectroscopic studies can provide a detailed understanding of the conformational changes that occur when a ligand binds to a protein. In the case of pyruvate kinase, x-ray (3,4,51–53), NMR (13,15), small angle neutron scattering (54), and IR (23) studies are available. PEP binding by PK leads to a more compact conformation of the protein (4,54) due to closure of the cleft between A and B domains. The previous IR study showed that PEP binding does not induce significant interconversion between secondary structures in PK, but does affect the microenvironment of the backbone (23). Our results agree with this finding. However, by using reaction-induced IR difference spectroscopy, we were able to detect the small IR absorbance changes associated with PEP and Mg2+ binding. Only the changes at 1661 and 1639 cm−1 (Fig. 5 b) have been identified in the previous IR study (23).
Our spectra give evidence for an involvement of β-sheets, turns, and α-helical segments in the structural change upon PEP binding. The spectra can be interpreted in terms of secondary structure changes but are also sensitive to more subtle changes of backbone structure and hydrogen bonding within persisting secondary structure elements. To quantify the structural changes of the polypeptide backbone upon PEP binding to PK, we used the change of backbone structure and interaction (COBSI) index (45,55). It relates the integrated intensity in the amide I region, which is redistributed upon the reaction, to the integrated total protein absorbance in that region. The COBSI index for PEP binding to PK is 0.0014, which is more than two orders-of-magnitude smaller (<1%) than COBSI indices for 100% secondary structure changes (55). This indicates that ∼1% of the peptide groups contribute to a net change in backbone structure. The COBSI index gives realistic estimates of the net change of secondary structure (45,56). The total number of residues that experience a secondary structure change may actually be larger; however, these are not revealed in the IR spectra when opposing changes in different regions of the protein largely compensate (56). We conclude that the net change of backbone structure of PK upon PEP binding is small but clearly detectable with FTIR spectroscopy.
Infrared absorption of bound PEP
From our experiments with labeled PEP, we identified all major absorption bands of PEP bound to PK. We obtained the following assignments: 1590 cm−1 (antisymmetric carboxylate stretching vibration), 1415 cm−1 (symmetric carboxylate stretching vibration), 1214 cm−1 (C-O stretching vibration), 1124 and 1110 cm−1 (asymmetric PO32- stretching vibration), and 968 cm−1 (symmetric PO32- stretching vibration). The corresponding band positions in solution are 1567, 1407, 1229, 1107, and 974 cm−1 under the conditions of our experiment (Fig. 3, d and e). The spectral positions of bound PEP are shifted from their positions in aqueous solution, which indicates different interactions in water and when bound to the protein. In the following, we will quantify the changes in bond parameters between the bound and free forms.
Bond parameters of the phosphate group of bound PEP
Bond parameters for the phosphate group were derived following our previous work on the Ca2+-ATPase (25) as described in Materials and Methods. They are collected in Table 1. The absolute error in bond lengths determined in this way has been estimated to 0.004 Å from a comparison between measured bond lengths and lengths determined from vibrational frequencies (26). This corresponds to an error in bond valence of 0.011 vu for the bridging P-O bond and of 0.015 vu for the terminal P-O bonds using the relationship between bond length and bond valence (Eq. 2). This error holds when the correlation is applied to a set of different molecules. As pointed out previously (57), a large contribution to this error is due to the coupling of the P-O vibrations with other vibrations, which is different for different molecules. However, the coupling will be very similar and the error largely abolished when the same molecule in slightly different environments is compared. Therefore, the error in this case is mainly determined by the accuracy of determining the band position. For free PEP, we assumed an accuracy of the band position of ±0.5 cm−1, which is an upper limit of the actual error. A deviation of ±0.5 cm−1 in the band positions changes bond valences by <0.002 vu and bond lengths by <0.001 Å. For the symmetric P-O stretching vibration, we used its initial band position at 967 cm−1 in the evaluation and assumed the same accuracy of 0.5 cm−1. The main error for the asymmetric P-O stretching vibration stems from the difficulty involved in being able to observe a clear isotope shift. The values calculated are based on the assignment given above, where the 1124 and the 1110 cm−1 components were assigned to the two asymmetric stretching vibrations of the phosphate of bound PEP. Two limiting cases were used to estimate the error of the bond parameters: one where both asymmetric vibrations absorb at 1110 cm−1 and one where both absorb at 1124 cm−1. In all cases, the upshift of the asymmetric phosphate stretching vibration indicates a shortening of the terminal P-O bonds. They are ≤0.3 pm shorter for bound PEP, illustrating the extraordinary sensitivity of IR spectroscopy to bond-length changes. Their bond valence is 1.330 vu for bound PEP and 1.325 vu for free PEP, i.e., <1% higher for bound PEP. These effects are due to weaker interactions of the terminal oxygens of bound PEP with their environment, which amount to 0.670 vu (2–1.330) for bound PEP and 0.675 vu for free PEP, i.e., 1% weaker for bound PEP. These values can be compared to that for hydrogen bonds between water molecules (0.17 vu) (27), which indicates that the strength of interaction with the terminal phosphate oxygens amounts to nearly four typical hydrogen bonds per oxygen for bound and free PEP. In conclusion, there is little change in the bond parameters of the terminal P-O bonds due to binding of PEP, and the strength of interaction between phosphate group and environment is similar for bound and free PEP. This indicates that there is little contribution of the phosphate group to the binding enthalpy of PEP.
Table 1.
Properties of the phosphate group of bound and free PEP
| Phosphate group of bound PEP |
Phosphate group of free PEP |
|||
|---|---|---|---|---|
| Terminal oxygen | Bridging P-O | Terminal P-O | Bridging P-O | |
| Wavenumbers of P-O stretching vibrations/cm−1 | 1124, 1110, 967 | 1107, 974 | ||
| P-O fundamental frequency or wavenumber/cm−1 | 1069 | 1065 | ||
| P-O bond valence/vu | 1.330 ± 0.005 | 1.010 ± 0.015 | 1.3251 ± 0.0005 | 1.0246 ± 0.0015 |
| Bond valence of external bonding/vu | 0.670 ± 0.005 | 0.675 ± 0.0005 | ||
| P-O bond length/Å | 1.5177 ± 0.0014 | 1.618 ± 0.006 | 1.5190 ± 0.0002 | 1.6128 ± 0.0006 |
| Reduction of bond dissociation energy of bound PEP relative to free PEP | 1.4% (range 0–3%);6 kJ/mol (range 0–12 kJ/mol) | |||
The error of the bond parameters for bound PEP was determined as described in the text.
The bond length of the bridging P-O bond is ≤3 pm longer for bound PEP. Its bond valence was determined to 1.01 vu (5–3 × 1.330) for bound PEP and to 1.025 vu for free PEP, i.e., 1.4% weaker for bound PEP. Thus, the enzyme environment weakens the bond that is cleaved in the enzymatic reaction already in the ground state of the complex between PK and PEP. This weakening is, however, very small. Regarding bond dissociation energy as linear to bond valence (30) and assuming that the bridging P-O bond of free PEP has a typical P-O single bond energy of 420 kJ/mol, the bond energy is reduced by 6 kJ/mol (1.4%) upon binding of PEP. A second estimation, using a bond-energy-versus-bond-length correlation, gives a similar reduction. The maximum reduction in bond energy obtained in one of the limiting cases is 3%. This is in sharp contrast to our study on the E2P phosphoenzyme of the Ca2+-ATPase (25) where the P-O bond to be cleaved is weakened considerably by the enzyme environment. In conclusion, the bond dissociation energy of the bridging P-O bond is weakened by only a few percent upon binding of PEP to PK. Thus, there is no indication that binding considerably distorts the substrate PEP toward a dissociative transition state in the phosphate transfer reaction. This is in line with the suggestion of an associative transition state (58).
Bond parameters of the carboxylate group of bound PEP
For the interactions of the carboxylate group, we evaluated the quantum chemical calculations on the Hartree-Fock level from Nara et al. (59). Our study calculated vibrational frequencies and bond parameters for acetate in 15 different environments, with and without interaction with explicit water and several ions in different coordination modes. We found that the shorter bond length Lshort correlates with the band position of the antisymmetric stretching vibration of the carboxylate group (νas). From the correlation (data not shown) a shortening of the shorter bond of ∼0.5 pm is inferred when PEP binds to PK. However, this length change is similar to the deviation of individual data points from the trend line (0.7 pm). Therefore, a shortening of the shorter bond cannot safely be concluded. However, the maximum length change of the shorter bond can be estimated to ∼1.3 pm (0.5 + 0.7 pm). As for the phosphate group, it is concluded that the bond length of the shorter carboxylate C-O bond is only little-perturbed upon binding of PEP to PK.
Monitoring enzyme activity with infrared spectroscopy
Fig. 6 illustrates the benefits of using infrared (IR) spectroscopy for enzyme activity measurements (60), in which ultraviolet visible spectroscopy is used in indirect enzyme activity assays. In contrast, IR spectroscopy is a method by which one can directly follow enzymatic reactions and also identify their reactants and products. Here, we were able to observe the consumption of ADP and PEP as well as the production of ATP and pyruvate due to the enzymatic activity of PK.
Conclusions
This work presents the first reaction-induced IR difference spectra of PK. Infrared absorbance changes upon binding of PEP were recorded with high sensitivity and high reproducibility. They indicate small secondary structure changes that affect all types of secondary structure. The absorption bands of bound PEP were identified with help of isotopic labeling of PEP. They indicate only little perturbation of the covalent bonds of PEP upon binding: a weakening of the bridging P-O bond by <3% and a bond-length change of the stronger carboxylate C-O bond by maximal 1.3 pm. Replacement of the activating monovalent ion K+ by Na+ does not change the binding mode of PEP. It is concluded that the protein environment distorts the structure of PEP very little toward that of a dissociative transition state in the phosphate transfer reaction. The smallness of the effect is also in line with an associative transition state.
Acknowledgments
We are grateful to Sven och Lilly Lawskis Fond för Naturvetenskaplig Forskning for a PhD stipend to S.K. and thank Knut och Alice Wallenberg Stiftelse for funding the spectrometer. The running costs were provided by Vetenskapsrådet.
References
- 1.Seeholzer S.H., Jaworowski A., Rose I.A. Enolpyruvate: chemical determination as a pyruvate kinase intermediate. Biochemistry. 1991;30:727–732. doi: 10.1021/bi00217a022. [DOI] [PubMed] [Google Scholar]
- 2.Rose I.A. Stereochemistry of pyruvate kinase, pyruvate carboxylase, and malate enzyme reactions. J. Biol. Chem. 1970;245:6052–6056. [PubMed] [Google Scholar]
- 3.Larsen T.M., Benning M.M., Reed G.H. Structure of the bis(Mg2+)-ATP-oxalate complex of the rabbit muscle pyruvate kinase at 2.1 Å resolution: ATP binding over a barrel. Biochemistry. 1998;37:6247–6255. doi: 10.1021/bi980243s. [DOI] [PubMed] [Google Scholar]
- 4.Larsen T.M., Benning M.M., Reed G.H. Ligand-induced domain movement in pyruvate kinase: structure of the enzyme from rabbit muscle with Mg2+, K+, and L-phospholactate at 2.7 Å resolution. Arch. Biochem. Biophys. 1997;345:199–206. doi: 10.1006/abbi.1997.0257. [DOI] [PubMed] [Google Scholar]
- 5.Gupta R.K., Oesterling R.M., Mildvan A.S. Dual divalent cation requirement for activation of pyruvate kinase; essential roles of both enzyme- and nucleotide-bound metal ions. Biochemistry. 1976;15:2881–2887. doi: 10.1021/bi00658a028. [DOI] [PubMed] [Google Scholar]
- 6.Gupta R.K., Mildvan A.S. Structures of enzyme-bound metal-nucleotide complexes in the phosphoryl transfer reaction of muscle pyruvate kinase. 31P NMR studies with magnesium and kinetic studies with chromium nucleotides. J. Biol. Chem. 1977;252:5967–5976. [PubMed] [Google Scholar]
- 7.Baek Y.H., Nowak T. Kinetic evidence for a dual cation role for muscle pyruvate kinase. Arch. Biochem. Biophys. 1982;217:491–497. doi: 10.1016/0003-9861(82)90529-x. [DOI] [PubMed] [Google Scholar]
- 8.Boyer P.D., Lardy H.A., Phillips P.H. The role of potassium in muscle phosphorylations. J. Biol. Chem. 1942;146:673–682. [Google Scholar]
- 9.Kayne F.J. Pyruvate kinase. In: Boyer P.D., editor. Enzymes. Academic Press; New York: 1973. [Google Scholar]
- 10.Nowak T., Suelter C.H. Pyruvate kinase: activation by and catalytic role of the monovalent and divalent cations. Mol. Cell. Biochem. 1981;35:65–75. doi: 10.1007/BF02354821. [DOI] [PubMed] [Google Scholar]
- 11.Suelter C.H., Singleton R., Mildvan A.S. Studies on the interaction of substrate and monovalent and divalent cations with pyruvate kinase. Biochemistry. 1966;5:131–139. doi: 10.1021/bi00865a017. [DOI] [PubMed] [Google Scholar]
- 12.Wilson R.H., Evans H.J., Becker R.R. The effect of univalent cation salts on the stability and on certain physical properties of pyruvate kinase. J. Biol. Chem. 1967;242:3825–3832. [PubMed] [Google Scholar]
- 13.Mildvan A.S., Cohn M. Kinetic and magnetic resonance studies of the pyruvate kinase reaction. II. Complexes of enzyme, metal, and substrates. J. Biol. Chem. 1966;241:1178–1193. [PubMed] [Google Scholar]
- 14.Larsen T.M., Laughlin L.T., Reed G.H. Structure of rabbit muscle pyruvate kinase complexed with Mn2+, K+, and pyruvate. Biochemistry. 1994;33:6301–6309. doi: 10.1021/bi00186a033. [DOI] [PubMed] [Google Scholar]
- 15.Nowak T. Structural changes at the active site of pyruvate kinase during activation and catalysis. J. Biol. Chem. 1978;253:1998–2004. [PubMed] [Google Scholar]
- 16.Gourion-Arsiquaud S., Chevance S., Berthomieu C. Identification of a Cd2+- and Zn2+-binding site in cytochrome c using FTIR coupled to an ATR microdialysis setup and NMR spectroscopy. Biochemistry. 2005;44:8652–8663. doi: 10.1021/bi050322l. [DOI] [PubMed] [Google Scholar]
- 17.Barth A., Zscherp C. Substrate binding and enzyme function investigated by infrared spectroscopy. FEBS Lett. 2000;477:151–156. doi: 10.1016/s0014-5793(00)01782-8. [DOI] [PubMed] [Google Scholar]
- 18.Zscherp C., Barth A. Reaction-induced infrared difference spectroscopy for the study of protein reaction mechanisms. Biochemistry. 2001;40:1875–1883. doi: 10.1021/bi002567y. [DOI] [PubMed] [Google Scholar]
- 19.Kim S., Barry B.A. Reaction induced FTIR spectroscopic studies of biological energy conversion in oxygenic photosynthesis and transport. J. Phys. Chem. 2001;105:4072–4083. [Google Scholar]
- 20.Jung C. Insight into protein structure and protein-ligand recognition by Fourier transform infrared spectroscopy. J. Mol. Recognit. 2000;13:325–351. doi: 10.1002/1099-1352(200011/12)13:6<325::AID-JMR507>3.0.CO;2-C. [DOI] [PubMed] [Google Scholar]
- 21.Fahmy K. Binding of transducin and transducin-derived peptides to rhodopsin studies by attenuated total reflection-Fourier transform infrared difference spectroscopy. Biophys. J. 1998;75:1306–1318. doi: 10.1016/s0006-3495(98)74049-4. [DOI] [PMC free article] [PubMed] [Google Scholar]
- 22.Krasteva M., Kumar S., Barth A. A dialysis accessory for attenuated total reflection infrared spectroscopy. Spectroscopy. 2006;20:89–94. [Google Scholar]
- 23.Yu S., Lee L.L.-Y., Lee J.C. Effects of metabolites on the structural dynamics of rabbit muscle pyruvate kinase. Biophys. Chem. 2003;103:1–11. doi: 10.1016/s0301-4622(02)00146-1. [DOI] [PubMed] [Google Scholar]
- 24.Glasoe P.K., Long F.A. Use of glass electrodes to measure acidities in deuterium oxide. J. Phys. Chem. 1960;64:188–190. [Google Scholar]
- 25.Barth A., Bezlyepkina N. P-O bond destabilization accelerates phosphoenzyme hydrolysis of sarcoplasmic reticulum Ca2+ -ATPase. J. Biol. Chem. 2004;279:51888–51896. doi: 10.1074/jbc.M410867200. [DOI] [PubMed] [Google Scholar]
- 26.Deng H., Wang J., Ray W.J. Relationship between bond stretching frequencies and internal bonding for [16O4]- and [18O4] phosphates in aqueous solution. J. Phys. Chem. B. 1998;102:3617–3623. [Google Scholar]
- 27.Brown I.D. The Bond Valence Model. Oxford University Press; Oxford, UK: 2002. The chemical bond in inorganic chemistry. [Google Scholar]
- 28.Brown I.D., Shannon R.D. Empirical bond-strength-bond-length curves for oxides. Acta Crystallogr. A. 1973;29:266–282. [Google Scholar]
- 29.Brown I.D., Wu K.K. Empirical parameters for calculating cation-oxygen bond valences. Acta Crystallogr. B. 1976;32:1957–1959. [Google Scholar]
- 30.Ziólkowski J. Advanced bond-strength model of active sites on oxide catalysis. J. Catal. 1983;84:317–332. [Google Scholar]
- 31.Ziólkowski J., Dziembaj L. Empirical relationship between individual cation-oxygen bond length and bond energy in crystals and in molecules. J. Solid State Chem. 1985;57:291–299. [Google Scholar]
- 32.Ziólkowski J. New relation between ionic radii, bond length, and bond strength. J. Solid State Chem. 1985;57:269–290. [Google Scholar]
- 33.Barth A., Mäntele W. ATP-Induced phosphorylation of the sarcoplasmic reticulum Ca2+ ATPase: molecular interpretation of infrared difference spectra. Biophys. J. 1998;75:538–544. doi: 10.1016/S0006-3495(98)77543-5. [DOI] [PMC free article] [PubMed] [Google Scholar]
- 34.Takeuchi H., Murata H., Harada I. Interaction of adenosine 5′ triphosphate with Mg2+: vibrational study of coordination sites by use of O18 labeled triphosphates. J. Am. Chem. Soc. 1988;110:392–397. [Google Scholar]
- 35.Colthup N.B., Daly L.H., Wiberley S.E. 2nd Ed. Academic Press; New York: 1975. Introduction to Infrared and Raman Spectroscopy. [Google Scholar]
- 36.Rudbeck M.E., Kumar S., Barth A. Infrared spectrum of phosphoenol pyruvate: computational and experimental studies. J. Phys. Chem. A. 2009;113:2935–2942. doi: 10.1021/jp809638u. [DOI] [PubMed] [Google Scholar]
- 37.Wright W.W., Vanderkooi J. Use of IR absorption of the carboxyl group of amino acids and their metabolites to determine pKs, to study proteins and to monitor enzymatic activity. Biospectroscopy. 1997;3:457–467. [Google Scholar]
- 38.Kakihana M., Okamoto M. Vibrational analysis of pyruvate ion molecules and estimation of equilibrium constants for their hydrogen isotopic exchange reactions. J. Phys. Chem. 1984;88:1797–1804. [Google Scholar]
- 39.Goormaghtigh E., Raussens V., Ruysschaert J.M. Attenuated total reflection infrared spectroscopy of proteins and lipids in biological membranes. Biochim. Biophys. Acta. 1999;1422:105–185. doi: 10.1016/s0304-4157(99)00004-0. [DOI] [PubMed] [Google Scholar]
- 40.Susi H., Byler D.M. Fourier transform infrared study of proteins with parallel β-chains. Arch. Biochem. Biophys. 1987;258:465–469. doi: 10.1016/0003-9861(87)90367-5. [DOI] [PubMed] [Google Scholar]
- 41.Arrondo J.L.R., Young N.M., Mantsch H.H. The solution structure of concanavalin A probed by FT-IR spectroscopy. Biochim. Biophys. Acta. 1988;952:261–268. doi: 10.1016/0167-4838(88)90125-2. [DOI] [PubMed] [Google Scholar]
- 42.Krimm S., Bandekar J. Vibrational spectroscopy and conformation of peptides, polypeptides, and proteins. Adv. Protein Chem. 1986;38:181–364. doi: 10.1016/s0065-3233(08)60528-8. [DOI] [PubMed] [Google Scholar]
- 43.Arrondo J.L.R., Muga A., Goñi F.M. Quantitative studies of the structure of proteins in solution by Fourier-transform infrared spectroscopy. Prog. Biophys. Mol. Biol. 1993;59:23–56. doi: 10.1016/0079-6107(93)90006-6. [DOI] [PubMed] [Google Scholar]
- 44.Jackson M., Mantsch H.H. The use and misuse of FTIR spectroscopy in the determination of protein structure. Crit. Rev. Biochem. Mol. Biol. 1995;30:95–120. doi: 10.3109/10409239509085140. [DOI] [PubMed] [Google Scholar]
- 45.Barth A., Zscherp C. What vibrations tell us about proteins. Q. Rev. Biophys. 2002;35:369–430. doi: 10.1017/s0033583502003815. [DOI] [PubMed] [Google Scholar]
- 46.Barth A. Infrared spectroscopy of proteins. Biochim. Biophys. Acta Bioenerg. 2007;1767:1073–1101. doi: 10.1016/j.bbabio.2007.06.004. [DOI] [PubMed] [Google Scholar]
- 47.Barth A. The infrared absorption of amino acid side chains. Prog. Biophys. Mol. Biol. 2000;74:141–173. doi: 10.1016/s0079-6107(00)00021-3. [DOI] [PubMed] [Google Scholar]
- 48.Pawlukojc A., Leciejewicz J., Parker S.F. Neutron scattering, infrared, Raman spectroscopy and ab initio study of L- threonine. Spectrochim. Acta [A] 2001;57:2513–2523. doi: 10.1016/s1386-1425(01)00508-x. [DOI] [PubMed] [Google Scholar]
- 49.Chirgadze Y.N., Fedorov O.V., Trushina N.P. Estimation of amino acid residue side-chain absorption in the infrared spectra of protein solutions in heavy water. Biopolymers. 1975;14:679–694. doi: 10.1002/bip.1975.360140402. [DOI] [PubMed] [Google Scholar]
- 50.Venyaminov S.Y., Kalnin N.N. Quantitative IR spectrophotometry of peptide compounds in water (H2O) solutions. I. Spectral parameters of amino acid residue absorption bands. Biopolymers. 1990;30:1243–1257. doi: 10.1002/bip.360301309. [DOI] [PubMed] [Google Scholar]
- 51.Mattevi A., Valentini G., Coda A. Crystal structure of Escherichia coli pyruvate kinase type I: molecular basis of the allosteric transition. Structure. 1995;3:729–741. doi: 10.1016/s0969-2126(01)00207-6. [DOI] [PubMed] [Google Scholar]
- 52.Muirhead H., Clayden D.A., Schmitt W. The structure of cat muscle pyruvate kinase. EMBO J. 1986;5:475–481. doi: 10.1002/j.1460-2075.1986.tb04236.x. [DOI] [PMC free article] [PubMed] [Google Scholar]
- 53.Friesen R.H.E., Castellani R.J., Braun W. Allostery in rabbit pyruvate kinase: development of a strategy to elucidate the mechanism. Biochemistry. 1998;37:15266–15276. doi: 10.1021/bi981273y. [DOI] [PubMed] [Google Scholar]
- 54.Consler G.T., Uberbacher C.E., Lee J.C. Domain interaction in rabbit muscle pyruvate kinase. J. Biol. Chem. 1988;25:2794–2801. [PubMed] [Google Scholar]
- 55.Barth A., von Germar F., Mäntele W. Time-resolved infrared spectroscopy of the Ca2+-ATPase. The enzyme at work. J. Biol. Chem. 1996;271:30637–30646. doi: 10.1074/jbc.271.48.30637. [DOI] [PubMed] [Google Scholar]
- 56.Liu M., Barth A. Phosphorylation of the sarcoplasmic reticulum Ca2+-ATPase from ATP and ATP analogs studied by infrared spectroscopy. J. Biol. Chem. 2004;279:49902–49909. doi: 10.1074/jbc.M408062200. [DOI] [PubMed] [Google Scholar]
- 57.Cheng H., Sukal S., Callender R. Vibrational structure of GDP and GTP bound to RAS: an isotope-edited FTIR study. Biochemistry. 2001;40:4035–4043. doi: 10.1021/bi0021131. [DOI] [PubMed] [Google Scholar]
- 58.Hassett A., Blättler W., Knowles J.R. Pyruvate kinase: is the mechanism of phospho transfer associative or dissociative? Biochemistry. 1982;21:6335–6340. doi: 10.1021/bi00268a002. [DOI] [PubMed] [Google Scholar]
- 59.Nara M., Torii H., Tasumi M. Correlation between the vibrational frequencies of the carboxylate group and the types of its coordination to a metal ion: an ab initio molecular orbital study. J. Phys. Chem. 1996;100:19812–19817. [Google Scholar]
- 60.Thoenges D., Barth A. Direct measurement of enzyme activity with infrared spectroscopy. J. Biomol. Screen. 2002;7:353–357. doi: 10.1177/108705710200700407. [DOI] [PubMed] [Google Scholar]