

Abstract
Protein-protein complex formation involves removal of water from the interface region. Surface regions with a small free energy penalty for water removal or desolvation may correspond to preferred interaction sites. A method to calculate the electrostatic free energy of placing a neutral low-dielectric probe at various protein surface positions has been designed and applied to characterize putative interaction sites. Based on solutions of the finite-difference Poisson equation, this method also includes long-range electrostatic contributions and the protein solvent boundary shape in contrast to accessible-surface-area-based solvation energies. Calculations on a large set of proteins indicate that in many cases (>90%), the known binding site overlaps with one of the six regions of lowest electrostatic desolvation penalty (overlap with the lowest desolvation region for 48% of proteins). Since the onset of electrostatic desolvation occurs even before direct protein-protein contact formation, it may help guide proteins toward the binding region in the final stage of complex formation. It is interesting that the probe desolvation properties associated with residue types were found to depend to some degree on whether the residue was outside of or part of a binding site. The probe desolvation penalty was on average smaller if the residue was part of a binding site compared to other surface locations. Applications to several antigen-antibody complexes demonstrated that the approach might be useful not only to predict protein interaction sites in general but to map potential antigenic epitopes on protein surfaces.
Introduction
Protein-protein interactions play a crucial role in many biological processes. Analysis of protein surfaces that can interact with other protein partners is of fundamental importance to better understand protein complex formation (1). The dissection of protein-protein binding sites has been studied in terms of association geometry (2–5) (size, shape, and complementarity) and physicochemical character of the interface (4–12) (type of chemical groups and amino acids, hydrophobicity, electrostatic interactions, hydrogen bonds, and hotspots). The distribution of amino acids at protein-protein interfaces differs from that at other exposed protein surfaces (5,9). Some general tendencies emerged from these analyses. Protein-protein interfaces are, to a large extent, well packed (9) and are often composed of a buried hydrophobic core surrounded by a more hydrophilic ring partly exposed to solvent (3,13–15) with an average buried surface size of 1600 Å2, that is, 800 Å2 per monomer (7). Hydrophobic interactions and electrostatic complementarity (16) are important driving forces for high-affinity binding (11,14). During protein-protein association, solvent molecules are largely excluded from the interface. The removal of water molecules introduces a large desolvation penalty that needs to be overcome upon binding and offset by attractive electrostatic and hydrophobic contributions.
Based on the analysis of protein interfaces, a number of approaches have been developed to predict putative interaction regions on protein surfaces (5,17–20). Such methods can be helpful to design site-directed mutagenesis experiments to verify putative interaction sites or to support modeling of the structure of protein-protein complexes (21,22). In the case of antigens, it is desirable to predict protein surface regions (antigenic epitopes) that are able to form high-affinity complexes with antibody molecules (23–26). The detection of putative binding sites is typically based on physicochemical properties of the surface region (e.g., interface propensity, hydrophobicity, or desolvation properties), on geometric properties (e.g., shape of the surface region or residue mobility), or on evolutionary conservation (27) of surface residues. Among the different protein surface characteristics, the solvation properties of surface regions have been found to be quite a strong indicator for a putative protein binding region (28).
Typically, the solvation or desolvation properties of surface regions are calculated from the loss of solvent accessible surface area that becomes buried upon complex formation. The desolvation penalty is calculated by assigning each surface element a weight according to solvation parameters (29,30) optimized to reproduce the experimental transfer free energies of amino acid side chains from vacuum, octanol, or some other reference state to water (31). The concept of surface-area-based desolvation has been used within the optimal docking area (ODA) algorithm (32). In this method, low-energy ODA hotspots are compared and correlate well with the known binding site. However, for ∼40% of a set of test structures, no overlap of the binding site with an ODA hotspot was found. Although surface-area-based solvation models have the advantage of providing a rapid estimate of the solvation energy or desolvation penalty, the calculation neglects the influence of the neighborhood on the solvation of a residue. In polar solvents like water, solute-solvent and solvent-solvent electrostatic interactions are predominant. The perturbation of the electrostatic field in the vicinity of an amino acid upon removal of water molecules is crucial for the desolvation process. Local effects that reduce solvation penalties—for example, due to the neutralization of a charged residue by a nearby residue of opposite charge or long-range electrostatic interactions—are omitted by surface-area-based solvation calculations.
In this study, we use a new and conceptually different approach to estimate the penalty of desolvation in a protein surface region. The finite-difference Poisson-Boltzmann approach is used to calculate the electrostatic free energy of placing a spherical neutral low-dielectric probe at various positions at the surface of a protein. The probe perturbs the electric field and gives rise to an energetic penalty to replace the high-dielectric aqueous region by a low-dielectric probe. The calculated penalty not only depends on the chemical groups in the immediate environment of the probe but also includes long-range electrostatic influences and depends on the shape of the protein dielectric boundary.
To test the ability of the approach to identify putative protein binding sites, it was applied to 156 proteins with known binding sites in bound and unbound conformations. Regions on the protein surface associated with a low electrostatic desolvation penalty were identified. In general, predicted regions with low electrostatic desolvation penalty correlated well with known protein-protein interfaces. Promising results were also found for the analysis and prediction of antigenic epitopes on proteins.
Materials and Methods
The Adaptive Poisson Boltzmann Solver (33) program was used to solve the finite-difference Poisson Boltzmann (FDBP) equation to calculate the electrostatic solvation free energy of a protein molecule. The Amber parm03 forcefield (34), in combination with the Amber xleap module (35) and the pdb2pqr (36) program, was used to assign atomic charges and radii. All residues were assigned standard ionization states (His-neutral). Future studies could potentially include prediction of ionization states of surface residues. Surface residues were those residues with accessible surface area >10 Å2. For the electrostatic calculations, a two-step focusing technique was applied starting with a coarse grid size equal to twice the dimension of the finest grid. The fine grid encompassed the full protein and was centered on the protein. With 129 points in each direction, the grid spacing was for all protein cases <0.5 Å, ensuring an accurate prediction of electrostatic properties. The molecular surface was generated using a water probe with radius of 1.4 Å. Dielectric constants of 10 and 80 were used for protein and solvent, respectively. The choice for the dielectric constant of the protein was a compromise between estimates for the buried interior of proteins (ɛ = 4) and surface regions (ɛ ∼ 20) (37,38). The electrostatic desolvation free energy of a low-dielectric spherical probe (ɛ = 10, radius 2 Å) was calculated by subtracting the electrostatic energy of the protein alone from the electrostatic energy of the system including the probe. Each electrostatic solvation calculation involved two sets of grid calculations (including focusing) for the system embedded in a high-dielectric environment (water) and in a low-dielectric environment (vacuum) using identical grids. The calculations were performed systematically for various surface positions of the probe distributed approximately evenly at a distance of 3 Å from each other (Fig. 1). Although this requires solving FDPB equations for every probe placement, such calculation was feasible within a few hours of computer time with the Adaptive Poisson Boltzmann multigrid solver.
Figure 1.
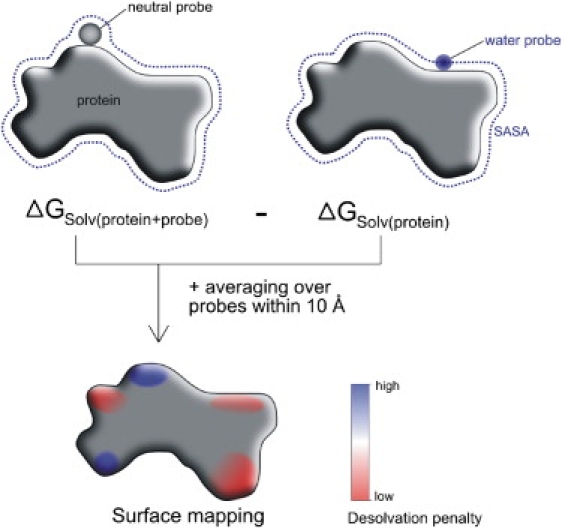
Calculation of the electrostatic desolvation of a neutral probe placed at the protein surface. (Upper) Electrostatic energies of protein + probe (left) and protein alone (right) are calculated from solutions of the finite-difference Poisson equation (see Methods), and the difference corresponds to the electrostatic penalty of placing the probe at the protein surface (dotted lines indicate the solvent-accessible surface used to define the dielectric boundary). The procedure is repeated for approximately evenly distributed probe placements at the protein surface (distance between probes ∼3 Å). Regions with the lowest electrostatic desolvation energy appear in red (light gray) and those with the highest penalty in blue (dark gray).
To estimate the electrostatic desolvation penalty of a surface patch, the average desolvation of all probes within a distance cutoff of 10 Å to a given surface point was calculated (∼25 probes/patch) and assigned to the surface defined by the probe molecules. The patch size (∼320 Å2) corresponds approximately to a lower limit of the size of a protein interface (note: the size of a protein binding interface as reported in the literature is typically >800 Å2, but since this figure includes the lost surface area on both partners, it represents approximately twice the value of the patch size as defined here). Averaging the desolvation free energy over a number of probes reduces possible grid-dependent errors associated with the FDPB calculations and local desolvation variation that depends on the exact placement of the probe with respect to the protein surface. At the same time, it has the advantage, compared to using one large probe (with a larger radius), that the effect of the shape of the surface (e.g., local curvature) on the desolvation free energy is still included in the calculations. Nevertheless, the effect of probe size was also assessed on a reduced test set of 24 proteins. Calculations were carried out with larger probe radii of 4, 6, and finally 10 Å (in this case, without averaging over the patch). It is of interest that although the absolute magnitude of the calculated desolvation penalties depended significantly on the size of the probe, the pattern of regions with low or high desolvation penalties was qualitatively similar (data not shown). For an example of a calculation performed with a 2-Å probe averaging over a patch with radius 10 Å compared to calculations using a 10-Å probe, see Fig. S3 in the Supporting Material.
For the prediction of possible protein binding sites, only the six probe positions with the lowest (average) desolvation penalty were considered. If two of the six probes were too close to each other (distance <10 Å), only the one with the lowest desolvation penalty was retained and the next probe in the list was then considered as a binding site center. A predicted low-desolvation probe was considered as a hit if the patch associated with the probe overlapped with the known protein interface area (that is, at least one residue within 10 Å from the probe center is part of the protein interface region). The correctness of a prediction is reported as the number of residues of the patch overlapping with the interface relative to the total number of residues in the patch. According to the procedure used in the CAPRI assessment (39), a residue was considered to be part of the interface if it was in contact (within 5 Å) with atoms of the partner protein in the complex. A first hit was defined as the predicted patch with the lowest desolvation energy that overlapped with the binding site, whereas a best hit fulfilled an additional criterion: the predicted patch had not only the lowest desolvation energy but also the highest correctness within the six predictions.
True and false positive predictions were also compared using receiver-operator characteristic (ROC) curves. The true positive rate (TPR) was calculated as the number of correctly predicted residues (TP) ranked in top solutions (desolvation energy in kJ·mol−1 per residue and per probe below an energy cutoff, increasing by 1.0 each time) divided by the total number of interface probes (TP plus false negative (FN)). The false positive rate was the number of predicted residues that are not in the interface (FP) divided by the total number of noninterface residues (FP plus true negative (TN)). A single measure to appreciate the prediction accuracy is the area under the curve (AUC). A value of 0.5 means random predictions, whereas 1 or 0 indicates a correlated or anticorrelated prediction, respectively.
The majority of protein structures were taken from the most recent compilation of protein-protein complexes in the protein-protein docking benchmark version 3.0 of Hwang et al. (40). Several additional antigen-antibody complexes not part of the benchmark set were also used (see Supporting Material). To label each protein partner, we used the pdb entry of the known complex and indicated one partner as ligand (entry_L, typically the smaller protein) and the second partner as receptor (entry_R) in accordance with the nomenclature in the benchmark set. Calculations were generally performed on proteins in the unbound conformation. For comparison, calculations on structures in the bound form were also performed in some cases. The pdb entry of each unbound protein structure is given in the Supporting Material. A total of 156 protein structures were considered and split into different categories: enzyme (E), enzyme inhibitor or substrate (I), antibody (Ab) and antigen (Ag), and other complexes (O). An additional test set of 10 lysozyme/antibody complexes were also exploited to illustrate the existence of multiple binding regions on the same protein and the ability of the method to detect them.
Results
Prediction of putative protein-binding sites based on probe desolvation penalty
The electrostatic desolvation free energy of placing a neutral low-dielectric sphere (radius 2 Å) at a given position of the protein surface can serve as an estimate of the free energy to remove water molecules from this protein region (or to replace it by the low-dielectric probe). The result is not only influenced by the locally buried surface area (as in surface-area-based solvation calculations) and the local charge distribution, but also depends on the shape of the dielectric boundary and on long-range electrostatic interactions (calculation illustrated in Fig. 1). It should be emphasized that the desolvation of the low-dielectric probe as defined here is a measure of the perturbation of the electric field and does not include nonelectrostatic effects.
Indeed, the calculated desolvation penalty for placing a sphere at the protein surface strongly depends on where it is placed at the protein surface and generally varies between 1.5 and 10 kJ·mol−1 (Fig. S1). It indicates a very significant variation of the free energy required to desolvate different protein surface regions. Regions of low desolvation penalty are especially likely to be part of protein binding sites. An example of overlap between a region with low calculated electrostatic desolvation penalty and an experimentally known protein binding site is illustrated in Fig. 2. To correlate regions of low electrostatic desolvation with known protein binding sites, up to six probe center positions for each protein with lowest desolvation penalty were considered. The associated average desolvation penalty of these regions was generally <4 kJ·mol−1, and for most proteins (>95%), it was <3 kJ·mol−1 (considerably smaller than the average desolvation penalty of the spheres (Fig. S1)).
Figure 2.
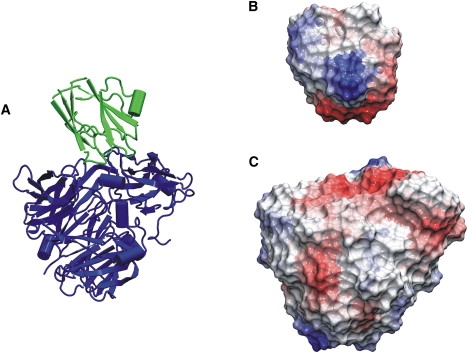
(A) Example of an enzyme inhibitor complex (pdb2MTA; blue (dark gray) for enzyme and green (light gray) for inhibitor). (B) Color-coded surface representation of the calculated electrostatic desolvation energy of neutral probes placed at the surface of the inhibitor (same view as in A). (C) Same as in B, but for the enzyme molecule. Red (light gray) indicates surface regions of low probe desolvation penalty and blue (dark gray) those of high desolvation penalties.
Comparison of the calculated positions of surface patches with low average desolvation for unbound and bound structures of proteins indicated some degree of conformation dependence. If one assumes a 50% overlap between lowest desolvation energy patches for proteins in their bound and unbound conformation, the predicted interface was similar for >67% of the structures. However, for 23% of the structures, the calculated patches of low desolvation penalty differed significantly for bound and unbound structures (<30% overlap), and to avoid any bias due to conformation dependence of the desolvation penalties, all predictions were performed using unbound partner structures.
The approach was first tested on the initial test set of 156 protein structures including enzymes (E), inhibitors (I), antibodies (Ab), antigens (Ag), and other (O) classes of complexes (see Materials and Methods). To correlate regions of low electrostatic desolvation with known protein binding sites, up to six probe center positions for each protein with lowest desolvation penalty were considered. Except for 12 out of 156 proteins (∼93% (Table S2)), at least one of the six lowest-energy patches overlapped with the known binding site (Tables 1 and 2). The lowest desolvation energy patch that overlapped with the binding site was defined as a first hit, whereas the patch with the highest overlap (highest correctness) with a known binding region was termed a best hit. In ∼55% of the cases, three or more predicted low desolvation penalty patches overlapped with the known protein binding site. For ∼45% of the proteins, the best scoring-predicted region overlapped with the known protein binding site; this value increased to 65% if one considered best and second-best hits, and to 75% if the three best hits were considered (Fig. S2).
Table 1.
Electrostatic desolvation analysis for the unbound proteins of class E, I
| PDB∗ | Hits† | 1st hit‡ | Correctness§ | By chance¶ | Best hit‖ | Correctness∗∗ | By chance†† |
|---|---|---|---|---|---|---|---|
| 1ACB_L | 4 | 1 | 18.8 (3/16) | 35.0 | 5 | 81.8 (9/11) | 88.4 |
| 1ACB_R | 2 | 4 | 100.0 (8/8) | 45.5 | 4 | 100.0 (8/8) | 45.5 |
| 1AVX_L | 1 | 5 | 66.7 (14/21) | 58.6 | 5 | 66.7 (14/21) | 58.6 |
| 1AVX_R | 2 | 3 | 45.8 (11/24) | 40.6 | 3 | 45.8 (11/24) | 40.6 |
| 1AY7_L | 5 | 2 | 47.4 (9/19) | 45.1 | 3 | 71.4 (10/14) | 59.3 |
| 1AY7_R | 5 | 1 | 33.3 (5/15) | 22.8 | 4 | 38.5 (5/13) | 64.4 |
| 1BVN_L | 6 | 1 | 75.0 (9/12) | 44.3 | 5 | 81.2 (13/16) | 94.6 |
| 1CGI_L | 6 | 1 | 100.0 (9/9) | 43.7 | 1 | 100.0 (9/9) | 43.7 |
| 1CGI_R | 3 | 1 | 6.7 (1/15) | 17.2 | 4 | 71.4 (10/14) | 53.0 |
| 1D6R_L | 2 | 1 | 5.3 (1/19) | 31.2 | 6 | 85.7 (6/7) | 89.4 |
| 1D6R_R | 3 | 1 | 33.3 (4/12) | 15.2 | 1 | 33.3 (4/12) | 15.2 |
| 1EAW_L | 6 | 1 | 26.5 (9/34) | 43.4 | 5 | 100.0 (15/15) | 94.2 |
| 1EAW_R | 4 | 2 | 30.0 (3/10) | 29.3 | 6 | 50.0 (11/22) | 64.6 |
| 1EZU_L | 3 | 2 | 100.0 (11/11) | 24.8 | 2 | 100.0 (11/11) | 24.8 |
| 1EZU_R | 4 | 2 | 57.1 (8/14) | 42.1 | 2 | 57.1 (8/14) | 42.1 |
| 1F34_L | 5 | 1 | 45.5 (15/33) | 27.5 | 4 | 84.0 (21/25) | 72.3 |
| 1F34_R | 5 | 1 | 74.2 (23/31) | 18.5 | 2 | 93.8 (15/16) | 33.5 |
| 1HIA_L | 6 | 1 | 46.7 (7/15) | 44.1 | 2 | 55.6 (10/18) | 68.7 |
| 1HIA_R | 6 | 1 | 13.3 (2/15) | 15.9 | 2 | 72.4 (21/29) | 29.2 |
| 1IJK_L | 3 | 2 | 12.5 (1/8) | 30.4 | 2 | 20.0 (6/30) | 30.4 |
| 1IJK_R | 2 | 5 | 62.5 (10/16) | 48.3 | 6 | 62.5 (10/16) | 54.7 |
| 1MAH_L | 6 | 1 | 85.7 (6/7) | 44.9 | 1 | 85.7 (6/7) | 44.9 |
| 1MAH_R | 1 | 4 | 9.4 (5/53) | 31.9 | 4 | 9.4 (5/53) | 31.9 |
| 1ML0_L | 3 | 3 | 81.8 (9/11) | 77.6 | 3 | 81.8 (9/11) | 77.6 |
| 1ML0_R | 1 | 2 | 50.0 (17/34) | 11.1 | 2 | 50.0 (17/34) | 11.1 |
| 1N8O_L | 4 | 1 | 100.0 (8/8) | 19.9 | 1 | 100.0 (8/8) | 19.9 |
| 1N8O_R | 4 | 2 | 11.1 (3/27) | 31.1 | 6 | 100.0 (6/6) | 67.3 |
| 1NW9_L | 3 | 2 | 36.4 (4/11) | 57.1 | 6 | 76.0 (19/25) | 92.1 |
| 1NW9_R | 5 | 1 | 75.0 (3/4) | 16.1 | 1 | 75.0 (3/4) | 16.1 |
| 1OPH_L | 3 | 1 | 28.6 (4/14) | 14.6 | 1 | 28.6 (4/14) | 14.6 |
| 1OPH_R | 5 | 1 | 100.0 (5/5) | 7.9 | 1 | 100.0 (5/5) | 7.9 |
| 1PPE_L | 6 | 1 | 81.2 (13/16) | 62.9 | 3 | 100.0 (6/6) | 94.9 |
| 1PPE_R | 4 | 1 | 6.9 (4/58) | 17.3 | 2 | 41.7 (5/12) | 31.5 |
| 1PXV_L | 6 | 1 | 100.0 (7/7) | 28.5 | 1 | 100.0 (7/7) | 28.5 |
| 1PXV_R | 6 | 1 | 100.0 (4/4) | 19.4 | 1 | 100.0 (4/4) | 19.4 |
| 1R0R_L | 5 | 1 | 100.0 (6/6) | 39.3 | 1 | 100.0 (6/6) | 39.3 |
| 1R0R_R | 4 | 2 | 17.4 (4/23) | 26.2 | 5 | 57.1 (12/21) | 53.2 |
| 1UDI_L | 6 | 1 | 66.7 (30/45) | 35.3 | 3 | 72.2 (13/18) | 72.9 |
| 1UDI_R | 5 | 2 | 14.3 (2/14) | 31.2 | 5 | 87.5 (7/8) | 60.8 |
| 2B42_L | 3 | 1 | 58.3 (7/12) | 27.2 | 1 | 100.0 (8/8) | 27.2 |
| 2B42_R | 3 | 2 | 90.9 (10/11) | 25.2 | 6 | 90.9 (10/11) | 58.2 |
| 2MTA_L | 4 | 1 | 72.7 (8/11) | 26.1 | 1 | 72.7 (8/11) | 26.1 |
| 2MTA_R | 3 | 1 | 60.0 (21/35) | 7.1 | 2 | 82.4 (14/17) | 13.7 |
| 2O8V_L | 5 | 1 | 50.0 (8/16) | 27.5 | 1 | 50.0 (8/16) | 27.5 |
| 2O8V_R | 1 | 4 | 9.1 (1/11) | 39.4 | 4 | 9.1 (1/11) | 39.4 |
| 2SIC_L | 2 | 2 | 30.8 (4/13) | 44.7 | 3 | 91.7 (11/12) | 58.9 |
| 2SIC_R | 1 | 4 | 25.0 (3/12) | 49.0 | 4 | 25.0 (3/12) | 49.0 |
| 2UUY_L | 2 | 3 | 50.0 (8/16) | 69.6 | 6 | 64.3 (9/14) | 90.8 |
| 2UUY_R | 4 | 1 | 42.1 (8/19) | 14.1 | 5 | 72.7 (24/33) | 53.3 |
| 7CEI_L | 4 | 1 | 45.5 (5/11) | 17.4 | 3 | 52.4 (11/21) | 43.6 |
| 7CEI_R | 1 | 6 | 15.4 (2/13) | 82.6 | 6 | 15.4 (2/13) | 82.6 |
PDB name of the corresponding complex. In the case of the receptor and ligand, the additional letters _R and _L, respectively, are added at the end of the PDB entry.
Total number of hits among the six binding site predictions.
Rank of the first hit.
Correctness of the first hit, expressed as a percentage with the ratio of the number of correctly predicted residues to the total number of predicted residues in parentheses.
Percentage chance of hitting the binding site, calculating the extended interface (increasing the radius of the real interface by 10 Å) over the total solvent-accessible surface area of the protein for the first prediction.
Rank of the best hit.
Correctness of the best hit, expressed as for correctness of first hit.
Percentage chance of hitting the binding site, calculating the extended interface (increasing the radius of the real interface by 10 Å) over the total solvent-accessible surface area of the protein for the best prediction.
Table 2.
Electrostatic desolvation analysis of antigen proteins
| PDB | Hits | 1st hit | Correctness | By chance | Best hit | Correctness | By chance |
|---|---|---|---|---|---|---|---|
| 1AHW_L | 2 | 2 | 80.0 (8/10) | 28.8 | 2 | 80.0 (8/10) | 28.8 |
| 1BGX_L | 1 | 5 | 60.0 (9/15) | 43.5 | 5 | 60.0 (9/15) | 43.5 |
| 1BJ1_L | 3 | 2 | 80.0 (20/25) | 27.4 | 4 | 85.7 (6/7) | 47.3 |
| 1BVK_L | 1 | 6 | 4.0 (1/25) | 73.4 | 6 | 4.0 (1/25) | 73.4 |
| 1DQJ_L | 5 | 1 | 12.5 (1/8) | 24.8 | 4 | 40.9 (9/22) | 68.1 |
| 1E6J_L | 4 | 1 | 60.0 (9/15) | 9.4 | 6 | 61.9 (13/21) | 44.7 |
| 1FSK_L | 2 | 5 | 47.6 (10/21) | 63.5 | 5 | 47.6 (10/21) | 63.5 |
| 1I9R_L | 2 | 3 | 87.5 (7/8) | 21.5 | 4 | 87.5 (7/8) | 27.6 |
| 1IQD_L | 2 | 1 | 100.0 (5/5) | 22.5 | 1 | 100.0 (5/5) | 22.5 |
| 1JPS_L | 2 | 3 | 61.5 (8/13) | 38.5 | 3 | 61.5 (8/13) | 38.5 |
| 1K4C_L | 2 | 1 | 5.9 (1/17) | 22.3 | 5 | 23.8 (5/21) | 71.6 |
| 1KXQ_L | 3 | 3 | 92.3 (12/13) | 67.0 | 3 | 92.3 (12/13) | 67.0 |
| 1MLC_L | 5 | 1 | 100.0 (7/7) | 21.3 | 1 | 100.0 (7/7) | 21.3 |
| 1NCA_L | 2 | 3 | 8.0 (2/25) | 31.2 | 5 | 66.7 (12/18) | 46.4 |
| 1VFB_L | 1 | 6 | 12.5 (2/16) | 75.5 | 6 | 12.5 (2/16) | 75.5 |
| 2FD6_L | 1 | 2 | 93.3 (14/15) | 17.3 | 2 | 93.3 (14/15) | 17.3 |
| 2HMI_L | 1 | 5 | 100.0 (10/10) | 29.6 | 5 | 100.0(10/10) | 29.6 |
| 2I25_L | 5 | 1 | 5.9 (1/17) | 21.1 | 3 | 50.0 (4/8) | 50.9 |
| 2JEL_L | 3 | 3 | 14.3 (2/14) | 64.1 | 3 | 14.3 (2/14) | 64.1 |
| 1A2Y_L∗ | 1 | 6 | 73.3 (11/15) | 73.3 | 6 | 73.3 (11/15) | 73.3 |
| 1BQL_L† | 4 | 1 | 63.2 (12/19) | 24.1 | 1 | 63.2 (12/19) | 24.1 |
| 1DQJ_L‡ | 5 | 1 | 42.1 (8/19) | 24.8 | 6 | 48.1 (13/27) | 81.9 |
| 1FBI_L‡ | 4 | 2 | 31.6 (6/19) | 41.4 | 6 | 52.6 (10/19) | 79.9 |
| 1FDL_L∗ | 1 | 4 | 76.9 (10/13) | 57.7 | 4 | 76.9 (10/13) | 57.7 |
| 1G7J_L∗ | 1 | 4 | 71.4 (10/14) | 58.5 | 4 | 71.4 (10/14) | 58.5 |
| 1JHL_L∗ | 2 | 3 | 55.6 (10/18) | 48.1 | 3 | 55.6 (10/18) | 48.1 |
| 1KIQ_L∗ | 1 | 3 | 85.7 (12/14) | 49.0 | 3 | 85.7 (12/14) | 49.0 |
| 1MLC_L† | 5 | 1 | 56.2 (9/16) | 21.3 | 2 | 100 (7/7) | 38.1 |
| 2IFF_L† | 4 | 1 | 53.3 (8/15) | 24.6 | 5 | 100 (6/6) | 75.6 |
For an explanation of the column headings, see footnotes to Table 1.
Footnote symbols indicate lysozyme complexes used in their bound form to analyze epitope predictions in case of multiple antigenic binding sites. Antibodies can bind sites labeled A†, B‡ or C∗. (See text for details.)
The performance of the prediction was further analyzed by calculating the probability of achieving a given prediction by chance. A predicted patch with low average desolvation penalty was considered to be a hit if it overlapped with the interface region by at least one residue. This corresponds to an effective surface area of the known interface plus a 10-Å rim around the interface region. The probability of randomly hitting this region relative to the total surface region (Phit) corresponds to the ratio of this effective surface area to the total protein surface area. Such hit-by-chance probability is a lower limit for the significance of a predicted region. Moreover, the probability of obtaining k hit(s) over n trials, P(k), follows a binomial distribution:
where is the binomial coefficient and the probability of obtaining at least k hits is then the sum of finding 1, 2, … and k hits over n trials. If one looks at the rank of the first hit, one can calculate for each case the probability of finding this first hit by chance. The probability of finding at least one hit up to rank n is reported in columns 5 and 8 of Tables 1 and 2 and Table S3 for the first and best predicted regions, respectively. One can argue that if the probability of finding a hit with a given rank by chance is >50%, a prediction makes little sense. If one considers to be failures the cases where no patch overlapping with the binding interface was found among the six patches of lowest desolvation penalty and those for which the probability of identifying the first hit is >0.5, then the success rate is 80% (31 failures out of 156). This means that for a fraction of cases, one of the lowest-ranked predictions was a hit and/or the binding interface area was large relative to the total surface area such that the binding site could be easily hit by chance. Nevertheless, the success rate is high enough to consider that the calculated electrostatic desolvation properties represent a significant criterion for identification of possible protein-protein binding interfaces. Moreover, in the great majority of cases, a considerable overlap of the first hit with the known interface was found (Tables 1 and 2 and Table S3, column 4). The probability of achieving this by chance is lower than for patches that just touch the binding interface (which was taken as a criterion for estimating the probability of hitting a predicted region by chance). Taking this into account would further increase the effective success rate.
The performance of the methodology was also analyzed considering false positive and false negative predictions in terms of an ROC graph (Fig. S3). For this purpose, the overlap of predicted binding sites with the known interface was considered (without averaging over a patch region). The sensitivity of the approach reached overall a value of 0.57 (ratio of correctly predicted region to the sum of correctly and incorrectly predicted surface). The selectivity reached overall 0.58, and the area under the ROC curve (AUC) was 0.59 (0.63 for enzymes and inhibitors, 0.58 for other protein-protein complexes). The relatively low AUC was mostly due to 12 proteins (see Supporting Material) that showed an anticorrelation between surface area of low desolvation and binding interface (AUC < 0.45).
Overlap of known protein binding sites with regions of large electrostatic desolvation penalty
It is expected that proteins may avoid surface regions of protein partners that require large free energies to strip off water molecules (unless some other very favorable interaction outbalances the desolvation penalty). Hence, it is of relevance to ask whether surface regions with a large associated desolvation penalty for adding a neutral probe are excluded from known protein interface regions. This is indeed the case for most binding sites. Only a small fraction (<10%) of known binding sites show a significant overlap with patches that have an associated average desolvation penalty of >7 kJ·mol−1. This fraction drops to <5% if one looks at average desolvation penalties for patches of >10 kJ·mol−1. This result indicates that the approach may also be useful for excluding certain protein surface regions as putative interaction sites.
The prediction (using the low desolvation penalty as a criterion) failed for 12 proteins among 156. The analysis of the amino acid composition at the interface of these cases (1BVN_R, 2HLE_R, 1N2C_R, 1SBB_R, 1DE4_L, 1EER_L, 1AKJ_R, 1KAC_R) gives some possible explanation (Table S2). All of the 12 proteins contain a large number of charged and polar residues at the protein-protein interface, resulting in an anticorrelated ROC curve (AUC < 0.45) for this subset (not shown) It could be speculated that these cases correspond to transient and not obligatory complexes that may involve a strong electrostatic component of binding.
Comparison of amino acid desolvation properties at the protein surface and at binding interfaces
To get an impression of the solvation properties of certain residue types at the surface of proteins, we assigned the calculated probe desolvation penalty to the nearest residue (at the protein surface). If several probes were assigned, the average was used. No desolvation value was assigned to buried residues.
The mean values per residue type were computed (for the whole set of protein structures) and separate averages were calculated for residues located at known interface regions and at the rest of the protein surface (Fig. 3). As expected, residues having the highest mean desolvation energy are the four charged amino acids: glutamate, lysine, aspartate, and arginine. For the remaining residues, the arrangement follows more or less the size and hydrophobic classification of amino acids: aromatic > sulfur-containing > and aliphatic side chains. An unexpected finding was that some polar residues, like glutamine and asparagine, are close to the aliphatic groups in terms of average probe desolvation penalty. The apparent contradiction with the hydrophobicity of amino acids can be partially explained if we consider the total surface area of a given residue, i.e., the desolvation free energy considering all probes/residue and not the average. If so, the ranking will be Lys, Glu, Arg, Asp > Gln, Asn > His, Pro, Tyr, Met, Thr, Trp, Ser > Leu, Phe, Val, Ala, Ile, Gly, Cys, which is in agreement with the expected ranking, considering hydrophobicity of the side chains.
Figure 3.

Mean electrostatic desolvation energy (in kJ·mol−1 per residue and per probe) and standard deviation (error bars) for amino acids accessible to solvent (blue/dark gray) and those located at the protein-protein interface (red/light gray). Each probe is associated with the closest residue, and the energy value of a given amino acid is the average considering the total number of probes/residue. The energy/residue gives the average cost of desolvating a neutral probe in contact with the type of amino acid.
It needs to be emphasized that with this approach, the calculated electrostatic desolvation penalty of each residue type strongly depends on the average environment of the residue at the surface. This includes the type of neighboring residues but also that of distant residues if they are charged, and the average protein shape around the considered surface residue. Simpler approaches to calculate solvation properties, such as purely surface-area-based methods, do not include such effects. The influence of the environment on the desolvation properties of each residue type is also visible if one compares residues at the interface with residues at the rest of the protein surface. In general, the average desolvation penalty for basically all residues tends to be smaller at regions that belong to binding interfaces compared to the rest of the protein surface (Fig. 3). Most studies on known protein binding regions indicate that there is a larger fraction of nonpolar residues in these regions relative to the rest of the protein surface (2–5,7,9). Hence, it is easier to desolvate a probe in such regions even if one of the near residues is polar or charged compared to desolvation in a surface region where a greater fraction of residues is polar or charged. However, even if one switches off all side-chain charges, the probe desolvation penalty tends to be on average smaller at known binding regions compared to the rest of the surface, indicating that the average shape of binding regions may also play a role (Fig. S4). In the case where side-chain charges are included, the effect is nonuniform and especially strong for hydrophobic and particular aromatic residues (including His and Trp). This indicates, for example, that for an aromatic residue to be a hotspot for protein binding depends on the environment. It is of interest that removal of side-chain charges resulted in still very significant desolvation penalties, indicating that desolvation of the protein backbone (even if partially solvent-inaccessible below side chains) makes a major contribution to protein binding. However, the interpretation needs to taken with care, because the removal of side-chain charges can significantly alter the electrostatic field around the protein and can have a nonlocal effect on the probe desolvation penalty. For charged residues, the reduction in desolvation penalty was on average ∼2 kJ·mol−1 upon removal of side-chain charges, and for most other residues, it was <1 kJ·mol−1. As expected, the per-residue probe desolvation penalty for each residue is more uniform compared to the charged side chain case (Fig. S4).
Prediction of antigenic epitopes
The application to identify preferred antibody binding regions (antigenic epitopes) was also considered. The performance to predict binding sites on antibody molecules was approximately similar to the other protein classes (Table S4). However, the prediction of possible antigenic epitope regions on the surface of a protein is of significant importance, particularly in the area of vaccine design. Most previous approaches used to predict protein binding sites are based on evolutionary conservation or on other physical protein surface properties (like shape, hydrophobicity, or charge distribution) and often fail to identify putative antibody binding sites on protein antigens (1,41).
It is easier for the immune system to design an antibody to an antigenic epitope that includes the properties required for high-affinity binding (e.g., low desolvation penalty) compared to other regions. Hence, for several generated antibodies, most may prefer binding sites with low associated desolvation penalty. This hypothesis was tested on lysozyme, for which the structure of several complexes with antibodies binding to different antigenic epitopes are known (Table 2), and on a number of other antigens for which structures of complexes with antibody molecules have been determined (Table 2).
For most antibody-antigen complexes, some of the predicted antigenic regions of low desolvation penalty overlapped with the known binding regions. The calculations were performed on the unbound antigen structures, except for cases where only the structure in complex with an antibody was available (marked in Table 2). To avoid any bias due to sequence redundancy, similar lysozyme proteins were removed from the following statistics. In ∼80% of the cases, the prediction result was better than a random prediction; in ∼74% of cases, the experimentally determined binding site overlapped with one of the three top-ranked desolvation sites; in ∼50% of the cases, it overlapped with the two top-ranked predictions; and in 32%, it overlapped with the best-ranked site.
It should be emphasized that a protein surface contains usually several possible antigen epitope regions. It is expected that an observed antibody binding site does not necessarily correspond to the region of lowest desolvation penalty but may overlap with one of several possible sites with small associated desolvation penalty. To illustrate the existence of multiple binding regions on the same protein, lysozymes cocrystallized with different antibodies were used.
Binding-site predictions based on probe desolvation calculations on unbound and bound lysozyme structures (Fig. 4 upper, green beads) are clustered in similar regions overlapping with three major epitope regions found in eight crystal structures in complex with different antibodies. Overall, similar surface desolvation profiles were obtained for the unbound and bound lysozyme structures (Fig. 4 lower). Region A is indicated as a putative protein binding region, and to a lesser degree, there is also overlap of predicted sites with epitope regions B and C (Fig. 4 lower). For complexes with antibodies binding to region A, the best-ranked hit and several lower-ranked sites show good overlap with binding site A (Table 2). For the other two antibody binding sites, no overlap was observed with the region of lowest desolvation penalty, but there was at least some overlap with one of the other low desolvation regions (Table 2; Fig. 4 lower).
Figure 4.
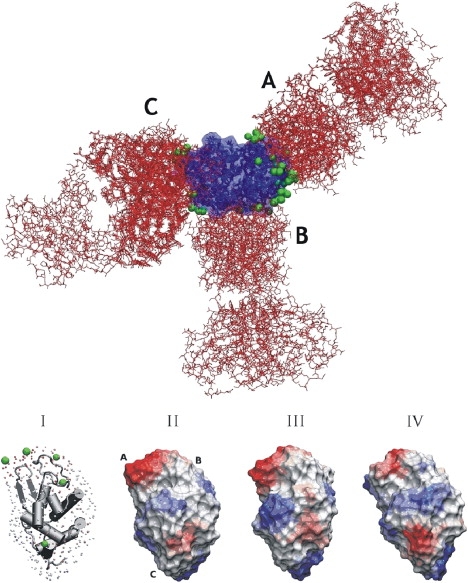
(Upper) Superposition of lysozyme/antibody complexes highlights the three different epitopes (includes pdb entries 1MLC, 1DQJ, 1FBI, 1BQL, 2IFF, 1JHL, 1KIQ, 1G7J, 1A2Y, and 1FDL), showing the lysozyme proteins and their solvent-accessible surface (blue/dark gray), the antibody Fab fragments (red/light gray), and the predicted sites of low electrostatic desolvation penalty (green/gray). The three different epitope regions are labeled A–C as explained in the text. (Lower) Prediction of centers of low probe desolvation (I, green/gray spheres) at the surface of the lysozyme, based on surface desolvation profiles obtained for the unbound lysozyme structure (pdb3LZH) shown in II. For comparison, the surface profiles calculated for two lysozyme structures in the bound form are shown (III, taken from pdb1MLC in complex with antibody D44.1, and IV, taken from pdb1DQJ in complex with antibody Hyhel-63). The surface is colored (gray-scale) according to the electrostatic desolvation energy, using VMD viewer software (54) (blue/dark gray, high probe desolvation penalties; red/light gray, low probe desolvation penalties). The view is approximately the same for each structure).
Discussion
Binding of a protein requires the removal of water molecules from the protein-protein interface. Favorable protein-protein interactions compete with protein-solvent interactions to form a stable complex. It is expected that regions with a lower penalty of desolvation are overall more favorable protein-protein interaction sites compared to protein surface regions that require large desolvation penalties. A new approach for calculating the electrostatic penalty of replacing a solvent-occupied area (high dielectric area) at the protein surface with a low dielectric neutral probe has been used to identify putative protein binding sites.
Desolvation energy as a criterion in the detection of putative protein-protein interaction sites has already been used employing rapid solvation energy calculations based on accessible surface area (28,32). Using the ODA approach, Fernandez-Recio et al. (32) were able to correctly locate (by overlap with a known binding site) protein binding sites for ∼80% of the cases, although no ODA hotspots were obtained for ∼40% of the protein test cases (overall success rate, ∼50%). In surface-area-based desolvation calculations, the desolvation penalty is calculated from the surface area assumed to become buried upon complex formation multiplied by a residue- or atom-based surface tension parameter. The method takes into account only the local character of the surface area element, and not the environment of the surface element or any longer-range influences on the solvation of the surface elements.
This method uses a different physical effect, namely, the local perturbation of the electrostatic field due to a neutral probe, to detect regions with low electrostatic desolvation penalty using the finite-difference Poisson-Boltzmann approach. The calculated desolvation penalty depends not only on the atom it contacts but on the environment of the considered region (i.e., the physicochemical properties of the surrounded residues and the geometry of the surface or dielectric boundary). Hence, the desolvation per surface area is not constant for a given atom or residue type (as in surface-area-based methods) but also includes possible long-range effects due to charges that may create a strong electrostatic field at the site of desolvation.
Recently, Brock et al. (42) studied electrostatic interactions in a large set of protein complexes (>600) and found that the total electrostatic reaction field contribution is overall not optimized with respect to the distribution of the surface amino acids. However, this result does not necessarily contradict our finding that binding regions frequently overlap with regions of low electrostatic desolvation penalty. According to work by Janin and co-workers (7), protein binding sites often consist of a nonpolar core and more polar or charged rim regions. Even partial burying of such polar regions (upon complex formation) can result in an overall unfavorable electrostatic desolvation for the complete binding site. However, this does not exclude the possibility that the binding site may still contain patches with low desolvation penalty (in this example, the central region). The large set of nonredundant proteins used, and the success rate for recovering the real interface (∼75% if the three top-ranked patches are considered), demonstrate that the approach presented here could be helpful to detect putative protein binding regions. In addition, it was found that antibody binding sites on several proteins also frequently overlap with predicted regions of low electrostatic desolvation penalty. The computational antigen epitope mapping could be considered as a fast and low-cost complement to experimental antigen epitope mapping.
It is of interest that the calculated average desolvation penalty for probes contacting specifc residue types showed a strong dependence on the environment. In particular, the calculated desolvation penalty of probes contacting aromatic residues, but also Met and two polar residues (Asn and Gln), was significantly smaller if the residue was part of a protein-protein interface compared to other surface areas. This result emphasizes the importance of the environment of a particular surface residue in determining whether it is part of a putative protein interaction site. It is well known that protein-protein association can result in changes of protonation states of interface residues (43,44). Since FDPB calculations can be used to estimate pK shifts of ionizable residues, it might be possible to consider changes in protonation states during probe desolvation calculations.
Electrostatic desolvation profiles corroborate a recent work of Mihalek et al. (45). These authors examined surface water residence times obtained from molecular dynamics simulations to detect putative binding sites and define wet and dry interfaces. Although water molecules are completely excluded from the core of dry interfaces, the microsolvation at its periphery plays an important role. Solvent molecules generally form a ring of solvent around the interface atoms with a quite long residence time by interacting with more polar side chains. For the opposite kind of interfaces (wet), the interacting surface is scattered throughout with water molecules and appears mainly at crystal-packing interfaces. In most cases, dry interfaces are found for specific binding sites relevant for biological processes.
It has been shown that adjustments of side-chain positioning during protein-protein association require the formation of an intermediate complex, the so-called encounter complex (46). Several forces drive the recognition process but do not act simultaneously in the same order of magnitude (47). For instance, long-range electrostatic forces generally guide the diffusion of individual partners before the formation of the bound conformation (46,48–52). Although this is the case particularly when the receptor and the ligand are oppositely charged, Camacho et al. (53) have shown that the final conformation is within regions of low desolvation penalty in complexes with weak electrostatic interactions. Although electrostatic desolvation is a short-range effect compared to Coulomb interactions, it may influence association even before direct contact is formed between proteins (one or two hydration layers between protein partners) and may help to guide proteins in the final state of the association process.
The calculated low-electrostatic desolvation profiles presented here showed significant overlap with known protein binding regions in a large set of various protein structures. The desolvation profile alone allows the effective identification of possible protein binding sites and putative antibody binding sites for a significant fraction of proteins. This approach can be combined with other protein surface features that have been used to predict putative protein binding sites (e.g., hydrophobicity, surface residue conservation, and shape). It is expected that a combination with other protein surface features will further improve the accuracy of predicting binding regions and will be the subject of future work.
Supporting Material
Four tables and six figures are available at http://www.biophysj.org/biophysj/supplemental/S0006-3495(10)00140-2.
Supporting Material
Acknowledgments
This work was performed using the computational resources of the CLAMV (Computer Laboratories for Animation, Modeling and Visualization) at Jacobs University Bremen and supercomputer resources of the EMSL (Environmental Molecular Science Laboratories) at the PNNL (Pacific Northwest National Laboratories) and was supported by a grant (FP6 STREP “BacAbs”, grant number LSHB-CT-2006-037325) from the European community. We thank the CINES (Centre Informatique National de l'Enseignement Supérieur) for provision of computer time for the project “c2009076140”.
Footnotes
Martin Zacharias's present address is Physik-Department T38, Technische Universität München, James Frank Strasse 1,85748 Garching, Germany.
Sébastien Fiorucci's present address is Laboratoire de Chimie des Molecules Bioactives et des Arômes, UMR CNRS-UNS 6001, University of Nice Sophia Antipolis, Faculté des Sciences, 06108 Nice cedex 2, France.
Contributor Information
Sébastien Fiorucci, Email: Sebastien.Fiorucci@unice.fr.
Martin Zacharias, Email: m.zacharias@jacobs-university.de.
References
- 1.Jones S., Thornton J.M. Principles of protein-protein interactions. Proc. Natl. Acad. Sci. USA. 1996;93:13–20. doi: 10.1073/pnas.93.1.13. [DOI] [PMC free article] [PubMed] [Google Scholar]
- 2.Janin J., Rodier F., Bahadur R.P. Macromolecular recognition in the Protein Data Bank. Acta Crystallogr. D Biol. Crystallogr. 2007;63:1–8. doi: 10.1107/S090744490603575X. [DOI] [PMC free article] [PubMed] [Google Scholar]
- 3.Bahadur R.P., Zacharias M. The interface of protein-protein complexes: analysis of contacts and prediction of interactions. Cell. Mol. Life Sci. 2008;65:1059–1072. doi: 10.1007/s00018-007-7451-x. [DOI] [PMC free article] [PubMed] [Google Scholar]
- 4.Bahadur R.P., Chakrabarti P., Janin J. Dissecting subunit interfaces in homodimeric proteins. Proteins. 2003;53:708–719. doi: 10.1002/prot.10461. [DOI] [PubMed] [Google Scholar]
- 5.Jones S., Thornton J.M. Prediction of protein-protein interaction sites using patch analysis. J. Mol. Biol. 1997;272:133–143. doi: 10.1006/jmbi.1997.1233. [DOI] [PubMed] [Google Scholar]
- 6.Bogan A.A., Thorn K.S. Anatomy of hot spots in protein interfaces. J. Mol. Biol. 1998;280:1–9. doi: 10.1006/jmbi.1998.1843. [DOI] [PubMed] [Google Scholar]
- 7.Chakrabarti P., Janin J. Dissecting protein-protein recognition sites. Proteins. 2002;47:334–343. doi: 10.1002/prot.10085. [DOI] [PubMed] [Google Scholar]
- 8.Keskin O., Ma B.Y., Nussinov R. Hot regions in protein—protein interactions: the organization and contribution of structurally conserved hot spot residues. J. Mol. Biol. 2005;345:1281–1294. doi: 10.1016/j.jmb.2004.10.077. [DOI] [PubMed] [Google Scholar]
- 9.Lo Conte L., Chothia C., Janin J. The atomic structure of protein-protein recognition sites. J. Mol. Biol. 1999;285:2177–2198. doi: 10.1006/jmbi.1998.2439. [DOI] [PubMed] [Google Scholar]
- 10.Reichmann D., Rahat O., Schreiber G. The molecular architecture of protein-protein binding sites. Curr. Opin. Struct. Biol. 2007;17:67–76. doi: 10.1016/j.sbi.2007.01.004. [DOI] [PubMed] [Google Scholar]
- 11.Tsai C.J., Lin S.L., Nussinov R. Studies of protein-protein interfaces: a statistical analysis of the hydrophobic effect. Protein Sci. 1997;6:53–64. doi: 10.1002/pro.5560060106. [DOI] [PMC free article] [PubMed] [Google Scholar]
- 12.Xu D., Tsai C.J., Nussinov R. Hydrogen bonds and salt bridges across protein-protein interfaces. Protein Eng. 1997;10:999–1012. doi: 10.1093/protein/10.9.999. [DOI] [PubMed] [Google Scholar]
- 13.Rodier F., Bahadur R.P., Janin J. Hydration of protein-protein interfaces. Proteins. 2005;60:36–45. doi: 10.1002/prot.20478. [DOI] [PubMed] [Google Scholar]
- 14.Xu D., Lin S.L., Nussinov R. Protein binding versus protein folding: the role of hydrophilic bridges in protein associations. J. Mol. Biol. 1997;265:68–84. doi: 10.1006/jmbi.1996.0712. [DOI] [PubMed] [Google Scholar]
- 15.Sheinerman F.B., Norel R., Honig B. Electrostatic aspects of protein-protein interactions. Curr. Opin. Struct. Biol. 2000;10:153–159. doi: 10.1016/s0959-440x(00)00065-8. [DOI] [PubMed] [Google Scholar]
- 16.McCoy A.J., Chandana Epa V., Colman P.M. Electrostatic complementarity at protein/protein interfaces. J. Mol. Biol. 1997;268:570–584. doi: 10.1006/jmbi.1997.0987. [DOI] [PubMed] [Google Scholar]
- 17.Negi S.S., Schein C.H., Braun W. InterProSurf: a web server for predicting interacting sites on protein surfaces. Bioinformatics. 2007;23:3397–3399. doi: 10.1093/bioinformatics/btm474. [DOI] [PMC free article] [PubMed] [Google Scholar]
- 18.Mattos C., Ringe D. Proteins in organic solvents. Curr. Opin. Struct. Biol. 2001;11:761–764. doi: 10.1016/s0959-440x(01)00278-0. [DOI] [PubMed] [Google Scholar]
- 19.Murakami Y., Jones S. SHARP2: protein-protein interaction predictions using patch analysis. Bioinformatics. 2006;22:1794–1795. doi: 10.1093/bioinformatics/btl171. [DOI] [PubMed] [Google Scholar]
- 20.Tjong H., Qin S., Zhou H.X. PI2PE: protein interface/interior prediction engine. Nucleic Acids Res. 2007;35(Web Server issue):W357–W362. doi: 10.1093/nar/gkm231. [DOI] [PMC free article] [PubMed] [Google Scholar]
- 21.Looger L.L., Dwyer M.A., Hellinga H.W. Computational design of receptor and sensor proteins with novel functions. Nature. 2003;423:185–190. doi: 10.1038/nature01556. [DOI] [PubMed] [Google Scholar]
- 22.Havranek J.J., Harbury P.B. Automated design of specificity in molecular recognition. Nat. Struct. Biol. 2003;10:45–52. doi: 10.1038/nsb877. [DOI] [PubMed] [Google Scholar]
- 23.Haste Andersen P., Nielsen M., Lund O. Prediction of residues in discontinuous B-cell epitopes using protein 3D structures. Protein Sci. 2006;15:2558–2567. doi: 10.1110/ps.062405906. [DOI] [PMC free article] [PubMed] [Google Scholar]
- 24.Greenbaum J.A., Andersen P.H., Peters B. Towards a consensus on datasets and evaluation metrics for developing B-cell epitope prediction tools. J. Mol. Recognit. 2007;20:75–82. doi: 10.1002/jmr.815. [DOI] [PubMed] [Google Scholar]
- 25.Odorico M., Pellequer J.L. BEPITOPE: predicting the location of continuous epitopes and patterns in proteins. J. Mol. Recognit. 2003;16:20–22. doi: 10.1002/jmr.602. [DOI] [PubMed] [Google Scholar]
- 26.Parker J.M.R., Guo D., Hodges R.S. New hydrophilicity scale derived from high-performance liquid chromatography peptide retention data: correlation of predicted surface residues with antigenicity and x-ray-derived accessible sites. Biochemistry. 1986;25:5425–5432. doi: 10.1021/bi00367a013. [DOI] [PubMed] [Google Scholar]
- 27.Lichtarge O., Bourne H.R., Cohen F.E. An evolutionary trace method defines binding surfaces common to protein families. J. Mol. Biol. 1996;257:342–358. doi: 10.1006/jmbi.1996.0167. [DOI] [PubMed] [Google Scholar]
- 28.Burgoyne N.J., Jackson R.M. Predicting protein interaction sites: binding hot-spots in protein-protein and protein-ligand interfaces. Bioinformatics. 2006;22:1335–1342. doi: 10.1093/bioinformatics/btl079. [DOI] [PubMed] [Google Scholar]
- 29.Eisenberg D., McLachlan A.D. Solvation energy in protein folding and binding. Nature. 1986;319:199–203. doi: 10.1038/319199a0. [DOI] [PubMed] [Google Scholar]
- 30.Wesson L., Eisenberg D. Atomic solvation parameters applied to molecular dynamics of proteins in solution. Protein Sci. 1992;1:227–235. doi: 10.1002/pro.5560010204. [DOI] [PMC free article] [PubMed] [Google Scholar]
- 31.Fauchere J.L., Pliska V. Hydrophobic parameters pi of amino acid side chains from partitioning of N-acetyl-amino-acid amides. Eur. J. Med. Chem. 1983;18:369–375. [Google Scholar]
- 32.Fernandez-Recio J., Totrov M., Abagyan R. Optimal docking area: a new method for predicting protein-protein interaction sites. Proteins. 2005;58:134–143. doi: 10.1002/prot.20285. [DOI] [PubMed] [Google Scholar]
- 33.Baker N.A., Sept D., McCammon J.A. Electrostatics of nanosystems: application to microtubules and the ribosome. Proc. Natl. Acad. Sci. USA. 2001;98:10037–10041. doi: 10.1073/pnas.181342398. [DOI] [PMC free article] [PubMed] [Google Scholar]
- 34.Cornell W.D., Cieplak P., Kollman P.A. A second generation force field for the simulation of proteins, nucleic acids, and organic molecules. J. Am. Chem. Soc. 1995;117:5179–5197. [Google Scholar]
- 35.Pearlman D.A., Case D.A., Kollman P. AMBER, a package of computer programs for applying molecular mechanics, normal mode analysis, molecular dynamics and free energy calculations to stimulate the structural and energetic properties of molecules. Comput. Phys. Commun. 1995;91:1–42. [Google Scholar]
- 36.Dolinsky T.J., Nielsen J.E., Baker N.A. PDB2PQR: an automated pipeline for the setup of Poisson-Boltzmann electrostatics calculations. Nucleic Acids Res. 2004;32(Web Server issue):W665–W667. doi: 10.1093/nar/gkh381. [DOI] [PMC free article] [PubMed] [Google Scholar]
- 37.Schutz C.N., Warshel A. What are the dielectric “constants” of proteins and how to validate electrostatic models? Proteins. 2001;44:400–417. doi: 10.1002/prot.1106. [DOI] [PubMed] [Google Scholar]
- 38.Simonson T., Brooks C.L. Charge screening and the dielectric constant of proteins: Insights from molecular dynamics. J. Am. Chem. Soc. 1996;118:8452–8458. [Google Scholar]
- 39.Méndez R., Leplae R., Wodak S.J. Assessment of blind predictions of protein-protein interactions: current status of docking methods. Proteins. 2003;52:51–67. doi: 10.1002/prot.10393. [DOI] [PubMed] [Google Scholar]
- 40.Hwang H., Pierce B., Weng Z. Protein-protein docking benchmark version 3.0. Proteins. 2008;73:705–709. doi: 10.1002/prot.22106. [DOI] [PMC free article] [PubMed] [Google Scholar]
- 41.Chen H.L., Zhou H.X. Prediction of interface residues in protein-protein complexes by a consensus neural network method: test against NMR data. Proteins. 2005;61:21–35. doi: 10.1002/prot.20514. [DOI] [PubMed] [Google Scholar]
- 42.Brock K., Talley K., Alexov E. Optimization of electrostatic interactions in protein-protein complexes. Biophys. J. 2007;93:3340–3352. doi: 10.1529/biophysj.107.112367. [DOI] [PMC free article] [PubMed] [Google Scholar]
- 43.Mason A.C., Jensen J.H. Protein-protein binding is often associated with changes in protonation state. Proteins. 2008;71:81–91. doi: 10.1002/prot.21657. [DOI] [PubMed] [Google Scholar]
- 44.Talley K., Ng C., Alexov E. On the electrostatic component of protein-protein binding free energy. PMC Biophys. 2008;1:2. doi: 10.1186/1757-5036-1-2. [DOI] [PMC free article] [PubMed] [Google Scholar]
- 45.Mihalek I., Res I., Lichtarge O. On itinerant water molecules and detectability of protein-protein interfaces through comparative analysis of homologues. J. Mol. Biol. 2007;369:584–595. doi: 10.1016/j.jmb.2007.03.057. [DOI] [PubMed] [Google Scholar]
- 46.Gabdoulline R.R., Wade R.C. On the protein-protein diffusional encounter complex. J. Mol. Recognit. 1999;12:226–234. doi: 10.1002/(SICI)1099-1352(199907/08)12:4<226::AID-JMR462>3.0.CO;2-P. [DOI] [PubMed] [Google Scholar]
- 47.Grünberg R., Leckner J., Nilges M. Complementarity of structure ensembles in protein-protein binding. Structure. 2004;12:2125–2136. doi: 10.1016/j.str.2004.09.014. [DOI] [PubMed] [Google Scholar]
- 48.Lee L.P., Tidor B. Optimization of binding electrostatics: charge complementarity in the barnase-barstar protein complex. Protein Sci. 2001;10:362–377. doi: 10.1110/ps.40001. [DOI] [PMC free article] [PubMed] [Google Scholar]
- 49.Lee L.P., Tidor B. Barstar is electrostatically optimized for tight binding to barnase. Nat. Struct. Biol. 2001;8:73–76. doi: 10.1038/83082. [DOI] [PubMed] [Google Scholar]
- 50.Schreiber G., Haran G., Zhou H.X. Fundamental aspects of protein-protein association kinetics. Chem. Rev. 2009;109:839–860. doi: 10.1021/cr800373w. [DOI] [PMC free article] [PubMed] [Google Scholar]
- 51.Selzer T., Albeck S., Schreiber G. Rational design of faster associating and tighter binding protein complexes. Nat. Struct. Biol. 2000;7:537–541. doi: 10.1038/76744. [DOI] [PubMed] [Google Scholar]
- 52.Vijayakumar M., Wong K.Y., Zhou H.X. Electrostatic enhancement of diffusion-controlled protein-protein association: comparison of theory and experiment on barnase and barstar. J. Mol. Biol. 1998;278:1015–1024. doi: 10.1006/jmbi.1998.1747. [DOI] [PubMed] [Google Scholar]
- 53.Camacho C.J., Weng Z.P., DeLisi C. Free energy landscapes of encounter complexes in protein-protein association. Biophys. J. 1999;76:1166–1178. doi: 10.1016/S0006-3495(99)77281-4. [DOI] [PMC free article] [PubMed] [Google Scholar]
- 54.Humphrey W., Dalke A., Schulten K. VMD: visual molecular dynamics. J. Mol. Graph. 1996;14 doi: 10.1016/0263-7855(96)00018-5. 33–38, 27–28. [DOI] [PubMed] [Google Scholar]
Associated Data
This section collects any data citations, data availability statements, or supplementary materials included in this article.