

Abstract
We report quantitative measurements of the velocity field of collectively migrating cells in a motile epithelium. The migration is triggered by presenting free surface to an initially confluent monolayer by using a microstencil technique that does not damage the cells. To avoid the technical difficulties inherent in the tracking of single cells, the field is mapped using the technique of particle image velocimetry. The main relevant parameters, such as the velocity module, the order parameter, and the velocity correlation function, are then extracted from this cartography. These quantities are dynamically measured on two types of cells (collectively migrating Madin-Darby canine kidney (MDCK) cells and fibroblastlike normal rat kidney (NRK) cells), first as they approach confluence, and then when the geometrical constraints are released. In particular, for MDCK cells filling up the patterns, we observe a sharp decrease in the average velocity after the point of confluence, whereas the densification of the monolayer is much more regular. After the peeling off of the stencil, a velocity correlation length of ∼200 μm is measured for MDCK cells versus only ∼40 μm for the more independent NRK cells. Our conclusions are supported by parallel single-cell tracking experiments. By using the biorthogonal decomposition of the velocity field, we conclude that the velocity field of MDCK cells is very coherent in contrast with the NRK cells. The displacements in the fingers arising from the border of MDCK epithelia are very oriented along their main direction. They influence the velocity field in the epithelium over a distance of ∼200 μm.
Introduction
In the large general context of cell motility, collective cell migration, largely controlled by intercellular communication of a chemical or mechanical nature, has recently received a lot of attention. Indeed, many biological processes result from the coordinated motion of many cells rather than individual migrations. In this case, the models of single-cell motility, although obviously an essential piece of our understanding of these phenomena, cannot by themselves describe situations such as migrating cell sheets in morphogenesis or wound-healing situations for which cells are involved in adhesive contacts with other cells (1).
It is of interest that many features of collective migration are shared by several very different systems (2). The strong relationship between wound-healing and dorsal closure, for instance, has been recognized for a long time (1). More recently, the development of the zebrafish lateral line (3), the morphogenesis of blood vessels (4), and multicellular structures appearing in wound-healing processes (5) have also shown striking similarities with three-dimensional multicellular extensions stemming from tumors (6).
In a previous article (5), we used an original microfabrication-based technique to study situations related to wound healing, in which virgin surface is presented to a confluent epithelium with no damage made to the cells. We were thereby able to investigate the collective migration of cells in response to the sudden appearance of free boundaries. The stencil-based device, described in more details in Poujade et al. (5), consists in applying openware microfabricated polydimethylsiloxane (PDMS) thin films to the surface before the experiment. The cells are then seeded and cultured in the apertures of these microstencils until they reach confluence, at which point the stencils are carefully removed. This sudden release of the available surface is sufficient to trigger the motility of Madin-Darby canine kidney (MDCK) epithelial cells. As the cells maintain cell-cell contacts via cadherins (7), they do not migrate independently but rather show features of a collective migration characterized in particular by large-scale motions involving typically 10–15 cells. In this progression on the free surface, a fingering of the border has then been evidenced. Each finger is preceded by a very peculiar large leader cell that develops a large ruffling lamellipodium on its front side while keeping strong cadherin-mediated cell-cell contacts with the following cells of the finger. Similar structures have been observed for other cell types in different situations (8–10). Several models that include a chemotactic signaling (11) or are based on purely physical instabilities (12) have been proposed recently to interpret these observations.
In this context, a dynamical mapping of the velocity field in the monolayer is necessary to fully characterize these collective modes of migration. Classically, the measurement of displacement fields and hence velocity fields is performed by tracking individual cells during a time sequence (10). However, these tracking strategies require many cells to accurately map a collective phenomenon. They are also often difficult to fully automate practically. In particular, the contrast in the images can be too low and/or nonconstant during an experiment, making the cells difficult to identify nonambiguously from one image to the next. Furthermore, another difficulty arises when cells divide.
Particle image velocimetry (PIV) (13) is an alternative whole-field technique that has been recently applied in similar problems (14), bypassing some of these difficulties. PIV is a cross-correlation technique initially developed in hydrodynamics, which has been proven to be quite powerful for characterizing local displacements in real time. The technique is based on calculation of the correlation between subwindows in successive images to deduce the local displacement. Although the study of fluids requires the addition of microscopic tracers, it is not the case when dealing with living cells. Indeed, the intracellular details give enough texture to the images so that the introduction of exogenous particles is not necessary.
In this article, we study the collective migration of epithelial cells in response to free surface using the microstencil approach, based on the use of the PIV technique. We validate our results by comparing them with analysis of the motion of individual cells by more classical tracking strategies. To fully characterize the velocity field both spatially and temporally, it is necessary to decompose it in orthogonal finite series of spatiotemporal structures. In this respect, the biorthogonal decomposition (BOD) (15) is a particularly valuable mathematical tool for revealing potential coherent structures in both space and time.
After having described the different techniques used in this study, and the experiments performed, we will discuss the behaviors of the MDCK cells, first within the epithelium and then in the fingers stemming from the edges. These results will be compared with the migration of fibroblastlike normal rat kidney (NRK) cells that exhibit more independent behaviors.
Materials and Methods
Microfabrication of the stencils
Microstencils were molded in PDMS elastomer (Sylgard 184, Dow Corning, Midland, MI) from a photoresist template using a protocol derived from Poujade et al. (5) (see Fig. S1 in the Supporting Material). Briefly, 30- to 100-μm-thick rectangular prism structures were fabricated in negative photoresist (SU8-2025 or SU8-2075, Microchem, Newton, MA) by conventional photolithography. Because this structure was too rigid to be used in conformational contact, it was replicated in the soft silicone elastomer (PDMS) by a double molding. The surface of PDMS was made nonadhesive by a plasma treatment followed by the reaction of a fluorosilane on this activated surface. To obtain the final microstencils, the last PDMS mold was placed on a clean PET film and uncured PDMS was allowed to penetrate the structure by capillary action for 3–4 h. The whole set-up was then cured at 65°C for 48 h and the plastic film was peeled off. To allow easier subsequent handling, the microstencils were then assembled with a thick PDMS frame with uncured PDMS. In this study, the apertures in the stencils were 300 μm to 1 mm wide and 2 mm long.
Cell culture
The wild-type MDCK cell lines (16) and the NRK cells (17) were cultured in Dulbecco's modified Eagle's medium (Gibco, Carlsbad, CA) supplemented with 10% FBS (Sigma, St. Louis, MO), 2 mM L-glutamin solution (Gibco), and 1% antibiotic solution (penicillin (10,000 U/mL) and streptomycin (10 mg/mL)) (Gibco), at 37°C, 5% CO2, and 95% relative humidity.
Model wounds
Six-well plates were used for the video microscopy experiments. Microstencils were deposited on the surface, and cells were cultured for typically 12–24 h in a CO2 incubator (37°C, 5% CO2, 95% relative humidity). After this step, the microstencils were gently peeled off with forceps. The exact cell densities (4 × 10⁵ to 6 × 10⁵ cells/cm2) were measured a posteriori on the images.
Time-lapse microscopy
Time-lapse multifield experiments were performed in phase contrast on an automated inverted microscope (IX-71, Olympus, Tokyo, Japan) equipped with an incubator regulating temperature (37°C), humidity (95% relative humidity), and CO2 concentration (5%) (Life Imaging Service, Basel, Switzerland). The displacements of the sample (Moving Stage, Prior Scientific, Cambridge, United Kingdom) and the image acquisition (CCD camera, Retiga, QImaging, Surrey, Canada) were computer-controlled using Metamorph (Universal Imaging) software. High-resolution images with large fields of view (1.5 × 1.5 mm) were reconstructed by stitching elementary images acquired with a 20× objective. The typical delay between two successive images of the same field was set to 15 min except in the fast early stages, where a 5-min time lapse was used. The average velocity of the border was computed from the evolution of the area covered by the cells, including fingers if need be.
Mapping of the velocity field and analysis
The PIV analysis was performed offline using a customized version of the Matpiv software package (a GNU public license software, www.math.uio.no/∼jks/matpiv/) for MATLAB (The MathWorks, Natick, MA) (18,19). The routines were adapted to our particular situation. In particular, to avoid peak-locking, the images were first filtered using a fast Fourier transform bandpass filter 4–7 pixels wide. Unless otherwise noted, we used 32 × 32-pixel interrogation windows with 50% overlap. Typically, the mapping of a 15-h acquisition of a 2-mm2 epithelium was performed in 12 h.
Calculation of the correlation between two successive subwindows was preferentially performed by fast Fourier transform (the “single” method). However, other methods in which correlations are more directly calculated (the “norm” or “mqd” method), were also occasionally used, with no noticeable difference. Aberrant vectors, for instance resulting from divisions, were filtered out from the velocity fields with a median Gaussian filter.
The BOD analysis consists mainly in solving an eigenvalue problem. This task was performed using Matlab.
Tracking
Tracking was performed using the ImageJ open license software (20). To avoid prohibitively long analysis times, only smaller areas were analyzed in this case. To localize the geometric centers of the MDCK cells, the images were manually thresholded and analyzed with the “analyze particles” routine developed for ImageJ in conjunction with the Matlab “track” routine to sort the data. Care was taken to minimize the artifacts of binarization and to allow the creation of new trajectories due to cell division in the course of an experiment. As a control, we checked on several randomly selected image stacks that we got the same trajectories with a manual tracking of the cells. For NRK cells, the contrast of the images was too low to allow for the automated procedure, and tracking was only performed manually.
Description of the Analysis
Notation
Table 1 recaps the notations used in this article.
Table 1.
Summary of notations used in study
| x (resp. y) | Spatial coordinate along the long (resp. short) side of the strip of cells. y is positive toward the exterior of the strip. The origin of the y axis is set in the middle of the initial strip. See Fig. 2. |
| ; r | is the vector of coordinates (x,y); r is the norm of : r = . |
| u (resp. v) | Component of the local velocity along the x (resp. y) axis. |
| u∗ (resp. v∗) | Deviation from the mean values of u (resp. v): u∗ = u − 〈u〉; v∗ = v − 〈v〉 |
| ϕ | Angle of the velocity relative to the normal of the strip: cosϕ = v/(u2 + v2)1/2 |
| Spol | Polar order parameter: Spol = 〈cosϕ〉 |
| I(); I(r) | Spatial velocity correlation functions |
PIV analysis
PIV is a whole-field technique widely used in hydrodynamics to map the flows in a fluid (13). Usually, the fluid is seeded with small isodensity tracers, and a sequence of images is recorded. The images are then divided into subwindows (interrogation windows) and the correlation within each of these subwindows is calculated between successive images, yielding the displacement field between two successive images and, thus, the velocity field.
This technique is quite versatile and has been used recently for nonhydrodynamics problems such as wind-induced motion of crop canopies (21), coordinated motions of bacteria (22), or morphogenetic movements in Drosophila embryos (14,23). In these examples, as in the situation presented here, there is no need for exogenous tracers, since the images naturally contain details, such as organelles or membranes, smaller than the interrogation windows and sufficient to calculate the correlations.
As with any discrete method, the minimum nontranslational global displacement that can be detected is the size of the window itself. On the other hand, the maximum local displacements cannot exceed half the size of the subwindows. For a given time interval, this last constraint therefore determines their minimum size and limits the spatial resolution (24).
Here, the time interval between two images is 15 min, and an overestimate of the maximum velocity is 30 μm·h−1, i.e., 40 pixels·h−1. The maximum displacement between two successive interrogation windows is thus ∼10 pixels. From the limitation mentioned above, we have thus chosen interrogation windows of 32 × 32 pixels, i.e., 24 × 24 μm. Controls performed with 16 × 16-pixel (12 × 12-μm) or 64 × 64-pixel (48 × 48-μm) interrogation windows were also used and gave the same results. By monitoring the position of particles stuck on the surface, it was checked that the error due to drift and repositioning between successive images was small (∼0.5 μm·h−1) compared to the actual measured velocities.
On the basis of the calculated velocity field, several quantities can be easily obtained, such as the two-dimensional polar order parameter, Spol = 〈cosϕ〉 (25). With this definition, Spol = 1 when the whole movement is perpendicular to the initial border, directed outward; Spol = −1 in the (unphysical) situation in which the global motion would be perpendicular to the initial border but directed inward; and S = 0 when there is no particular orientation of the displacements perpendicular to the border.
To estimate the distance over which the movements are correlated, we calculate the velocity spatial correlation function, . To perform this calculation, we use the x-component of the velocity u rather than the total velocity vector. Indeed, with time, the movements of the cells get organized normally to the strip and outward. The velocity spatial correlation calculated with v becomes rapidly equal to −1 at large distances, hiding the details of the organization of the cells away from this main direction. Moreover, using u∗ instead of u gives the right normalization: and .
It is interesting at this point to discuss the expected advantages of PIV in comparison to more conventional particle tracking. One advantage of PIV is that phase-contrast images can be used without further processing, and the contrasts within the images are then sufficient to perform the PIV calculation, whereas tracking may be difficult, because the boundaries between cells are not always well defined. Cell division is difficult to handle using both techniques. However, it is better handled by PIV, since it appears as an aberrant vector that can be easily removed, whereas the track of a dividing cell is lost and must be reconstructed. Once the velocity field is measured, many quantities can be easily extracted, such as the rotational, the divergence, or, as in the case presented here, the correlations. One limitation of PIV, besides the important limitation regarding resolution, already mentioned, is that individual trajectories (the history of single cells) cannot be obtained, whereas cell tracking algorithms are designed precisely to access this piece of information for many cells in parallel. The time correlations are then easier to perform. Another advantage of cell tracking is the possibility of uncoupling the actual displacements within the monolayer from the deformations of the cells.
Biorthogonal decomposition
Since the movements in the monolayer are complex and involve many cells, it is interesting to study their coherence. To that end, we need to uncouple the temporal and spatial modes of the velocity field. This is efficiently performed using biorthogonal decomposition (BOD). This method decomposes a signal depending on space and time in a finite series of spatiotemporal functions that can potentially reveal coherent structures (15). In particular, it has been shown in several examples that the rate of convergence of such a series is a good indication of the presence of large coherent structures (26).
More specifically, if we consider the velocity fields in the monolayer , where M is the point of coordinate (x,y) and t is time, the BOD is , where are the spatial modes called topos and are the temporal modes called chronos. The topos are a family of orthogonal functions in the spatial domain, whereas the chronos are orthogonal functions in the temporal domain.
Aubry et al. (15) have shown that the series converges in norm and that the topos are the eigenfunctions of the spatial correlation operator of V, whereas the chronos are the eigenfunctions of the temporal correlation operator of V. Quite remarkably, the eigenvalues, αk2, are common to the topos and the chronos. Furthermore, αk2 is the energy of the structure associated with the kth mode (ψk(M), μk(t)) (15,26). The total energy is, therefore, and the fraction of recovered energy for the n first modes is . In the case presented here, the velocity field results from the PIV calculation, so the signal is discrete. Thus, in the above formulation, functions are replaced by vectors and correlation operators by correlation matrices.
In practice, since the number of time steps is much smaller than the number of spatial modes, we first calculate the temporal correlation matrix, solve the temporal eigenvalues problem, and then deduce the spatial modes. The rate of convergence of the series is a good indication of the presence of coherent structures (26): if the signal shows some coherence, the first modes are sufficient to describe its main space and time characteristics, and therefore, the series converges rapidly. These first modes are then sufficient to monitor the behaviors (size and velocity) of these structures.
Results and Discussion
Epithelium
Velocity evolution
Using the PIV analysis, we have first monitored the evolution of the velocity within the MDCK epithelium as the cells approach confluence in the stencils (Fig. 1 A). We find that the amplitude of the movements decreases in two steps: As long as the cells do not form a continuous monolayer, the amplitude remains constant, with a velocity of 12 μm·h−1 ± 2 μm·h−1; then, when the monolayer approaches confluence, this average velocity decreases very rapidly to 8 μm·h−1 in ∼1 h (the point of confluence is defined as the point where the last void within the monolayer disappears). This fast process is followed by a slower decrease after confluence has been reached, down to a low value of 4 ± 1 μm·h−1 ∼10 h after confluence. The velocity then stabilizes at this value and corresponds to local limited displacements. This evolution of the velocity corresponding to the so-called migration contact inhibition (27), is correlated with an increase of the density up to a value of ∼4–5 × 10⁵ cells/cm2, although the point at which the cells reach confluence does not correspond to any salient feature in the density evolution (Fig. 1 A). At much longer timescales, this velocity slowly decreases as the monolayer further densifies (not shown). This last regime is very different (A. Pulifiato, B. Shraiman, KITP, UCSB, personal communication, 2009) and has not been studied here. The average velocity of NRK cells cultured in the same conditions displays a similar trend (Fig. S2), although the point of confluence is not as visible as it is for MDCK cells and the decrease in velocity takes longer. It is worth noticing that the criterion of confluence itself is not as well defined for NRK cells as it is for MDCKs. Indeed, NRK cells move more independently, and they dynamically create and close holes in the monolayer. The density curve is also difficult to plot, for similar reasons: cells often overlap, and their number is difficult to monitor.
Figure 1.
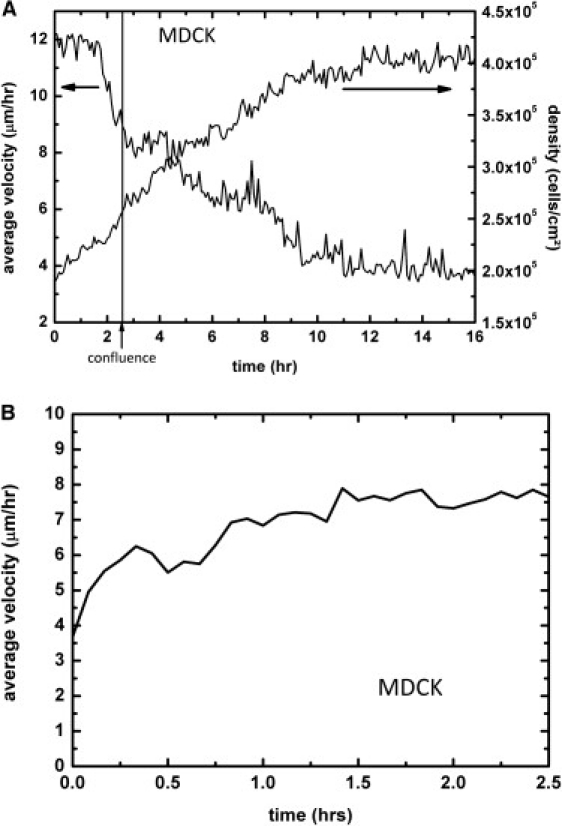
(A) Time evolution of the average velocity and density within the MDCK monolayer when approaching confluence. The cells are initially quite active (average velocity ∼12–13 μm·h−1). The average cell velocity decreases sharply as they interact when approaching confluence. After confluence, the velocity decreases more slowly and stabilizes at a low value of 4 μm·h−1. This evolution of the velocity is correlated with a densification of the epithelium, although the point of confluence is not directly visible on the density evolution. (B) Upon removal of the stencil 4 h after confluence, the mean velocity rapidly increases (t = 0 corresponds to 5 min after stencil removal). Note the difference in timescale between A and B. The initial stencil width was 1 mm. Similar results were obtained from four different experiments.
Immediately after the removal of the stencil, we observe a significant very fast outward displacement of the cells localized at the border (involving approximately three cell rows) (not shown). For these cells, the instantaneous velocity increases to values as high as 25 ± 5 μm·h−1 in less than 5 min. This very short timescale has already been observed by Nikolić (28). These fast displacements, which may be caused by a sudden spreading of the border cells, are, however, only observed during the first 20 min after the removal of the stencil. Then, the speed of the border cells decreases to values close to the average velocity measured in the monolayer.
As for the cells within the epithelium (more than five rows away from the border), the mean velocity increases from 3 ± 1 μm·h−1 to 8 ± 1 μm·h−1 in typically 2 h, starting from the removal of the stencil. The velocity then stabilizes at this value (Fig. 1 B). During the same characteristic time (of the order of 1 h), the velocity field gradually develops in the epithelium. These fields are complex and exhibit long-range correlations that are clearly visible in Fig. 2 A.
Figure 2.
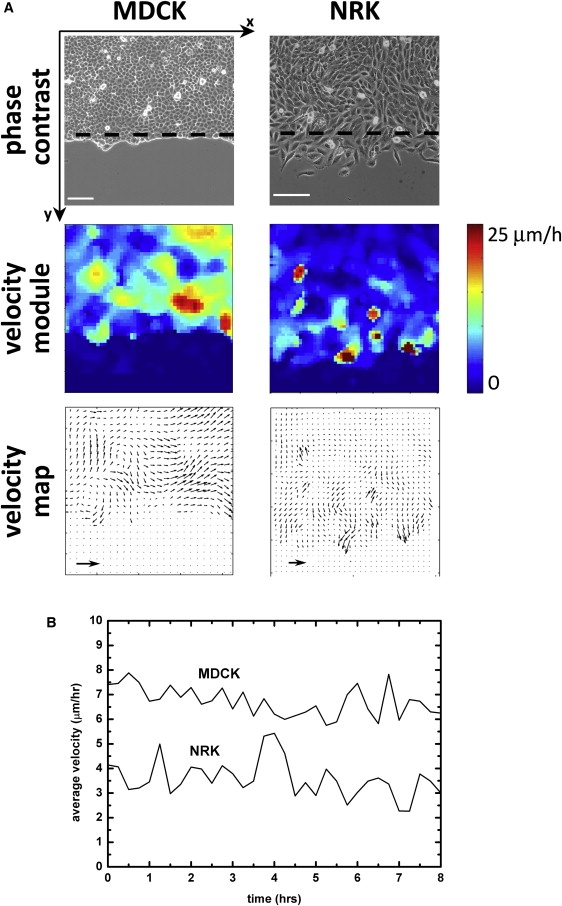
(A) Comparison of the movements of MDCK and NRK cells in the monolayer 2 h after removal of the stencil. The high-velocity hot spots are uncorrelated with the cell divisions, which are visible in the form of white dots in the phase-contrast images. High-velocity regions are localized next to the free border for NRK cells and distributed more uniformly for MDCK cells (velocity module map), as a result of which the average velocity is lower for NRK cells (B). In both cases, these velocities are not necessarily normal to the border (velocity map). Note, in B, the remarkably constant average cell velocities for both cell types for several hours (t = 0 corresponds to 1.5 h after stencil removal). Scale bars, 100 μm; arrows, 40 μm·h−1. Dashed lines are the positions of the initial free border. The initial stencil width was 1 mm. These results were reproduced in several independent experiments with stencil width varying between 300 μm and 1 mm, with no difference.
It is of interest that these movements are not necessarily directed toward the free surface. Although local velocities can be as high as 18 μm·h−1, their typical value averaged over the whole band is ∼8 μm·h−1, which is comparable to that observed at the border of the monolayer after the fast initial stage described above. These observations are a consequence of the presence of actively moving cells several rows behind the border (29).
It is instructive to compare these results with fibroblastlike NRK cells that exhibit much weaker intercellular adhesions and do not exhibit a fingering of the border. In this case also, the velocity field is not necessarily directed toward the free surface, but it does not present the long-range correlations outlined for MDCK cells (Fig. 2). Furthermore, the mean velocity for migrating NRK cells is 4 ± 1 μm·h−1, about half the value obtained for the MDCK cells (Fig. 2 B), and the regions of relatively higher velocity are more localized within the first 200 μm next to the border of the monolayer.
At longer times, the displacements tend to orient normally to the strip. This orientation can be quantified with the order parameter Spol. At the beginning of the experiment (2 h after the removal of the stencil), there is no noticeable orientation in the strip yielding Spol = 0 ± 0.1, meaning that the velocities are randomly distributed. With time, these movements get organized perpendicularly to the initial border of the strip to which they are closer. As a consequence, Spol increases until it reaches 0.75 ± 0.1 after 25 h (Fig. 3 A). (Please note that in Fig. 3 A, the origin of times is taken 1.5 h after the removal of the stencil). This situation is observed with strips of initial width >300 μm. Indeed, it has been shown that leader cells interact with their followers and influence the movements of other cells over a distance of ∼200 μm (5): When the width of the strip is ≤150 μm, the two borders are no longer independent and all the cells along the width of the strip tend to progress in one direction. Fig. 3 B gives a dynamic picture of the local ordering in a strip. In this graph, the local order parameter is averaged over the whole length of the strip (along x). With the definition of the order parameter that we have chosen, cells moving randomly and cells moving parallel to the border contribute equally to a zero order parameter. However, a control, in which we excluded cells whose velocity was below a certain threshold, gave essentially similar results (not shown).
Figure 3.
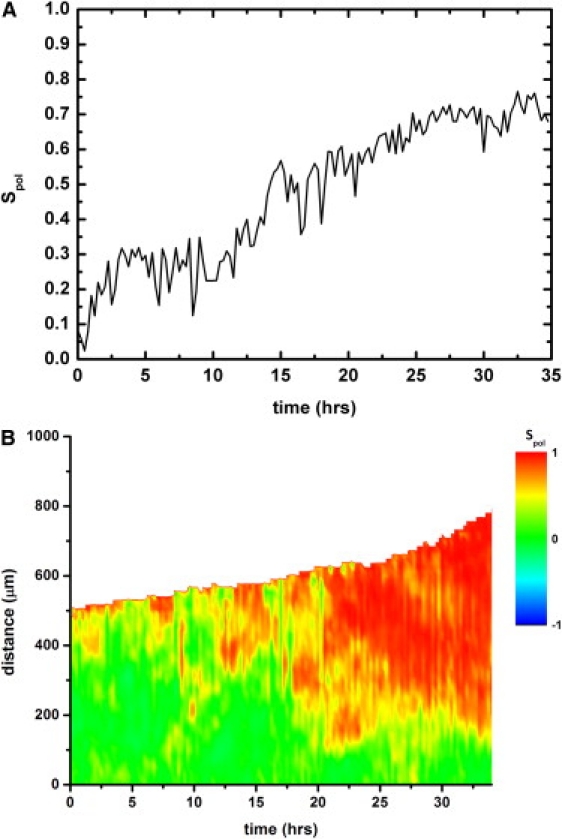
(A) Time evolution of the order parameter averaged over the whole strip for MDCK cells. (B) Spatiotemporal diagram of the evolution of the local order parameter. The origin of the distance in the y direction is taken at the center of the initial strip. Initial stencil width was 1 mm, and t = 0 corresponds to 1.5 h after stencil removal. These results were reproduced in several independent experiments for initial stencil widths of 300 and 400 μm.
To confirm these results and validate the use of the PIV technique on these bidimensional cellular systems, we compared this technique with the tracking of individual cells. We first select arbitrarily a 5000-μm2 area in the epithelium that comprises typically 20 cells and follow the trajectories of each of these cells with time. We observe that after 10 h, the overall area increases because of the divisions. It also deforms during the migration but keeps its integrity (Fig S3 A): the trajectories of neighboring cells are thus correlated, which is consistent with the results of the PIV analysis. We estimate the characteristic time during which these contacts are maintained before their disruption by cell division or a rearrangement in the monolayer to ∼10 h.
To gain further insight into this collective migration, we isolated arbitrary pairs of adjacent cells at different locations with respect to the border and followed them for several hours (Fig. S3 B). The average distance between their centers of mass, 〈d〉, as a function of time and the corresponding distance distribution are plotted in Fig. 4 and Fig. S4. Initially, when the cells are in contact, their intercellular distance is close to a cell diameter (∼20 μm). For MDCK cells, 〈d〉 only fluctuates with time about an average value of 20 ± 3 μm, which is about the size of a cell (Fig. 4, solid line, and Fig. S4 A). Thus, two MDCK cells in contact at the beginning of the experiment keep their contacts during the typically 15 h of an experiment, wherever they were initially located in the strip (in this analysis, the divisions that occurred in the monolayer were discarded. They would appear in Fig. S4 as secondary peaks at a position of ∼30 μm). In contrast, NRK cells initially in contact lose this contact very rapidly (Fig. 4, dashed line). The distribution of intercellular distances of two cells initially in contact dramatically broadens (Fig. S4 B).
Figure 4.

Intercell average distance for 250 independent pairs of both MDCK (solid line) and NRK (dashed line) cells that were initially in contact. Starting from two neighbor cells, this distance does not vary for MDCK cells, which remain in contact, but steadily increases for NRK cells as they separate. The full distributions of the intercellular distances at t = 0 and t = 10 h are plotted in Fig. S4.
The spatial velocity correlation function, (averaged over all the directions), quantifies the lengthscale over which these displacements within the monolayer are truly collective. To focus on the motions inside the monolayer, we exclude the first five rows of cells in the calculation of I(r). These calculations then lead to the same result in the x and y directions. For MDCK cells, we find that I(r) decreases with a typical length of lc ≈ 200 μm, corresponding to ∼15 cells (Fig. 5, solid line). It is interesting to note that Haga et al. have measured similar correlation lengths on limited islands of MDCK cells migrating on a glass substrate (∼20–100 cells) (30). Other cell types in different situations also show this type of correlated motion (10). The markedly different behavior of strips narrower than 150 μm, compared to wider strips previously outlined (5), is thus consistent with this value of lc. If the strips are narrower than this length, the two borders are bound to interact directly via the collective correlated motions within the epithelium that affect their progression.
Figure 5.

Velocity spatial correlation functions. For MDCK cells, the movements are highly correlated, and the correlation function decreases with a typical correlation length, lc, of ∼200 μm (solid lines), whereas for NRK cells, whose migration is less collective, lc = ∼40 μm (dashed lines). Note that the curves represent different experiments. They have been time-averaged for 5 h. Initial stencil widths ranged from 300 μm to 1 mm, with no difference observed based on stencil width.
Conversely, using fibroblastlike NRK cells, which present much weaker intercellular interactions, this correlation length is much smaller (∼40 μm, corresponding to only two cells (Fig. 5, dashed line)). Indeed, the behavior of the NRK cells is quite different from MDCK cells: the movements of the cells in the monolayer appear to be less correlated, and some of the cells of the border lose their contact with their neighbors.
BOD
As PIV and particle tracking reveal very complex and highly correlated movements in the monolayer, we used the BOD to quantitatively study the coherence of the velocity fields obtained by PIV.
For signals of low coherence, all the modes are equivalent and the energy is equally distributed between the different spatiotemporal modes. In contrast, the main characteristics of a very coherent signal can be well accounted for by a limited number of modes that are therefore the main contributors to the total energy. As a consequence, the plot of the fraction of the recovered energy as a function of the spatiotemporal mode is a good indication of the presence of coherent structures.
Here, dealing with MDCK cells, we find that the first two modes contain more than 50% of the total energy (58%) and that 80% of the total energy is recovered in the first 10 modes (Fig. 6 A, open circles), which is considered to be a fast convergence of the decomposition (26). As a consequence, the two most energetic topos are sufficient to account for the overall shape of the strip, as well as for the high-velocity areas that correspond to the initiation of leader cells (see next section) (Fig. 6 B).
Figure 6.

(A) Convergence of the series of spatiotemporal modes for MDCK cells (open circles) and NRK cells (solid circles). For the MDCK cells, 80% of the total energy is recovered for the 10 first modes (60% for the NRK). The fraction of the recovered energy is defined as . (B) Topos of the most energetic mode (right) and the corresponding phase-contrast images (left) for MDCK cells. The finger-free bottom edge in B results from a statistical fluctuation. The two lower images are zooms of the insets in the upper images. These topos clearly show that leader cells create coherent movements in the strip. Pictures are taken 22 h after removal of the stencil. Dashed lines indicate the positions of the initial free border. Scale bars, 200 μm (upper) and 100 μm (lower). Arrows indicate arbitrary units. The initial stencil width was 1 mm. No difference was observed for initial stencil widths ranging from 300 μm to 1 mm.
In contrast with MDCK cells, the series of modes of the velocity field for the NRK cells converges much more slowly, which confirms that the movements are less coherent. Indeed, comparing two series of images of the same size (500 μm × 500 μm) and the same time resolution, 50% ± 2% of the total energy is recovered in the first mode for MDCK cells, whereas only 20% ± 2% is recovered for NRK cells (Fig. 6 A).
Our best efforts to get a spatial wavelength from the Fourier Transform of the first topos were not successful. If there is a characteristic lengthscale between the identified coherent structures, it cannot be distinguished from the background.
Except for the two first modes, the chronos are dominated by noise. Nevertheless, the first mode increases steadily with time to become largely predominant over the second mode (Fig. S5, solid line), whereas the second mode decreases to become negative after an initial increase (Fig. S5, dashed line). Chronos 1 reaches a maximum after 10 h, which is indicative of the long characteristic timescales involved before rearrangements of MDCK cells in the monolayer. As the first topos is less noisy and more coherent than the second, altogether these results show that the movements of the cells get organized with time, which is consistent with Fig. 3 and the derived conclusions.
Fingers
Whereas the initial border of the strip is flat, digitations begin to appear on the border of the strips after typically 2 h. These fingers are preceded by a very spread-out and active leader cell whose particular phenotype has been characterized in Poujade et al. (5). It is worth noting that these leader cells do not systematically originate from the initial border but often arise from the second or third row. Before they become leaders, they cannot be distinguished from the other cells (same size, same velocity, no singularity in the velocity field). In particular, they are not correlated with a density fluctuation. However, when a finger begins to form, the BOD analysis reveals that the presence of the leader cell is correlated with coordinated movements: the shape of the finger is clearly visible in the map of topos 1, whose importance increases with time until it becomes predominant after 15 h. It also appears to induce some movements inside the monolayer. We have thus studied the velocity fields in the finger vicinity as the fingering of the border develops, focusing particularly on the areas close to the leader cells.
The velocity of the leader itself remains remarkably constant at 18 μm·h−1 ± 10% in our experimental conditions, in agreement with previous measurements (5). This is in contrast with the average behavior of the border of the strip, whose progression has been shown to be accelerated in the first 15 h until it reaches the value of ∼10 μm·h−1. The fingers are also characterized by a high directionality: the direction of the velocity remains constant ± 5% for 10 h.
Moreover, if we plot the velocity profile along the finger, the velocity is maximal for the leader and then decreases along the fingers (Fig. 7 B). For short fingers (whose length is <150 μm), the influence of the leader cell is felt much further than the finger extension since the velocity field decreases in the monolayer over a characteristic length Ic ∼ 200 μm. Indeed, the velocity profile remains above the average velocity in the monolayer as far as 150–200 μm away from the leader cell (Fig. 7, A and B) and the flow lines converging to the finger and the leader extend well within the monolayer (Fig. 7 C). Finally, if we calculate the order parameter for the cells of a given finger, Ŝpol = 〈cosθ〉 where θ is defined as the angle between the velocity and the direction of the finger, we find Ŝpol = 0.90 ± 0.05. The alignment of the displacements with the finger main axis is thus next to perfect (Fig. 7 A).
Figure 7.
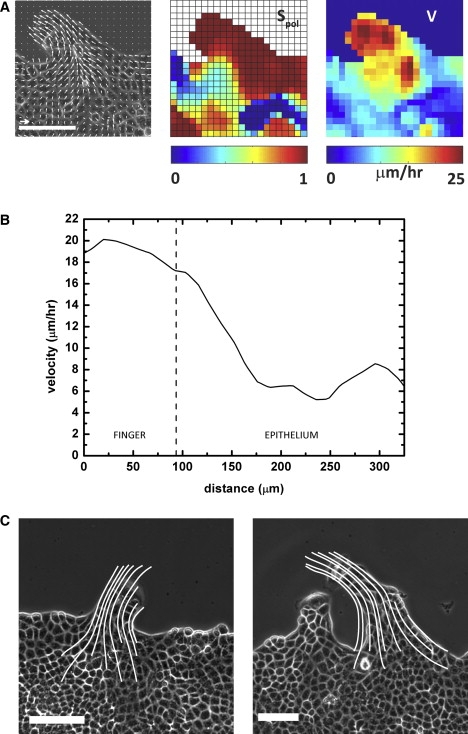
(A) Vicinity of a finger stemming from an MDCK monolayer, with images of the velocity field (left), the order parameter, Ŝpol (center), and the velocity amplitude (right). The order in the finger is near perfect. Scale bar, 100 μm, arrow, 20 μm·h−1. These images were taken 12 h after removal of the stencil, 6 h after outbreak of the finger. (B) Velocity distribution along the direction of a finger. The leader influences the velocity field far within the monolayer as the velocities remain above the 8 μm·h−1 average velocity up to 200 μm after the leader for a 90-μm-long finger. The origin of the distances is taken at the leader. (C) Flow lines for two different fingers. For short fingers (left), the flow lines spread in the monolayer over a typical lengthscale of 200 μm. For longer and more developed fingers (right), the flow lines are very directed within the finger. Scale bar, 100μm. Images were taken 5 h (left) and 15 h (right) after outbreak of the finger.
As the fingers develop and become longer, the velocity remains maximal for the leader and is still larger than the average velocity of the other cells in the finger (Fig. 7 C). However, the cells in the monolayer are no longer influenced by the leader cell: their velocity is not necessarily larger than the average velocity and the direction of their movements uncouples from that of the finger.
Conclusion
In this article, we present two techniques for studying the movements of cells in a migrating monolayer in response to a model wound in which the cells are not injured: particle image velocimetry and particle tracking. We compare two cellular systems: MDCK epithelial cells and the more independent fibroblastlike NRK cells. The PIV technique is an interesting automated approach for mapping the velocity fields in a monolayer, whereas particle tracking is more adapted to the computation of individual trajectories of a limited number of cells.
When the cells reach confluence, the migration contact inhibition induces a marked decrease in the value of the average velocity, whereas the density increases more smoothly. It is of interest that this decrease in velocity at the approach of confluence is more abrupt for MDCK cells, which display a stronger cell-cell adhesion than NRK cells. After the removal of the microstencils, the two techniques lead to similar results: for the more epithelial MDCK cells, their movements in the monolayer are not independent but correlated, showing only very limited rearrangement. Therefore, we can conclude that the behavior of these monolayers is locally more elastic than viscous. For these MDCK cells, the velocity correlation function gives a characteristic length of ∼200 μm, in contrast with NRK cells, for which the characteristic length is much smaller. In the same line, NRK cells rearrange constantly within the monolayer. These results are confirmed by the BOD analysis of MDCK migration, which also shows that the leader cells create coherent movements in the monolayer that are clearly visible in the most energetic topos.
We stress that the information obtained from the analysis of the PIV, in particular the correlation length of the velocity, is based on straightforward phenotypic measurements that can be easily implemented in high-throughput migration assays such as wound closure assays (31–33,10). This correlation length can be used as a quantitative descriptor of the degree of independence of these populations of cells.
Obviously, collective migration is not restricted to two-dimensional systems (although a great deal of morphogenetic or development systems are basically two-dimensional). However, dealing with three-dimensional systems in vivo or in collagen gels to study the collective motions in the evolution of tumors, or in angiogenesis or tubulogenesis, will require a major, but still manageable, adaptation of the technique used in this work.
Supporting Material
Five figures are available at http://www.biophysj.org/biophysj/supplemental/S0006-3495(10)00174-8.
Supporting Material
Acknowledgments
It is a pleasure to acknowledge fruitful discussions with J. Camonis, O. Cochet, M. Deforet, N. Gov, V. Hakim, J.-F. Joanny, C. Py, J. Saragosti, and N. Sepulveda.
Financial support from the Association pour la Recherche sur le Cancer (ARC) and the C'Nano Ile-de-France is gratefully acknowledged.
References
- 1.Martin P., Parkhurst S.M. Parallels between tissue repair and embryo morphogenesis. Development. 2004;131:3021–3034. doi: 10.1242/dev.01253. [DOI] [PubMed] [Google Scholar]
- 2.Rørth P. Collective guidance of collective cell migration. Trends Cell Biol. 2005;17:575–579. doi: 10.1016/j.tcb.2007.09.007. [DOI] [PubMed] [Google Scholar]
- 3.Lecaudey V., Gilmour D. Organizing moving groups during morphogenesis. Curr. Opin. Cell Biol. 2006;18:102–107. doi: 10.1016/j.ceb.2005.12.001. [DOI] [PubMed] [Google Scholar]
- 4.Zeng G., Taylor S.M., Bautch V.L. Orientation of endothelial cell division is regulated by VEGF signaling during blood vessel formation. Blood. 2007;109:1345–1352. doi: 10.1182/blood-2006-07-037952. [DOI] [PMC free article] [PubMed] [Google Scholar]
- 5.Poujade M., Grasland-Mongrain E., Silberzan P. Collective migration of an epithelial monolayer in response to a model wound. Proc. Natl. Acad. Sci. USA. 2007;104:15988–15993. doi: 10.1073/pnas.0705062104. [DOI] [PMC free article] [PubMed] [Google Scholar]
- 6.Wolf K., Wu Y.I., Friedl P. Multi-step pericellular proteolysis controls the transition from individual to collective cancer cell invasion. Nat. Cell Biol. 2007;9:893–904. doi: 10.1038/ncb1616. [DOI] [PubMed] [Google Scholar]
- 7.Kametani Y., Takeichi M. Basal-to-apical cadherin flow at cell junctions. Nat. Cell Biol. 2007;9:92–98. doi: 10.1038/ncb1520. [DOI] [PubMed] [Google Scholar]
- 8.Omelchenko T., Vasiliev J.M., Bonder E.M. Rho-dependent formation of epithelial “leader” cells during wound healing. Proc. Natl. Acad. Sci. USA. 2003;100:10788–10793. doi: 10.1073/pnas.1834401100. [DOI] [PMC free article] [PubMed] [Google Scholar]
- 9.Grasso A., Hernández J.A., Chifflet S. Roles of wound geometry, wound size, and extracellular matrix in the healing response of bovine corneal endothelial cells in culture. Am. J. Physiol. Cell Physiol. 2007;293:C1327–1337. doi: 10.1152/ajpcell.00001.2007. [DOI] [PubMed] [Google Scholar]
- 10.Vitorino P., Meyer T. Modular control of endothelial sheet migration. Genes Dev. 2008;22:3268–3281. doi: 10.1101/gad.1725808. [DOI] [PMC free article] [PubMed] [Google Scholar]
- 11.Ouaknin G.Y., Bar-Yoseph P.Z. Stochastic collective movement of cells and fingering morphology: no maverick cells. Biophys. J. 2009;97:1811–1821. doi: 10.1016/j.bpj.2009.05.064. [DOI] [PMC free article] [PubMed] [Google Scholar]
- 12.Mark S., Shlomovitz R., Silberzan P. Physical model of the dynamic instability in an expanding cell culture. Biophys. J. 2010 doi: 10.1016/j.bpj.2009.10.022. In press. [DOI] [PMC free article] [PubMed] [Google Scholar]
- 13.Raffel M., Willert C.E., Kompenhans J. Springer Verlag; Berlin: 1998. Particle Image Velocimetry, A Practical Guide. [Google Scholar]
- 14.Supatto W., Débarre D., Beaurepaire E. In vivo modulation of morphogenetic movements in Drosophila embryos with femtosecond laser pulses. Proc. Natl. Acad. Sci. USA. 2005;102:1047–1052. doi: 10.1073/pnas.0405316102. [DOI] [PMC free article] [PubMed] [Google Scholar]
- 15.Aubry N., Guyonnet R., Lima R. Spatiotemporal analysis of complex signals: theory and applications. J. Stat. Phys. 1991;64:683–739. [Google Scholar]
- 16.Bellusci S., Moens G., Jouanneau J. A scatter factor-like factor is produced by a metastatic variant of a rat bladder carcinoma cell line. J. Cell Sci. 1994;107:1277–1287. doi: 10.1242/jcs.107.5.1277. [DOI] [PubMed] [Google Scholar]
- 17.Rossé C., Hatzoglou A., Camonis J. RalB mobilizes the exocyst to drive cell migration. Mol. Cell. Biol. 2006;26:727–734. doi: 10.1128/MCB.26.2.727-734.2006. [DOI] [PMC free article] [PubMed] [Google Scholar]
- 18.Reference deleted in proof.
- 19.Sveen, J. K. 2004. An Introduction to MatPIV v. 1.6.1. Eprint no. 2, ISSN 0809–4403, Department of Mathematics, University of Oslo, Oslo, Norway.
- 20.Rasband, W. S. 2007. ImageJ (National Institutes of Health, Bethesda). Available at http://rsb.info.nih.gov/ij/.
- 21.Py, C. 2005. Couplage entre la dynamique du vent et le mouvement d'un couvert végétal. Ph.D. thesis. Ecole Polytechnique, Palaiseau.
- 22.Dombrowski C., Cisneros L., Kessler J.O. Self-concentration and large-scale coherence in bacterial dynamics. Phys. Rev. Lett. 2004;93:098103. doi: 10.1103/PhysRevLett.93.098103. [DOI] [PubMed] [Google Scholar]
- 23.Supatto, W. 2005 Imagerie multiphoton quantitative et ablation laser par impulsions femtosecondes pour l'étude de l'expression génétique mécano-sensible chez l'embryon de drosophile sauvage. Ph.D. thesis, Université Paris 7, Paris.
- 24.Hémon P., Santi F. Applications of biorthogonal decompositions in fluid-structure interactions. J. Fluids Structures. 2003;17:1123–1143. [Google Scholar]
- 25.Kemkemer R., Jungbauer S., Gruler H. Cell orientation by a microgrooved substrate can be predicted by automatic control theory. Biophys. J. 2006;90:4701–4711. doi: 10.1529/biophysj.105.067967. [DOI] [PMC free article] [PubMed] [Google Scholar]
- 26.Py C., de Langre E., Moulia B. A frequency lock-in mechanism in the interaction between wind and crop canopies. J. Fluid Mech. 2005;568:425–449. [Google Scholar]
- 27.Abercrombie M., Heaysman J.E.M. Observations on the social behaviour of cells in tissue culture. II. Monolayering of fibroblasts. Exp. Cell Res. 1954;6:293–306. doi: 10.1016/0014-4827(54)90176-7. [DOI] [PubMed] [Google Scholar]
- 28.Nikolić D.L., Boettiger A.N., Shvartsman S.Y. Role of boundary conditions in an experimental model of epithelial wound healing. Am. J. Physiol. Cell Physiol. 2006;291:C68–C75. doi: 10.1152/ajpcell.00411.2005. [DOI] [PubMed] [Google Scholar]
- 29.Farooqui R., Fenteany G. Multiple rows of cells behind an epithelial wound edge extend cryptic lamellipodia to collectively drive cell-sheet movement. J. Cell Sci. 2005;118:51–63. doi: 10.1242/jcs.01577. [DOI] [PubMed] [Google Scholar]
- 30.Haga H., Irahara C., Kawabata K. Collective movement of epithelial cells on a collagen gel substrate. Biophys. J. 2005;88:2250–2256. doi: 10.1529/biophysj.104.047654. [DOI] [PMC free article] [PubMed] [Google Scholar]
- 31.Nakae K., Yoshimoto Y., Imoto M. Migrastatin, a new inhibitor of tumor cell migration from Streptomyces sp. MK929–43F1. J. Antibiot. (Tokyo) 2000;53:1130–1136. doi: 10.7164/antibiotics.53.1130. [DOI] [PubMed] [Google Scholar]
- 32.Mc Henry K.T., Ankala S.V., Fenteany G. A non-antibacterial oxazolidinone derivative that inhibits epithelial cell sheet migration. ChemBioChem. 2002;3:1105–1111. doi: 10.1002/1439-7633(20021104)3:11<1105::AID-CBIC1105>3.0.CO;2-S. [DOI] [PubMed] [Google Scholar]
- 33.Yarrow J.C., Perlman Z.E., Mitchison T.J. A high-throughput cell migration assay using scratch wound healing, a comparison of image-based readout methods. BMC Biotechnol. 2004;4:21. doi: 10.1186/1472-6750-4-21. [DOI] [PMC free article] [PubMed] [Google Scholar]
Associated Data
This section collects any data citations, data availability statements, or supplementary materials included in this article.