Abstract
Although Akt is known to play a role in human cancer, the relative contribution of its three isoforms to oncogenesis remains to be determined. We expressed each isoform individually in an Akt1−/−/Akt2−/−/Akt3−/− cell line. MicroRNA profiling of growth factor-stimulated cells revealed unique microRNA signatures for each isoform. Among the differentially-regulated microRNAs, abundance of the miR-200 family was decreased in cells bearing Akt2. Akt1 knockdown in TGFβ-treated MCF10A cells also decreased the abundance of miR-200. However, knockdown of Akt2, or of both Akt1 and Akt2, did not. Furthermore, Akt1 knockdown in the same cells, promoted TGFβ-induced epithelialmesenchymal-transition (EMT) and a stem cell-like phenotype. Carcinomas developing in MMTV-cErbB2/Akt1−/− mice showed increased invasiveness because of miR-200 downregulation. Finally, the ratio of Akt1 to Akt2 and the abundance of miR-200 and of the mRNA encoding E-cadherin in a set of primary and metastatic human breast cancers were consistent with the hypothesis that in many cases, breast cancer metastasis may be under the control of the Akt-miR-200-E-cadherin axis. We conclude that induction of EMT is controlled by microRNAs whose abundance depends on the balance between Akt1 and Akt2, rather than the overall Akt activity.
INTRODUCTION
Akt is a serine-threonine protein kinase that is activated by phosphorylation at two sites (Thr308 and Ser473) through a phosphatidylinositol 3-kinase (PI3K)-dependent process. Specifically, growth factor signals and other stimuli that activate PI3K, promote the accumulation of D3 phosphorylated phosphoinositides, at the plasma membrane. The interaction of these phosphoinositides with the PH domain of Akt, promotes the translocation of the kinase to the plasma membrane, where it undergoes phosphorylation by PI3K-dependent kinase-1 (PDK1) at Thr308, and by mTOR complex-2 (TORC2), at Ser473 (1–3).
Ample evidence links Akt with the induction and progression of human cancer (4). However, there are three Akt isoforms and information regarding their specific oncogenic activities is limited. The Akt1 and Akt2 isoforms appear to play different roles in mammary adenocarcinomas induced in mice by transgenes encoding the oncoproteins polyoma middle T and ErbB2 (also known as Neu), both of which activate the PI3K-Akt pathway. Indeed, ablation of Akt1 inhibits--whereas ablation of Akt2 accelerates--tumor induction and growth by both polyoma middle T and ErbB2 (5, 6). However, the tumors developing in the Akt1 knockout mice are more invasive than the tumors developing in Akt2 knockout and wild type mice (5), suggesting that ablation of Akt1 may also enhance tumor invasiveness, a process separate from and independent of tumor induction and growth (7). These findings were consistent with observations showing that Akt1 knockdown promotes migration and invasiveness of human mammary epithelial cells in culture (8–10), perhaps by promoting epithelial mesenchymal transition (EMT), a process that plays important roles in both development and oncogenesis. During EMT, epithelial cells acquire a mesenchymal phenotype characterized by the loss of intercellular junctions and increased cell migration. On the molecular level, cells undergoing EMT downregulate the expression of epithelial cell-specific proteins, like E-cadherin, and upregulate the expression of mesenchymal cell-specific proteins, like Vimentin. The developmental switch characteristic of EMT, renders tumor cells undergoing this process, more invasive and metastatic. Thus, inhibition of individual Akt isoforms may have both desirable and undesirable effects during oncogenesis. We therefore wished to identify and characterize the downstream targets of Akt isoforms, which may discriminate the beneficial from the detrimental effects of isoform-specific Akt inhibition.
MicroRNAs are a class of molecules that regulate gene expression by a variety of mechanisms and play important roles in oncogenesis (11, 12). Like conventional oncogenes and tumor suppressor genes, microRNAs may either promote or inhibit oncogenesis. Also, like conventional cancer genes, their expression is selectively increased or decreased in various human and animal tumors. The selective deregulation of microRNA gene expression may be due to deletions, amplifications or mutations targeting the microRNAs themselves or their regulatory sequences, as well as to dysregulation of transcription factors, and epigenetic regulators targeting the genes encoding them (13). Understanding the regulation and functional activities of individual microRNA families in cancer and other human diseases could thus lead to new opportunities for therapeutic intervention.
Here, we describe a set of microRNAs that are differentially regulated by the three Akt isoforms in cells stimulated with insulin-like growth factor 1 (IGF1), a treatment that activates Akt. In addition, we show that a decrease in the abundance of the miR-200 microRNA family in cells in which the ratio of Akt1 to Akt2 was decreased, promotes EMT and the acquisition of a stem cell-like phenotype in cultured cells, as well as in mouse and human tumors. Downregulation of the miR-200 microRNA family in these cells appears to depend not on Akt activity per se, but rather on the balance between Akt1 and Akt2.
RESULTS
Akt isoforms have different microRNA gene signatures
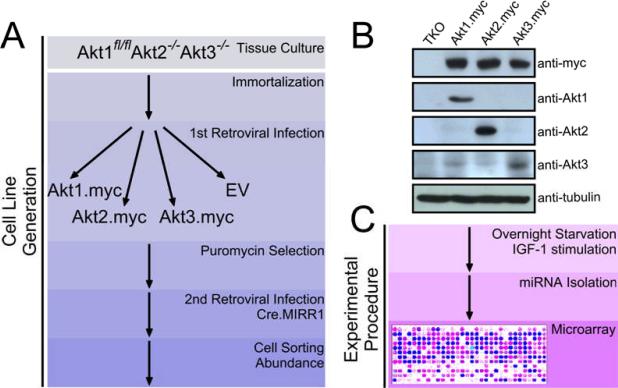
Lung fibroblast and kidney epithelia cells from Akt1fl/fl/Akt2−/−/Akt3−/− mice were immortalized as described in the Materials and methods. The immortalized lung fibroblasts were transduced with myc-tagged Akt1, Akt2, or Akt3 retroviral constructs or with the empty retroviral vector. Knocking out the floxed Akt1 allele in these cells with Cre recombinase gave rise to cell lines that expressed only one of the three Akt isoforms. Knocking out the floxed Akt1 in the vector-transduced cells gave rise to Akt-null cells, which survived for about a week, but failed to proliferate. The abundance of mycAkt1, mycAkt2 and mycAkt3 in cell lines engineered to express a single Akt isoform was similar (Fig 1). Moreover, the abundance of mycAkt1 in these cell lines was about two times higher and the abundance of mycAkt3 three times higher than the abundance of endogenous Akt1 and Akt3 respectively in primary lung fibroblasts. However, the abundance of the individual Akt isoforms in these cell lines never exceeded that of total Akt in the primary cells (fig S1).
Fig. 1.
Strategy for generating lung fibroblasts based on abundance of different Akt isoforms and for the identification of IGF1-induced microRNAs. (A) Cells were transduced to express different Akt isoforms. (B) Western blots of cell lysates were probed with antibody directed against the myc-tag or with antibodies directed against Akt1, Akt2, or Akt3. Tubulin was used as a loading control. (C) Cell lysates harvested before and after IGF1 treatment were screened with a 365 microRNA array.
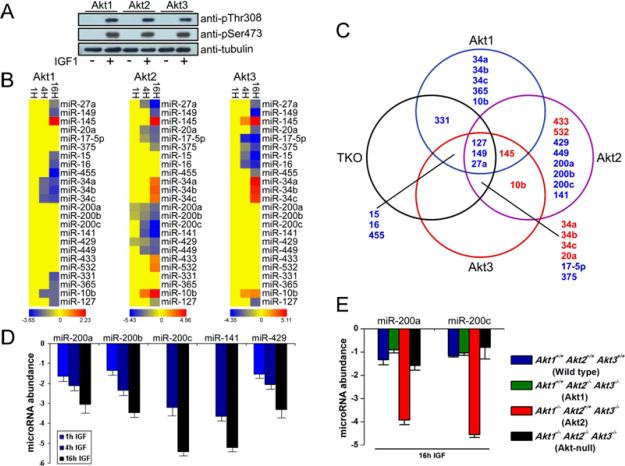
To determine the role of the three Akt isoforms on the abundance of microRNAs, we stimulated Akt-null cells and cells expressing a single Akt isoform, with IGF1 which is known to activate the Akt kinase. Probing whole cell lysates harvested before and after IGF1 stimulation, with phosphospecific antibodies recognizing activated Akt phosphorylated at Thr308 and Ser 473, confirmed that IGF1 activated all three Akt isoforms (Fig 2A). Following confirmation of the activation of Akt, we screened cell lysates harvested before and after IGF1 treatment with a 365 microRNA array. Based on this analysis, we found no differences in microRNA abundance between cells carrying different Akt isoforms under basal conditions; however, IGF1 treatment elicited marked differences in the microRNA signature of the different groups (Fig 2B). In cells with Akt1, IGF1 increased or decreased the abundance of 1 and 12 microRNAs respectively, while in cells with Akt2, it increased or decreased the abundance of 7 and 12 microRNAs respectively; finally, in cells with Akt3, IGF1 increased the abundance of 5 and decreased the abundance of 9 microRNAs (Fig 2B). The abundance of some microRNAs (miR-27a, miR-149 and miR-145) changed in the same direction, but differed quantitatively between IGF1-treated cells expressing different Akt isoforms while the abundance of other microRNAs changed in the opposite direction in the same cells (Fig 2C and fig S2, Table S1 and S2). MicroRNAs whose regulation by different Akt isoforms was qualitatively different included the members of miR-200 microRNA family (miR-200a, miR-200b, miR-200c, miR-141, miR-429), whose abundance was decreased following IGF1 treatment only in Akt2-expressing cells (Fig 2B, C). These microRNAs had been previously clustered in a family because they are coordinately regulated and they share seed sequences and targets (14, 15). We confirmed the differential regulation of the miR-200 microRNA family by the three Akt isoforms by real time reverse transcription polymerase chain reaction (RT-PCR) (Fig 2D and fig S3). The Akt2-specific decrease in miR-200 microRNA family abundance was also apparent in IGF1-treated primary mouse embryonic fibroblasts (Fig 2E), and in IGF1-treated immortalized lung fibroblasts transduced with MigR1-GFP constructs of Akt1, Akt2, or Akt3 (fig S4). A decrease in the abundance of miR-200c and miR-200a was also observed in cells transduced with constitutively active MyrAkt1, MyrAkt2, or MyrAkt3 retroviral constructs where the effects of Akt2 did not require IGF1 (fig S5).
Fig. 2.
Akt isoforms have different microRNA gene signatures. (A) IGF1 treatment induces the phosphorylation of all Akt isoforms at Ser473 and Thr308 (in Akt1 or the equivalent sites in Akt2 and Akt3) in murine lung fibroblasts engineered to express Akt1, Akt2, or Akt3. Following overnight serum starvation, cells were treated with IGF1 (50 ng/ml) for 10 min and cell lysates were analyzed by Western blot. Tubulin was used as a loading control. (B) Heatmap of differentially expressed microRNAs in untreated and IGF1-treated (1, 4, 16h) fibroblasts, carrying individual Akt isoforms. Red indicates upregulation, and blue indicates downregulation. (C) Overlap between the microRNA signatures of IGF1-treated (16h) Akt1, Akt2, Akt3, and TKO fibroblasts. (D) The abundance of miR-200 family members was measured by real time RT-PCR 1, 4 and 16 hours following IGF1 treatment. MicroRNA abundance prior to the IGF1 treatment was set to 0. MiR-200 family members were downregulated following IGF1 treatment only in Akt2-expressing fibroblasts. (E) Downregulation of miR-200a and miR-200c in Akt2-expressing MEFs. The expression of miR-200 family members was measured at 16 hours following IGF1 treatment by real time RT-PCR. The experiments were performed in triplicate and data are presented as mean ± SD.
To determine whether the miR-200 microRNA family also affects Akt activity, we transfected lung fibroblasts containing Akt1, Akt2, or Akt3 with miR-200a, miR-200c, or a control microRNA, and measured the phosphorylation of all Akt isoforms before and 10 minutes after IGF1 stimulation. We found that Akt phosphorylation was not affected by these microRNAs (fig S6).
Akt1 knockdown, but not that of Akt2 or of Akt1 and Akt2, promotes EMT by decreasing the abundance of the miR-200 microRNA family
Previous studies had shown that the microRNAs of the miR-200 family, target the 3' untranslated region (3'UTR), of the mRNAs encoding the helix-loop-helix transcription factors Zeb1 and Zeb2 and inhibit them postranscriptionally. Zeb1 and Zeb2 function as transcriptional repressors of E-cadherin (14, 15). We therefore postulated that knockdown of Akt1, leaving Akt2 and Akt3 intact, may induce EMT in epithelial cells by decreasing the abundance of the miR-200 microRNA family. To address this hypothesis we first examined the effects of Akt1 knockdown on the abundance of the mRNAs encoding Zeb1, Zeb2, and E-cadherin in the mammary epithelia cell line MCF10A. This cell line undergoes EMT following exposure to transforming growth factor β (TGF(16), which activates Akt in both MCF10A cells and murine lung fibroblasts (fig S7).
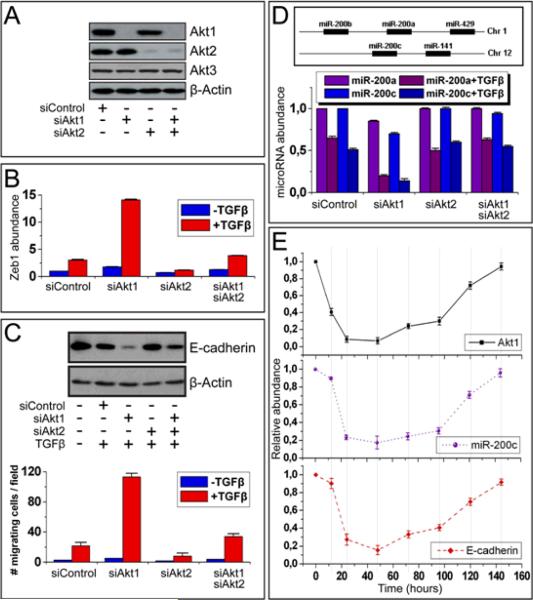
The mRNAs encoding Akt1 and Akt2, which are present in similar abundance in untransfected MCF10A cells (fig S8), were efficiently knocked down by transfection with siRNA directed against Akt1 or Akt2. However, transfection of these siRNAs alone or in combination had no effect on the abundance of the mRNA encoding Akt3 (Fig 3A). Following transfection with these siRNAs, the cells were analyzed for the abundance of Zeb1, Zeb2, and E-cadherin, before and 24 hours after treatment with TGFβ. The knockdown of Akt1, but not that of Akt2, synergized with TGFβ to increase the abundance of the mRNAs encoding Zeb1 and Zeb2 and decrease the abundance of E-cadherin at both the mRNA and protein levels. Moreover, knocking down Akt2 together with Akt1 attenuated the effects of Akt1 knockdown on the abundance of Zeb1, Zeb2, and E-cadherin (Fig 3B, C and fig S9). EMT also promotes cell migration. We therefore used parallel cultures of similarly treated cells to measured cell migration by means of a transwell cell migration assay. These experiments showed that TGFβ enhanced the migration of untransfected and Akt1 siRNA-transfected MCF10A cells by 7.7 times and 22 times respectively (P=0.00015 compared to the control siRNA transfected cells treated with TGFβ) and the migration of cells transfected with both Akt1 and Akt2 siRNAs by 3 times (P=0.05 compared to the control siRNA transfected cells treated with TGFβ) (Fig 3C, Lower panel). Cell migration therefore exhibited an inverse correlation with the abundance of E-cadherin in MCF10A cells, as expected. The knockdown of Akt1, but not that of Akt2 or of Akt1 plus Akt2, also enhanced migration in the absence of TGFβ, in MCF10A cells (P=0.00046) (Fig 3C, Lower panel) and in the breast cancer cell lines MCF-7 and BT474 (fig S10).
Fig. 3.
Knockdown of Akt1 promotes EMT by decreasing abundance of the miR-200 microRNA family. (A) Knockdown of Akt1 and Akt2 in MCF10A cells. Western blots of cell lysates after transfection of Akt1, Akt2, or Akt1 and Akt2 siRNAs probed with the indicated antibodies. (B) TGFβ synergizes with Akt1 knockdown to increase Zeb1 abundance. Zeb1 abundance measured by real-time PCR in cells transfected with the indicated siRNAs and treated with TGFβ. (C) Akt1 knockdown promotes EMT. (Upper panel) The knockdown synergizes with TGFβ to decrease E-cadherin abundance. Lysates of cells, transfected with the indicated siRNAs and treated with TGFβ, probed with anti-E-cadherin and anti-β-actin antibodies. (Lower panel). The knockdown synergizes with TGFβ to stimulate cell migration. Cell migration of TGFβ-stimulated cells transfected with the indicated siRNAs. (D) (Upper panel). Chromosomal map of the miR-200 microRNA family. (Lower panel). The knockdown synergizes with TGFβ to decrease abundance of miR-200a and miR-200c. MicroRNA abundance was measured by real-time PCR. (E) The abundance of miR-200c, and the mRNA encoding E-cadherin in cells transfected with Akt1 siRNA, returned to pretransfection values as the effect of the siRNA on Akt1 abundance wane. Time course analysis by real-time RT-PCR in cells transfected with Akt1 siRNA, treated with TGFβ.
The increase in the abundance of Zeb1 and Zeb2 in MCF10A cells in which Akt1 was knocked down may be due to a decrease in the abundance of the miR-200 microRNA family (Fig 3D, upper panel and fig S11) (14, 15). We indeed showed that both the knockdown of Akt1 and TGFβ treatment decreased the abundance of this microRNA family and that, when combined, the knockdown of Akt1 and TGFβ acted synergistically to decrease the abundance of these microRNAs (Fig 3D, Lower panel and fig S12). To determine the specificity of the effects of Akt1 knockdown, MCF10A cells transfected with Akt1 siRNA were treated with TGFβ and monitored for six days after transfection. As the effects of the Akt1 siRNA waned and Akt1 mRNA returned to its pre-transfection value, miR-200a, miR-200c and the mRNAs encoding Zeb1, Zeb2, and E-cadherin also returned to their pre-transfection values (Fig 3E and fig S13). The preceding data combined suggest that changes in the relative abundance of Akt1 and Akt2 that favor Akt2 promote downregulation of the miR-200 microRNA family in both fibroblasts and epithelial cells.
Overexpression of miR-200a and miR-200c inhibits the effects of TGFβ and Akt1 knockdown on Zeb1, Zeb2, and E-cadherin abundance and on cell migration
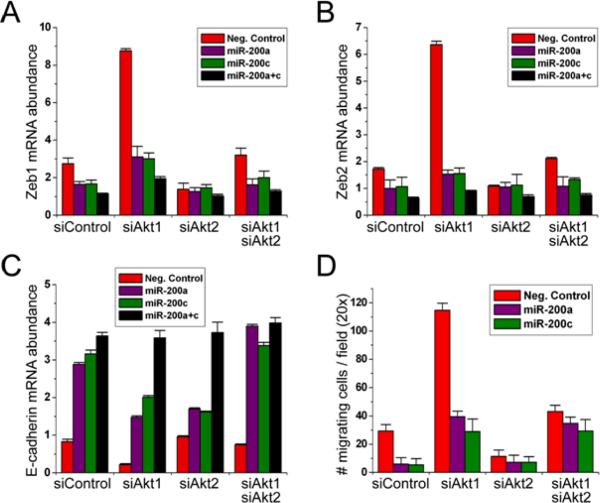
To determine whether the decrease in the abundance of miR-200 microRNAs produced by TGFβ and by the knockdown of Akt1 could mediate the observed changes in the abundance of Zeb1, Zeb2, and E-cadherin, we transfected MCF10A cells with miR-200a, miR-200c, or both miR-200a and miR-200c, and examined the abundance of Zeb1 and Zeb2 mRNA 24 hours later. We found that both microRNAs, alone or combined, decreased the abundance of the mRNAs encoding Zeb1 and Zeb2 in cells treated with either TGFβ alone, or with TGFβ, in combination with Akt1 siRNA (Fig 4A and B). MCF10A cells transfected with the combination of miR-200a and miR-200c failed to show a decrease in E-cadherin following treatment with TGFβ and Akt1 siRNA (Fig 4C). Furthermore transfection with miR-200a or miR-200c blocked the increase in migration produced by treatment with TGFβ and Akt1 siRNA (Fig 4D). Together, these data indicate that Akt1 knockdown increases the abundance of Zeb1 and Zeb2 and promotes EMT by decreasing the abundance of the miR-200 microRNA family.
Fig. 4.
Overexpression of miR-200a, miR-200c, and miR-200a plus miR-200c blocks the upregulation of Zeb1 in MCF10A cells transfected with Akt1 siRNA and treated with TGFβ. (A) and (B) Overexpression of miR-200a or miR-200c inhibits the upregulation of Zeb1 and Zeb2 in MCF10A cells transfected with Akt1 siRNA and treated with TGF (C) Overexpression of miR-200a or miR-200c inhibits the downregulation of E-cadherin in MCF10A cells transfected with Akt1 siRNA and treated with TGF Abundance of the mRNAs encoding Zeb1, Zeb2, and E-cadherin was measured by real-time PCR in lysates of TGFβ-treated MCF10A cells transfected with the indicated siRNAs. (D) Overexpression of miR-200a or miR-200c inhibits cell migration in MCF10A cells transfected with Akt1 siRNA and treated with TGF Cell migration was measured in TGFβ-stimulated MCF10A cells 24h after transfection with the indicated siRNAs. Experiments were performed in triplicate and data are presented as mean ± SD.
TGFβ and Akt1 siRNA-treated cells, undergoing EMT through a decrease in the abundance of miR-200 show a cancer stem-cell-like phenotype
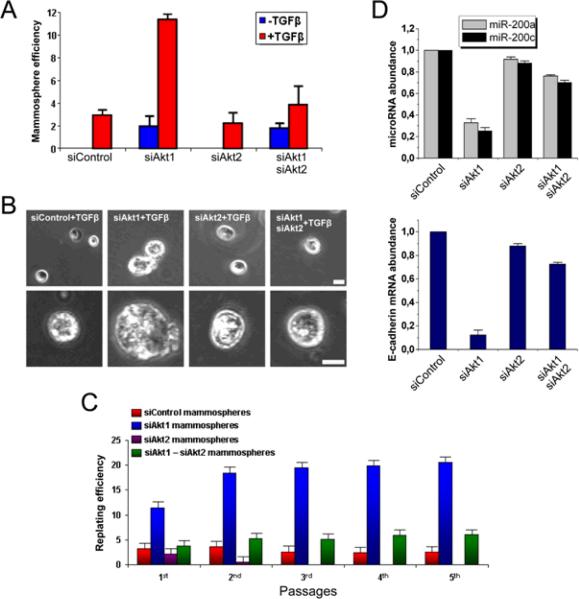
Metastases can arise when invasive cancer cells that travel to new sites act as tumor initiating cells or cancer stem cells (7). We found that the knockdown of Akt1, but not that of Akt2, promoted formation of mammospheres—three-dimensional structures formed by breast cancer stem cells grown in suspension (17)--by MCF10A cells (Fig 5B). Furthermore, Akt1 knockdown synergized with TGFβ in promoting mammosphere formation (Fig 5A, B). Akt1 and Akt2 knockdown in MCF10A cells did not affect the abundance of the mRNAs encoding the non-targeted isoforms and persisted for more than 6 days following siRNA transfection (fig S14). Mammospheres in the Akt1 siRNA-treated cultures were larger than those in cultures treated with control siRNA; in addition, they showed higher replating potential and decreased abundance of miR-200a, miR-200c, and the mRNA encoding E-cadherin (Fig 5B–D). In the same mammospheres, the abundance of E-cadherin mRNA progressively decreased and the abundance of Vimentin mRNA progressively increased over a six day period (fig S15). Thus, Akt1 knockdown elicits a cancer stem cell-like phenotype, an observation consistent with the hypothesis that cells undergoing EMT acquire cancer stem cell properties (18). Thus, our data indicate that a decrease in miR-200 abundance following a shift in the balance between Akt1 and Akt2 promotes a cancer stem cell-like phenotype.
Fig. 5.
Cells undergoing EMT through miR-200 downregulation, in response to TGFβ treatment and Akt1 knockdown, exhibit stem cell properties. (A) MCF10A cells transfected with control siRNA or siRNAs for Akt1, Akt2, or Akt1 and Akt2, were cultured for 6 days in suspension in the presence or absence of recombinant TGFβ (20 ng/ml). The bar graph shows the number of mammospheres per 1000 plated cells in each culture (mean ± SD) at the end of the experiment. (B) Phase-contrast images (low and high magnification) of mammospheres described in (A). Bar, 100 μm. (C) Replating efficiency of mammospheres derived from MCF10A cultures transfected with siRNA control, and siRNAs for Akt1, Akt2, and Akt1 plus Akt2. (D) Primary mammospheres of MCF10A cells transfected with Akt1 siRNA have less miR-200a, miR-200c, and E-cadherin than do MCF10A cells transfected with control, Akt2, or Akt1 plus Akt2 siRNAs. MicroRNA and E-cadherin expression were measured in six day mammospheres by real time RT-PCR. Experiments were performed in triplicate, and data are presented as mean ± SD.
Mammary adenocarcinomas in MMTV-ErbB2/Akt1−/− mice have low abundance of all microRNAs of the miR-200 family, high abundance of Zeb1 and low abundance of E-cadherin
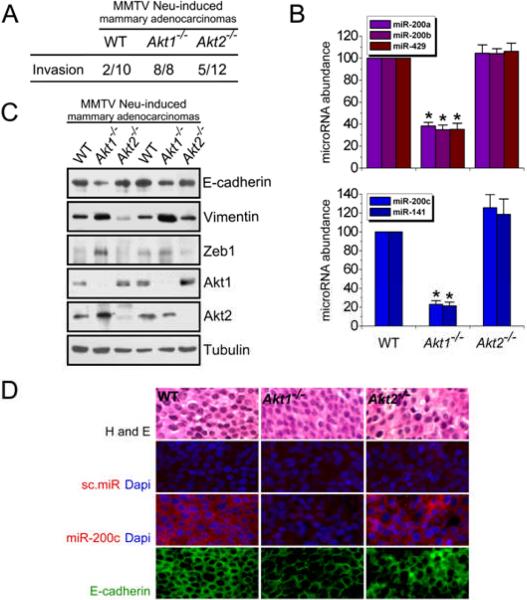
Expression of either Neu or PyMT in the mammary gland of transgenic mice from mouse mammary tumor virus long terminal repeat (MMTV LTR)-driven transgenes causes mammary adenocarcinomas. Mammary adenocarcinomas that develop in MMTV-cErbB2/Akt1−/− mice were more invasive than those arising in MMTV-cErbB2/Akt1+/+ mice, as determined by histological examination of the tumors; moreover, MMTV-cErbB2/Akt1−/− tumors may have a greater potential for metastasis (5). We confirmed the increased invasiveness of MMTV-cErbB2/Akt1−/− tumors compared to MMTV-cErbB2/Akt1+/+ tumors (Fig 6A) and also found that ablation of Akt1 correlated with decreased abundance of the miR-200 microRNAs, as determined by real time RT-PCR and in situ hybridization (Fig 6B, D and fig S16). Loss of Akt1 in these tumors was also associated with an increase in the abundance of Zeb1 and Vimentin and a decrease in that of E-cadherin, as determined by Western analysis (Fig 6C and fig S17) and immunofluorescence (Fig 6D).
Fig. 6.
Mammary adenocarcinomas developing in MMTV-cErbB2/Akt1−/− mice have low amounts of microRNAs of the miR-200 family, high amounts of Zeb1 and low amounts of E-cadherin. (A) Mammary adenocarcinomas developing in MMTV-cErbB2/Akt1−/− mice are more invasive than mammary adenocarcinomas arising in MMTV-cErbB2/WT and MMTV-cErbB2/Akt2−/− mice. (B) MMTV-cErbB2/Akt1−/− mammary adenocarcinomas have lower levels of miR-200 microRNAs than do mammary adenocarcinomas developing in MMTV-cErbB2/Akt1+/+ and MMTV-cErbB2/Akt2−/− mice. MicroRNA abundance was measured by real time RT-PCR. (C) MMTV-cErbB2/Akt1−/− mammary adenocarcinomas have more abundant Zeb1 and Vimentin and less abundant E-cadherin than do mammary adenocarcinomas developing in MMTV-cErbB2/Akt1+/+ and MMTV-cErbB2/Akt2−/− mice. Western blots of primary tumor cell lysates were probed with the indicated antibodies. (D) In situ hybridization (for microRNA) and immunofluorescence (for E-cadherin) confirmed that MMTV-cErbB2/Akt1−/− mammary adenocarcinomas express low levels of miR-200 family members and E-cadherin (microphotographs at 40× magnification). Bar, 10μm.
The Akt-miR-200-E-cadherin axis contributes to the metastatic phenotype of human mammary adenocarcinomas
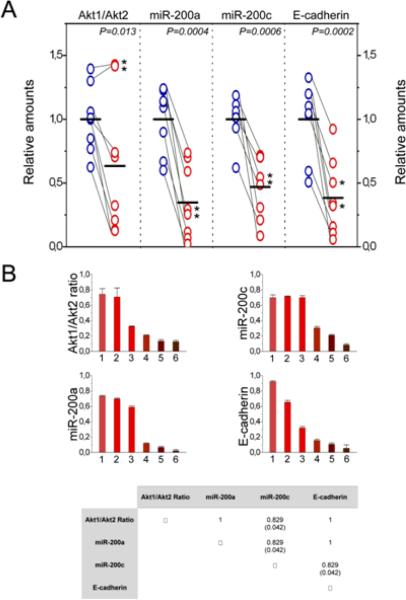
We used real time RT-PCR to evaluate the abundance of miR-200a, miR-200c, and the mRNAs encoding Akt1, Akt2, and E-cadherin in primary and metastatic tumor tissue from eight patients with breast cancer. The ratio of Akt1 to Akt2 was lower in metastatic than primary tumor tissue in all but two cases, in which this ratio was high in both the primary and metastatic tissue. The abundance of miR-200a, miR-200c, and the mRNA encoding E-cadherin was significantly lower in the metastatic tumors (Fig 7A). These data suggest that decreased abundance of the miR-200 microRNA family and of E-cadherin are common features of metastatic human breast cancer and that this decrease may be associated with a decrease in the ratio of Akt1 to Akt2. We plotted the values of Akt1/Akt2, miR-200a, miR-200c, and E-cadherin for all six metastatic tumors in which the Akt1/Akt2 ratio was low and found an excellent correlation between these values, which we confirmed by the Spearman rank correlation statistical test (Fig 7B). These data suggest that, breast cancer metastasis may frequently depend on signaling through the Akt-miR-200-E-cadherin axis. Given that the ratio of Akt1 to Akt2 was low in some primary tumors, it would be interesting to determine whether a low Akt1 to Akt2 ratio has prognostic value for predicting metastasis.
Fig. 7.
The Akt-miR-200-E-cadherin axis contributes to the metastatic phenotype in the majority of human mammary adenocarcinomas. (A) The abundance of Akt1, Akt2 and E-cadherin mRNAs and microRNAs were measured by real-time RT-PCR in primary and metastatic tumors. The data represent triplicate measurements from each RNA sample normalized to GAPDH. Grey lines connect each primary tumor with the corresponding metastatic tumor. Asterisks are used to mark two cases in which the ratio of Akt1 to Akt2 remained high in the metastatic tumor sample despite the fact that miR-200 and E-cadherin levels were lower than in the primary tumor samples from the same patients. The indicated P value (P= 0.013) was calculated with all tumors included. P values were calculated using a paired two population Student's t-test. The mean value for each set is shown as a horizontal black line. (B) Plotting the Akt1/Akt2 ratio and the expression of miR-200a, miR-200c and E-cadherin in the six metastatic tumor samples characterized by low Akt1/Akt2 ratios (see A) revealed an excellent correlation between these parameters. Spearman rank correlation coefficients and the P values in parentheses are shown (lower panel).
DISCUSSION
Here, we show that, following ablation of the floxed Akt1 allele, spontaneously immortalized Akt1fl/fl/Akt2−/−/Akt3−/− lung fibroblasts survived for about a week but failed to proliferate. Cells reconstituted with any of the three Akt isoforms survived and proliferated, suggesting that Akt1, Akt2, and Akt3 overlap functionally. However, comparison of cells reconstituted with Akt1, Akt2, or Akt3 also revealed functional differences. In this report we presented evidence for marked differences in microRNA signature between IGF1- or TGFβ-treated cells expressing different Akt isoforms. In addition, we showed that the stimulation of cell migration induced by the knockdown of Akt1 but not Akt2 in cultured cells, and the invasive phenotype induced by the ablation of Akt1, but not Akt2 in primary tumors, are due to the differential effects of Akt1 and Akt2 on the abundance of the miR-200 microRNA family. These data suggest that the invasiveness and metastatic potential of human carcinomas may depend not on the expression and activity of Akt but on the balance between Akt1 and Akt2. A shift in the relative abundance or activity of Akt1 and Akt2 will alter the abundance of members of the miR-200 microRNA family and, consequently, the invasiveness and oncogenic potential of human tumors. Such a shift may occur naturally (19) or it may be elicited by Akt inhibitors that preferentially target Akt1 rather than Akt2. Our data suggest that we may be able to harness the beneficial effects of Akt1 inhibition, while preventing its unwanted effects on tumor cell invasiveness and metastasis, by combining Akt1 inhibition with delivery of microRNAs of the miR-200 microRNA family.
The regulation of the miR-200 microRNA family, through the concerted action of Akt1 and Akt2, appears to depend on the crosstalk between the two Akt isoforms (See model in Fig 8). This model was based on the finding that Akt2, in the absence of Akt1, decreased the abundance of the miR-200 microRNA family and that Akt1 attenuated the Akt2-mediated decrease in the abundance of these microRNAs; however Akt1 had no Akt2-independent effects on miR-200 family abundance. Based on these observations, we propose that Akt1 may regulate Akt2 or it may interfere with the Akt2-mediated decrease in miR-200 microRNA abundance downstream of Akt2. In either case, the role of Akt1 in miR-200 regulation appears to be Akt2-dependent.
Fig. 8.
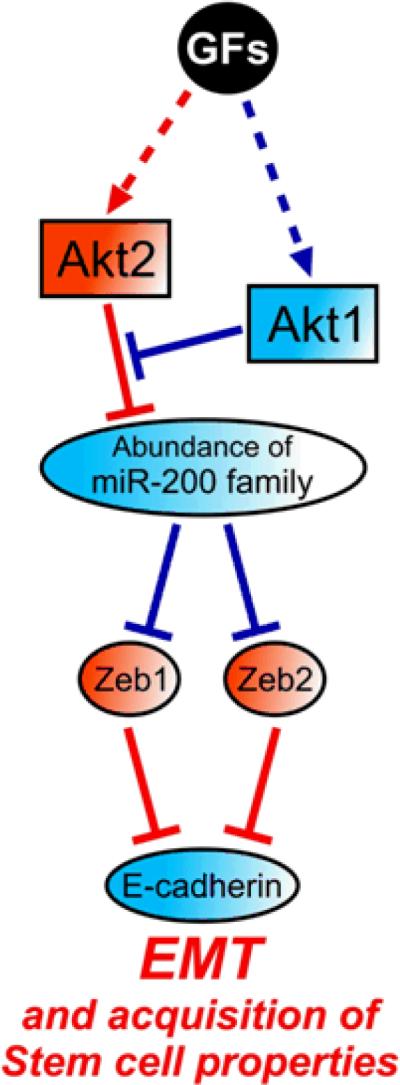
Schematic diagram of the proposed model: The imbalance between Akt1 and Akt2 dysregulates microRNAs that control EMT and stem cell renewal programs. Red indicates a positive and blue indicates a negative role in the development of EMT. GFs, growth factors.
Based on our current understanding of the biology of human cancer, Akt has been considered a high-priority therapeutic target (20). Pharmacological inhibitors for Akt, some of which are being evaluated in clinical trials (21, 22), may differ with regard to their relative activities against Akt isoforms. Indeed, selective inhibition of Akt isoforms may be associated with lower toxicity (23). However, the data presented in this report suggest that preferential activity of a given compound against Akt1 or Akt2 may also have disadvantages. Given that tumors developing in the Akt1−/− genetic background grow slower than tumors developing in the wild type and Akt2−/− genetic backgrounds, it is possible that an inhibitor that targets primarily Akt1 may cause cancer remission. However, if the tumor relapses, the tumor cells emerging following relapse may be significantly more aggressive, invasive and metastatic. On the other hand, an inhibitor that targets primarily Akt2 may be ineffective. It is therefore important to test existing and future Akt inhibitors pre-clinically, for potential differences in their ability to target Akt1, Akt2 and Akt3. Prior information regarding the sensitivity of the three Akt isoforms to a given inhibitor may allow us to design therapeutic strategies that maximize tumor responsiveness and prevent the unwanted selection of invasive and metastatic tumor cells. This report introduces a platform for the preclinical testing of the specificity of Akt inhibitors toward the three Akt isoforms.
In summary, the data presented in this report show that the balance between Akt1 and Akt2 is critical to the regulation of microRNA gene expression and that the opposing roles of Akt1 and Akt2 on the induction of EMT are due to the differential effects of the two Akt isoforms on the expression of the miR-200 microRNA family.
MATERIALS AND METHODS
Cell culture, constructs and retroviral infections
Mouse lung fibroblasts from Akt1fl/fl/Akt2−/−/Akt3−/− mice were cultured in DMEM supplemented with 10% fetal bovine serum (FBS), penicillin and streptomycin, sodium pyruvate, nonessential amino acids and glutamine. Passage of these cells every three to four days led to the establishment of spontaneously immortalized cell lines (24). Established cell lines were cultured in the same medium, under standard culture conditions.
Wild-type Akt1, Akt2, and Akt3, tagged with the myc epitope at their C-terminus, were cloned in the retroviral vector pBabe-puro. Retrovirus constructs were packaged in 293T cells transiently transfected with these constructs and with an ecotropic virus Env construct. Immortalized lung fibroblasts were infected with the packaged viruses as follows: Cells were pre-treated with DEAE dextran (25 μg/ml). Forty five minutes later, they were washed and infected. Infected cells were selected for puromycin (Sigma) resistance (2 μg/ml). Cells generated from three independent infections for each retroviral construct, were analyzed for Akt expression by probing their lysates with anti-myc (#2276) and anti-Akt1 (#2938), anti-Akt2 (#2964) and anti-Akt3-specific antibodies (#3788, Cell Signalling Technologies). To abolish the expression of endogenous Akt1, cells were super-infected with a MigR1-GFP-based construct of the Cre recombinase and were sorted 48 hours later. To avoid puromycin selection, Akt1fl/fl/Akt2−/−/Akt3−/− lung fibroblasts, were alternatively transduced with myc.Akt1, myc.Akt2, or myc.Akt3, in the retroviral vector MigR1-GFP, and cells transduced with the respective viruses were super-infected with a MigR1-RFP-based construct of the Cre recombinase. Ablation of endogenous Akt1 by Cre gave rise to Akt-null cells (TKO) or triple Akt knockout cells expressing a single Akt isoform at a time. In another set of experiments, we transduced the same lung fibroblast cell line with myrAkt1, myrAkt2, or myrAkt3, tagged with the HA epitope.
To determine whether the effects of individual Akt isoforms on regulating miR-200 family also occurs in primary MEFs, we carried out experiments using MEFs from wild type, Akt1fl/fl/Akt2+/+/Akt3−/−, Akt1+/+/Akt2−/−/Akt3−/−, and Akt1fl/fl/Akt2−/−/Akt3−/− mice. To knock out the endogenous floxed Akt1 allele we transduced with a MigR1-GFP-Cre construct.
MCF10A mammary epithelial cells were grown in DMEM/F12 medium supplemented with 5% donor horse serum (HS), 20 ng/ml epidermal growth factor (EGF), 10 μg/ml insulin, 100 μg/ml hydrocortisone, 1 ng/ml cholera toxin and 50 units/ml penicillin and streptomycin.
Human breast cancer samples
RNAs from 8 primary tumors and their corresponding metastatic tumors were purchased from Biochain Inc, CA. These samples were used for real-time RT-PCR for E-cadherin, miR-200a, miR-200b, Akt1 and Akt2. GAPDH expression levels were used as a loading control.
MicroRNA Expression Analysis
The abundance of 365 microRNAs was evaluated using TaqMan Low Density Arrays (TLDA) microRNA v1.0 arrays (Applied Biosystems). Cells were serum-starved overnight. Sixteen hours later, they were stimulated with IGF1 (50 ng/ml) and they were harvested 1, 4 and 16 hours later. Differentially expressed microRNAs were clustered using hierarchical clustering analysis. Changes in microRNA abundance were illustrated using heatmaps. Blue color represents down-regulation while red color represents upregulation of a given microRNA in IGF1-treated fibroblasts.
MicroRNA Real-time PCR Analysis
Validation of microRNA array data was performed using the mirVana qRT–PCR miRNA Detection Kit and qRT–PCR Primer Sets, according to the manufacturer's instructions (Ambion Inc, TX, USA). The expression of RNU48 and RNU44 was used as internal control. Real-time RT-PCR analysis was also performed to determine the abundance of miR-200a, miR-200b, miR-200c, miR-141 and miR-429 in MCF10A cells transfected with a with a negative control siRNA designed to have no sequence similarity to any human transcript sequence (#AM4611) or siRNAs against Akt1 (#S660) or Akt2 (#S1216, Ambion Inc), or both, and treated with TGFβ (20 ng/ml) for 24 hours. The abundance of these microRNAs was also normalized to RNU48 and RNU44 expression (internal controls). Data in Figure 2D and E show the relative abundance of miR-200 family members at different time points following IGF1 treatment. Their abundance prior to treatment was set at 0. Figure 3D shows the relative abundance of miR-200 family members in MCF10A cells treated with siRNAs directed against Akt1 or Akt2, and TGFβ. Here, microRNA abundance in cells transfected with the control siRNA and not treated with TGFβ was set at 1.
Real-time PCR Analysis
Total RNA was extracted using Trizol (Invitrogen), according to the manufacturer's instructions. Complementary DNA (cDNA) was synthesized from 2.0 μg of total RNA by random priming, using the Omniscript reverse transcription kit (Qiagen). Real-time PCR was performed in triplicate using the Quantitect SyBr green PCR system (Qiagen) on a Rotorgene 6000 series PCR machine (Corbett Research). All mRNA quantification data were normalized to β-actin, which was used as an internal control. The following primer sets were used: (for Zeb1) 5'-TTCAAACCCATAGTGGTTGCT-3' (forward) and 5'-TGGGAGATACCAAACCAACTG-3' (reverse); (for Zeb2) 5'-CAAGAGGCGCAAACAAGC-3' (forward) and 5'-GGTTGGCAATACCGTCATCC-3' (reverse); (for E-cadherin) 5'-TGCCCAGAAAATGAAAAAGG-3' (forward) and 5'-CTGGGGTATTGGGGGCATC-3' (reverse), (for Vimentin) 5'-GAGAACTTTGCCGTTGAAGC-3' (forward) and 5'-CTAACGGTGGATGTCCTTCG-3' (reverse) and (for Akt1/2) 5'-CTTCGAGCTCATCCTCATGG-3' (forward) and 5'-TCTGCTTGGGGTCCTTCTTA-3' (reverse).
Western Blot Analysis
Fibroblasts were lysed on ice, using a Triton X-100 lysis buffer (50 mM Tris, pH 7.5, 150 mM NaCl, 1 mM EDTA, 1mM EGTA, 1% Triton X-100, 2.5 mM sodium orthovanadate, 1 mM phenylmethylsulfonyl fluoride, 50 mM NaF, 10 μg/ml leupeptin, and 5 μg/ml aprotinin). Twenty □g of total protein from each sample were resolved in a 10% SDS-PAGE and transferred to PVDF membranes. The blots were then probed with anti-phospho-Akt (Ser473 and Thr308) (# 9271 and # 9275, Cell Signaling Technologies) and anti-tubulin (T5168, Sigma) antibodies.
Transfected MCF10A cells were lysed on ice, using an NP-40 lysis buffer (50 mM Tris, pH 7.5, 150 mM NaCl, and 0.5% NP-40). Fifty □g of total protein from each sample was resolved in a 4%–12% Bis-Tris Gel with MOPs running buffer and transferred to PVDF membranes. The blots were then probed with antibodies against E-cadherin (610404, BD Biosciences) and β-actin (ab8227, Abcam Inc).
Transwell Migration Assay
Transwell migration assays were performed as described previously (8). Briefly, MCF10A cells were transfected with a negative control siRNA designed to have no sequence similarity to any human transcript sequence (#AM4611, Ambion) or siRNAs for Akt1 (#S660) or Akt2 (#S1216), or siRNAs for both Akt1 and Akt2 (50 nM). 24 hours after transfection, they were cultured overnight in assay medium (MCF10A growth medium containing 2% serum ± 20 ng/mL TGFβ). Sixteen hours later, cells were trypsinized and 105 cells were added to the top chambers of 24-well transwell plates (8 μm pore size; BD Bioscience, Bedford, MA). The bottom chambers were filled with assay medium. After overnight incubation, the migratory cells were fixed and stained with 0.1% crystal violet. The significance of variability between a given group and its corresponding control was determined with the unpaired t test.
Mammosphere Culture
MCF10A cells were transfected with a control siRNA, or siRNAs for Akt1 or Akt2 or siRNAs for both Akt1 and Akt2 (150 nM). Twenty four hours later, cells were cultured in suspension in low-attachment plates (Corning) (1000 cells/ml), in serum-free DMEM/F12 media, supplemented with B27 (1:50, Invitrogen), 0.4% BSA, 20ng/ml EGF (Sigma), 4μg/ml insulin (Sigma) and 1% methyl cellulose to prevent cell aggregation, in the presence or absence of TGF-β (20ng/ml). Mammospheres with a diameter of >75μm were counted 6 days later. To propagate mammospheres in vitro, mammospheres were collected by gentle centrifugation and dissociated to single cells as described (17). Prior to replating, mammosphere-derived cells were re-transfected with 150 nM of the corresponding siRNAs (control, Akt1, Akt2, or both Akt1 and Akt2). Replating potential describes the ability of single cells to form new mammospheres when cultured in new vessels.
Mouse Experiments
The establishment of homozygous MMTV Neu transgenic mice in the WT, Akt1−/− and Akt2−/− genetic backgrounds, was previously described (5). Tissues were paraffin embedded, sectioned, and stained with Hematoxylin and Eosin. Histologic sections were blindly analysed. Invasive tumors were evidenced by infiltrative tumor foci in distinction from encapsulated tumor borders. The code was broken only when all the data were compiled.
Protein and RNA isolation were performed using the mirVana PARIS Kit, according to the manufacturer's instructions (Ambion). Protein extracts were analyzed by Western Blot for E-cadherin (#3195, Cell Signaling Technologies), Vimentin (sc-7558) and Zeb1 (sc-10572, Santa Cruz Biotechnology).
In situ microRNA hybridization
For in situ hybridization, Mircury LNA Detection probes 3'-end labeled with DIG for mmu-miR-200c (39549-05) or scramble-miR (99004-05, Exiqon) were used as previously described (25) with modifications. 5 μm-thin sections of FFPE Neu/WT, Neu/Akt1−/− and Neu/Akt2−/− tumors were deparaffinized in xylene, 2×40 min on a 50 rpm shaker, followed by 5 min each in serial dilution of ethanol (100%, 100%, 75%, 50% and 25%), followed by 2 changes of DEPC-ddH2O. Slides were then submerged for 5 min in 0.2 N HCl, washed with DEPC-PBS, digested with proteinase K (40 μg/ml) for 20 min at 25°C, rinsed in 0.2% glycine/DEPC-PBS, 3XDEPC-PBS, and postfixed with 4% formaldehyde in PBS for 10 min. Slides were then rinsed twice with DEPC-PBS, treated with acetylation buffer (300 μl acetic anhydride, 670 μl triethanolamine, 250 μl of 12 N HCl per 48 ml ddH2O) and then rinsed 4 times in DEPC-PBS followed by 2 rinses in 5xSSC. Slides were pre-hybridized at 53°C for 2 hrs in hybridization buffer (50% formamide, 5xSSC, 0.1% Tween-20, adjusted to pH 6.0 with 9.2 mM citric acid, 50 μg/ml heparin, 500 μg/ml yeast tRNA) in a humidified chamber (50% formamide, 5xSSC). Following pre-hybridization, slides were hybridized overnight at 53°C in a humidified chamber, using 20 nM of probe in pre-warmed hybridization buffer. Sections were rinsed twice in 5xSSC, followed by 3 washes of 20 min at 53°C in 50% formamide/2xSSC. Sections were then rinsed 5 times in PBS/0.1% Tween-20 (PBST), and blocked for 1 hr in blocking solution (2% sheep serum, 2 mg/ml BSA in PBST). Anti-DIG-AP Fab fragments antibody (11093274910, Roche) was applied on sections overnight at 4°C. Next, slides were washed 2 times, in PBST for 10 min each and washed 3 times for 10 min each in 0.1 M Tris-HCl pH 7.5/0.15 M NaCl, followed by equilibration with 1 M Tris pH 8.2 for 10 min and the Fast Red (Roche) solution (1 tablet per 2ml of 0.1 M Tris-HCl pH 8.2). Following incubation for 30 min in the dark, slides were washed 3 times in PBST for 10 min and coverslipped in Vectashield mounting medium with Dapi (Vector Labs).
Sections of the tumors were deparaffinized in xylene, 3×5 min, followed by 10 min each in serial dilution of ethanol (100%, 100%, 95% and 95%) and followed by 2 changes of ddH2O. Antigen unmasking was achieved by boiling the slides (95–99°C) for 10 min, in 10 mM sodium citrate buffer pH 6.0. Sections were then rinsed 3 times in ddH2O, 1 time in PBS, and blocked for 1 hr in blocking solution (5% goat serum, 300 μl Triton-X 100 in 100 ml PBS). E-cadherin antibody was diluted (1:200) and applied on sections overnight at 4°C. Next, slides were washed 3 times, in PBS for 5 min each, and incubated with Cy2-conjugated anti-goat antibody diluted 1:500 for 1 hr at room temperature in the dark. Slides were washed 3 times, in PBS for 5 min each, and coverslipped in Vectashield mounting medium with Dapi.
Images were obtained using a Nikon Eclipse 80i microscope and a Spot charge-coupled device camera (Diagnostic Instruments). All photographs were processed using identical settings for capturing and further processing.
Supplementary Material
Acknowledgments
We wish to thank Dr Norma Terrin for help with the statistical analyses and Drs Phil Hinds, Charlotte Kuperwasser and Alain Charest of the Molecular Oncology Research Institute, Tufts Medical Center, for helpful discussions and for reviewing the manuscript. This work was supported by NIH grants NIH R01CA57436 (P.N.T) and R01CA107486 (K.S.), and a pilot project grant from the Tufts Medical Center Cancer Center (P.N.T). C.P. is a Fellow of the Leukemia and Lymphoma Society.
REFERENCES and Notes
- 1.Bellacosa A, Testa JR, Staal SP, Tsichlis PN. A retroviral oncogene, akt, encoding a serine-threonine kinase containing an SH2-like region. Science. 1991;5029:274–277. doi: 10.1126/science.254.5029.274. [DOI] [PubMed] [Google Scholar]
- 2.Franke TF, Yang SI, Chan TO, Datta K, Kazlauskas A, Morrison DK, Kaplan DR, Tsichlis PN. The protein kinase encoded by the Akt protooncogene is a target of the PDGF-activated phosphatidylinositol 3-kinase. Cell. 1995;5:727–736. doi: 10.1016/0092-8674(95)90534-0. [DOI] [PubMed] [Google Scholar]
- 3.Manning BD, Cantley LC. AKT/PKB signaling: navigating downstream. Cell. 2007;7:1261–1274. doi: 10.1016/j.cell.2007.06.009. [DOI] [PMC free article] [PubMed] [Google Scholar]
- 4.Altomare DA, Testa JR. Perturbations of the AKT signaling pathway in human cancer. Oncogene. 2005;50:7455–7464. doi: 10.1038/sj.onc.1209085. [DOI] [PubMed] [Google Scholar]
- 5.Maroulakou IG, Oemler W, Naber SP, Tsichlis PN. Akt1 ablation inhibits, whereas Akt2 ablation accelerates, the development of mammary adenocarcinomas in mouse mammary tumor virus (MMTV)-ErbB2/neu and MMTV-polyoma middle T transgenic mice. Cancer Res. 2007;1:167–177. doi: 10.1158/0008-5472.CAN-06-3782. [DOI] [PubMed] [Google Scholar]
- 6.Ju X, Katiyar S, Wang C, Liu M, Jiao X, Li S, Zhou J, Turner J, Lisanti MP, Russell RG, Mueller SC, Ojeifo J, Chen WS, Hay N, Pestell RG. Akt1 governs breast cancer progression in vivo. Proc Natl Acad Sci U S A. 2007;18:7438–7443. doi: 10.1073/pnas.0605874104. [DOI] [PMC free article] [PubMed] [Google Scholar]
- 7.Chiang AC, Massague J. Molecular basis of metastasis. N Engl J Med. 2008;26:2814–2823. doi: 10.1056/NEJMra0805239. [DOI] [PMC free article] [PubMed] [Google Scholar]
- 8.Irie HY, Pearline RV, Grueneberg D, Hsia M, Ravichandran P, Kothari N, Natesan S, Brugge JS. Distinct roles of Akt1 and Akt2 in regulating cell migration and epithelial-mesenchymal transition. J Cell Biol. 2005;6:1023–1034. doi: 10.1083/jcb.200505087. [DOI] [PMC free article] [PubMed] [Google Scholar]
- 9.Yoeli-Lerner M, Yiu GK, Rabinovitz I, Erhardt P, Jauliac S, Toker A. Akt blocks breast cancer cell motility and invasion through the transcription factor NFAT. Mol Cell. 2005;4:539–550. doi: 10.1016/j.molcel.2005.10.033. [DOI] [PubMed] [Google Scholar]
- 10.Liu H, Radisky DC, Nelson CM, Zhang H, Fata JE, Roth RA, Bissell MJ. Mechanism of Akt1 inhibition of breast cancer cell invasion reveals a protumorigenic role for TSC2. Proc Natl Acad Sci U S A. 2006;11:4134–4139. doi: 10.1073/pnas.0511342103. [DOI] [PMC free article] [PubMed] [Google Scholar]
- 11.Calin GA, Liu CG, Sevignani C, Ferracin M, Felli N, Dumitru CD, Shimizu M, Cimmino A, Zupo S, Dono M, Dell'Aquila ML, Alder H, Rassenti L, Kipps TJ, Bullrich F, Negrini M, Croce CM. MicroRNA profiling reveals distinct signatures in B cell chronic lymphocytic leukemias. Proc Natl Acad Sci U S A. 2004;32:11755–11760. doi: 10.1073/pnas.0404432101. [DOI] [PMC free article] [PubMed] [Google Scholar]
- 12.Lu J, Getz G, Miska EA, Alvarez-Saavedra E, Lamb J, Peck D, Sweet-Cordero A, Ebert BL, Mak RH, Ferrando AA, Downing JR, Jacks T, Horvitz HR, Golub TR. MicroRNA expression profiles classify human cancers. Nature. 2005;7043:834–838. doi: 10.1038/nature03702. [DOI] [PubMed] [Google Scholar]
- 13.Croce CM. Causes and consequences of microRNA dysregulation in cancer. Nat Rev Genet. 2009;10:704–714. doi: 10.1038/nrg2634. [DOI] [PMC free article] [PubMed] [Google Scholar]
- 14.Gregory PA, Bert AG, Paterson EL, Barry SC, Tsykin A, Farshid G, Vadas MA, Khew-Goodall Y, Goodall GJ. The miR-200 family and miR-205 regulate epithelial to mesenchymal transition by targeting ZEB1 and SIP1. Nat Cell Biol. 2008;5:593–601. doi: 10.1038/ncb1722. [DOI] [PubMed] [Google Scholar]
- 15.Park SM, Gaur AB, Lengyel E, Peter ME. The miR-200 family determines the epithelial phenotype of cancer cells by targeting the E-cadherin repressors ZEB1 and ZEB2. Genes Dev. 2008;7:894–907. doi: 10.1101/gad.1640608. [DOI] [PMC free article] [PubMed] [Google Scholar]
- 16.Seton-Rogers SE, Lu Y, Hines LM, Koundinya M, LaBaer J, Muthuswamy SK, Brugge JS. Cooperation of the ErbB2 receptor and transforming growth factor beta in induction of migration and invasion in mammary epithelial cells. Proc Natl Acad Sci U S A. 2004;5:1257–1262. doi: 10.1073/pnas.0308090100. [DOI] [PMC free article] [PubMed] [Google Scholar]
- 17.Dontu G, Abdallah WM, Foley JM, Jackson KW, Clarke MF, Kawamura MJ, Wicha MS. In vitro propagation and transcriptional profiling of human mammary stem/progenitor cells. Genes Dev. 2003;10:1253–1270. doi: 10.1101/gad.1061803. [DOI] [PMC free article] [PubMed] [Google Scholar]
- 18.Mani SA, Guo W, Liao MJ, Eaton EN, Ayyanan A, Zhou AY, Brooks M, Reinhard F, Zhang CC, Shipitsin M, Campbell LL, Polyak K, Brisken C, Yang J, Weinberg RA. The epithelial-mesenchymal transition generates cells with properties of stem cells. Cell. 2008;4:704–715. doi: 10.1016/j.cell.2008.03.027. [DOI] [PMC free article] [PubMed] [Google Scholar]
- 19.Padmanabhan S, Mukhopadhyay A, Narasimhan SD, Tesz G, Czech MP, Tissenbaum HA. A PP2A regulatory subunit regulates C. elegans insulin/IGF-1 signaling by modulating AKT-1 phosphorylation. Cell. 2009;5:939–951. doi: 10.1016/j.cell.2009.01.025. [DOI] [PMC free article] [PubMed] [Google Scholar]
- 20.Dennis P. American Association for Cancer Research Annual Meeting Education Book. AACR; San Diego, CA: 2008. pp. 24–35. [Google Scholar]
- 21.Cheng GZ, Park S, Shu S, He L, Kong W, Zhang W, Yuan Z, Wang LH, Cheng JQ. Advances of AKT pathway in human oncogenesis and as a target for anti-cancer drug discovery. Curr Cancer Drug Targets. 2008;1:2–6. [PubMed] [Google Scholar]
- 22.Levy D, Kahana JA, Kumar R. Akt inhibitor, GSK690693, induces growth inhibition and apoptosis in acute lymphoblastic leukemia cell lines. Blood. 2008 doi: 10.1182/blood-2008-02-137737. [DOI] [PubMed] [Google Scholar]
- 23.Mao C, Tili EG, Dose M, Haks MC, Bear SE, Maroulakou I, Horie K, Gaitanaris GA, Fidanza V, Ludwig T, Wiest DL, Gounari F, Tsichlis PN. Unequal contribution of Akt isoforms in the double-negative to double-positive thymocyte transition. J Immunol. 2007;9:5443–5453. doi: 10.4049/jimmunol.178.9.5443. [DOI] [PubMed] [Google Scholar]
- 24.Meek RL, Bowman PD, Daniel CW. Establishment of mouse embryo cells in vitro. Relationship of DNA synthesis, senescence and malignant transformation. Exp Cell Res. 1977;2:277–284. doi: 10.1016/0014-4827(77)90350-0. [DOI] [PubMed] [Google Scholar]
- 25.Obernosterer G, Martinez J, Alenius M. Locked nucleic acid-based in situ detection of microRNAs in mouse tissue sections. Nat Protoc. 2007;6:1508–1514. doi: 10.1038/nprot.2007.153. [DOI] [PubMed] [Google Scholar]
Associated Data
This section collects any data citations, data availability statements, or supplementary materials included in this article.


