Abstract
Perceiving and identifying an object is improved by prior exposure to the object. This perceptual priming phenomenon is accompanied by reduced neural activity. But whether suppression of neuronal activity with priming is responsible for the improvement in perception is unclear. To address this problem, we developed a rate-based network model of visual processing. In the model, decreased neural activity following priming was due to stimulus-specific sharpening of representations taking place in the early visual areas. Representation sharpening led to decreased interference of representations in higher visual areas that facilitated selection of one of the competing representations, thereby improving recognition. The model explained a wide range of psychophysical and physiological data observed in priming experiments, including antipriming phenomena, and predicted two functionally distinct stages of visual processing.
1 Introduction
Repeated presentation of a stimulus leads to faster and more accurate recognition of the repeated stimulus, a phenomenon called perceptual priming (Tulving & Schacter, 1990; Schacter & Buckner, 1998). Priming is an unconscious form of memory that has been observed in perceptual, semantic, and conceptual domains (Schacter, Wig, & Stevens, 2007), and it is intact in amnesic patients (Levy, Stark, & Squire, 1997). Priming is rapid in onset, long lasting, and stimulus specific (Wiggs & Martin, 1998) and leads to more efficient processing of sensory stimuli, making it a good candidate for anatomical and physiological studies aimed at discovering the underlying neural mechanisms of perceptual learning.
Neural activity in the cortex decreases with stimulus repetition (Schacter et al., 2007), as observed in single cell recordings (Li, Miller, & Desimone, 1993; Miller & Desimone, 1994), EEG (Gruber & Muller, 2002), and fMRI experiments (Wig, Grafton, Demos, & Kelley, 2005). Proposed explanations for neural suppression include (Grill-Spector, Henson, & Martin, 2006) (1) fatigue in neurons responding to a stimulus, so the subsequent presentations of the same stimulus cause a weaker response; (2) reduced response time, which produces fewer spikes; and (3) neural suppression due to shrinking the population size of neurons representing the stimulus. However, none of these hypotheses of underlying mechanisms of neural suppression could explain if and how neural suppression can lead to an improvement in psychophysical measurements of behavior, such as faster or more accurate processing of stimuli.
Here, based on the representation-sharpening hypothesis of neural suppression (Desimone, 1996), we used a rate model of cortical networks to explore how the neural suppression observed in priming experiments can lead to improvements in behavior with priming. In the model, representation sharpening takes place in the input layer and leads to selective activation of neurons in the next layer. Competition among different neural representations in layer 2 is facilitated after sharpening in layer 1. This results in improved recognition of the repeated stimulus. The model reproduced the essential features of priming, such as stimulus specificity and the incremental nature of priming, and explained a wide range of priming experiments, including antipriming, a deficit in performance that occurs to a second stimulus having an overlapping cortical representation with the first stimulus. Representation sharpening has many advantages, including reduced interference between representations of different objects, faster responses to familiar objects, and reduced metabolic cost.
2 Model
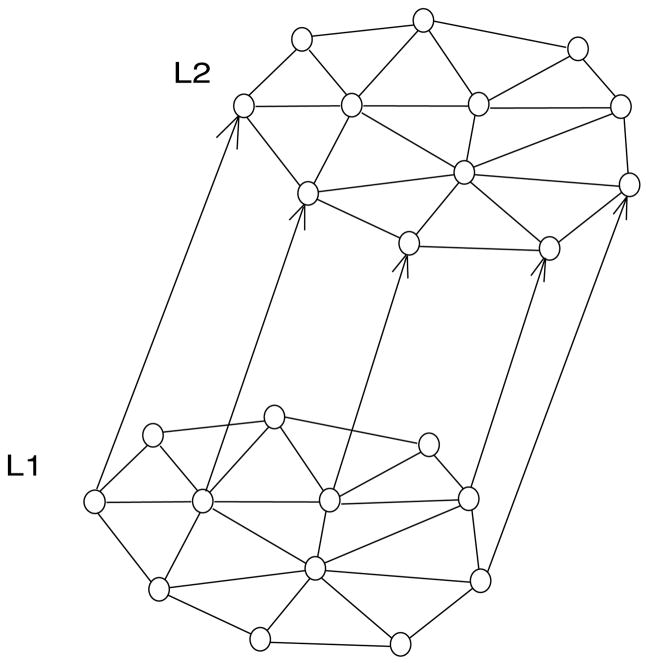
The rate model consisted of a two-layer network (see Figure 1), with each layer containing 20 units.
Figure 1.
Two-layer network model. Each layer consisted of 20 units. Layer 1 (L1) corresponded to an early visual area. The units in L1 were connected through all-to-all excitatory connections. The excitatory connections were plastic and adjusted according to a Hebbian learning rule. There were also fixed uniform all-to-all inhibitory connections of moderate strengths (not shown). Layer 2 (L2) in the model corresponded to a higher visual area or prefrontal cortex (PFC). Units in L2 received fixed (nonadjustable) feedforward inputs from units in L1 and also received fixed (nonadjustable), strong, recurrent all-to-all inhibitory connections from other units in L2. Units in L2 network displayed the dynamics of a winner-take-all network. Because of the strong mutual inhibition, eventually only one unit survived the competition and suppressed the other units.
2.1 Layer 1
Perceptual priming begins in the early stages of visual processing in areas V1, V2, and V4. Layer 1 (L1) in the model described processes taking place in these early visual areas during priming. We assumed that each unit in L1 represents a population of neurons (see Figure 1). The entire L1 network encodes one particular feature of an object, and we think of this network as part of a distributed representation in which other populations encode other different features of the object. We also assumed that each L1 unit responds differently to a particular feature of an object, each unit having its own degree of preference to that feature. In area V1, for example, neurons in a column may respond to an oriented bar, but how strongly they respond depends on each neuron’s preferred orientation (Hubel & Wiesel, 1968).
Units in L1 were connected through recurrent excitatory and inhibitory synapses. The reciprocal excitatory connections were plastic and adjusted according to the Hebbian rule (Hebb, 1949). This conforms to observations that plasticity in the adult cortex occurs mainly in layer 2/3 horizontal projections between pyramidal neurons (Foeller & Feldman, 2004). The inhibitory connections were fixed in strength and were only moderately strong to avoid strong competition.
2.2 Dynamics
Dynamics of the units in L1 were described by Wilson-Cowan equation (Wilson & Cowan, 1972),
| (2.1) |
where ui is a firing rate of unit i, wi j is the strength of an excitatory connection from unit j to unit i, b is the strength of uniform inhibitory connections between units, is an external input to the unit i, and f is a gain function of units. The first sum in equation 2.1 was over all values of the index j, assuming wj j = 0. The second sum was over index j other than i, to prevent negative feedback from a unit onto itself due to the uniform strength of the inhibitory connections:
| (2.2) |
where θ and ε are parameters. For the L1 network, the parameters had values b = 0.3, θ = 1, and ε = 0.5.
2.3 Learning Rule
The recurrent excitatory connections were modified according to the Hebbian learning rule augmented with competition among outgoing connections: strengthening of some connections led to weakening of other connections (Miller, 1996),
| (2.3) |
where wi j is the strength of a connection from unit j to unit i, ui is the activity of unit i, uj is activity of unit j, τsyn = 500 is a learning timescale, and α = 1 is a parameter. We assume that Wii = 0 for all i. And the sj term was
| (2.4) |
where the sum was over all values of index i.
The first term on the right-hand side of equation 2.3 represents a conventional Hebbian learning rule. Learning based on this term alone would produce unlimited weight increase, and the activity of the network would diverge. The purpose of the second term on the right-hand side is to normalize the weights and prevent them from growing without bound. The normalization term in equation 2.3 was chosen in a particular form to introduce competition among the outgoing synapses from a neuron. According to this learning rule, if some weights increase during learning, then other weights should decrease in order to keep the sum balanced. This can be shown by multiplying the left and right sides of equation 2.3 by wi j and summing over the indices of the outgoing connections:
| (2.5) |
Equation 2.5 shows that the sum of the square of the weights of outgoing connections is always less than the constant α. As a consequence, increases in some weights during learning are accompanied by decreases in other weights to keep the sum balanced.
2.4 Stimuli
The initial recurrent weights were set to random values that were then adjusted through synaptic plasticity by applying random external inputs with mean = 5 and SD = 0.5 to all units for 500 msec. For the experiments reported here, the initial excitatory weights had an average value of 0.22.
In simulations shown in Figure 2 and Figures 4 to 7, five units received stronger inputs (mean = 7) than other units (mean = 5). In Figures 8A to 8C, there were two overlapping input patterns, each consisting of five units, of which two belonged to both patterns. In Figure 8B, each pattern consisted of five units—one of which belonged to both patterns. Each unit within each pattern received different inputs whose total strength varied from strong (mean = 5) to weak (mean = 4).
Figure 2.
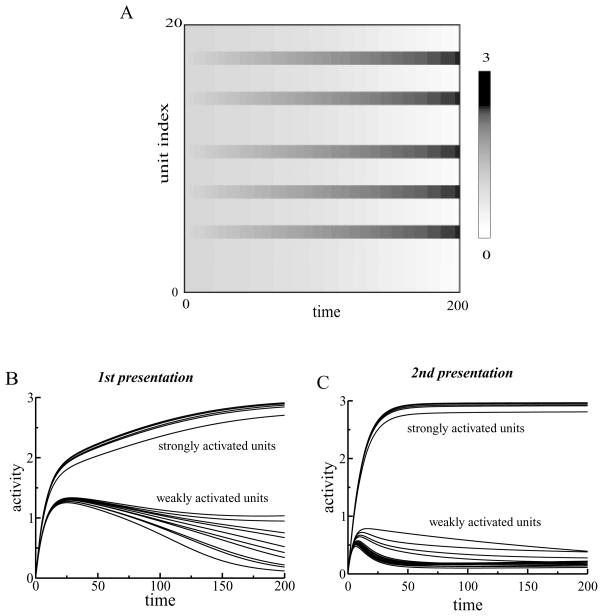
(A) Dynamics of the activity levels of L1 units. External inputs were randomly chosen. Five units received stronger inputs (mean = 7) than other units (mean = 5). The activities of those five units increased with time, while the activities of the other units decreased. (B) Dynamics of L1 units during the first presentation of a stimulus. After a rapid increase in activity, the units separated into two groups. The activities of units receiving stronger inputs continued to increase, while the activities of weakly activated units decreased. (C) Dynamics of L1 units during the second presentation of the stimulus. The two groups of units separated earlier for the repeated presentation of the stimulus.
Figure 4.
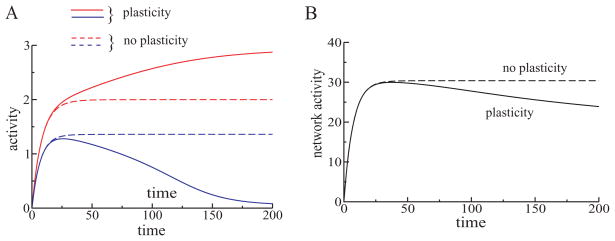
(A) Representation sharpening in L1 in the rate model was due to plasticity in the excitatory recurrent connections. Dynamics of activity of one strongly responding unit (red curves) and a weakly responding unit (blue curves) were different with synaptic plasticity (solid curves) and without plasticity (dashed curves) in recurrent excitatory connections. If the recurrent excitatory connections were adjustable, there was a monotonic separation between activities of L1 units; the stronger unit increased its activity with time, while the weaker unit decreased its activity (solid curves). However, without plasticity in the excitatory recurrent connections (learning rate α = 0), the units quickly reached their steady states and remained there for the rest of the stimulus presentation (dashed curves). The difference in the steady-state activity levels was a consequence of different input strengths. (B) Dynamics of the total activity of L1 network (sum of activities of L1 units) with and without plasticity in the recurrent excitatory connections. Although the strong units increased their activities with repetition, the total activity of L1 units decreased with time, when plasticity was present (black solid line). This was because only a few units became stronger, and many more units decreased their activity. Without plasticity in the recurrent connections, the total activity did not decrease but instead reached a steady state (black dashed line).
Figure 7.
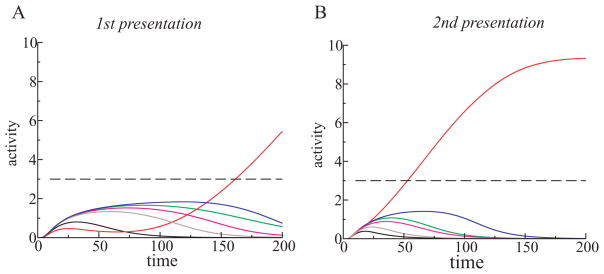
(A) A stimulus presented to the network resulted in competition between L2 units, until one of them (red solid line) suppressed the other units and reached a threshold indicating perception (black dashed line). (B) Second presentation of the same stimulus resulted in faster competition among units; the winning unit suppressed the other units and reached the threshold in less time.
Figure 8.
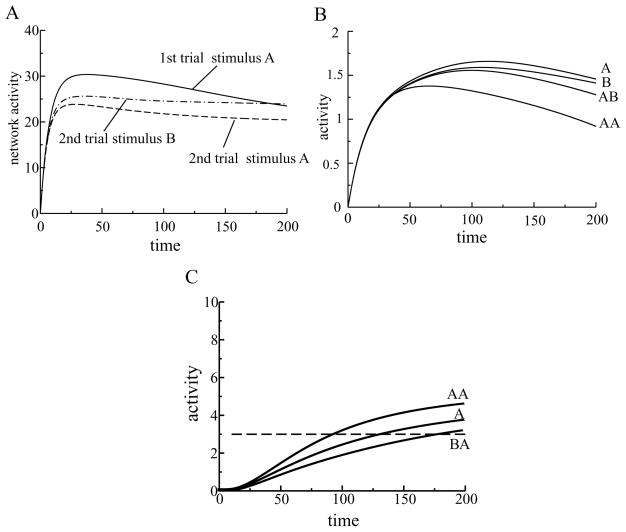
(A) Stimulus specificity of neural suppression. The dynamics of the total activity of the L1 units is shown for the first presentation of stimulus A (solid line), for the second presentation of the same stimulus A (dashed line), and when in the second presentation stimulus B was different than it was in the first presentation (dash-dotted line). (B) Suppression of a single neuron’s activity was more stimulus specific than the neuron’s response. One unit in L1 responded well to two different stimuli, A and B. Suppression of the neuron’s activity to the second presentation of stimulus A (AA) was stronger compared to stimulus B presented after stimulus A (AB). (C) Antipriming phenomenon in a winning unit from L2. When stimulus A was presented twice (AA), the reaction time in the model decreased (priming). But when stimulus A was presented after stimulus B, whose representation overlapped with the representation of the stimulus A (BA), the reaction time increased (antipriming) compared to the initial reaction time (stimulus A alone).
We presented a stimulus to the network in subsequent trials by updating weights and simply resetting the initial conditions for the rest of variables. A single extended presentation was effectively the same as several presentations of a shorter stimulus, having the same total duration. This was due to no adaptation being applied in the model.
2.5 Layer 2
The second layer (L2) in the rate model (see Figure 1) described processes taking place in higher visual areas, such as inferotemporal cortex (IT), or in prefrontal cortex (PFC) during priming. IT area and PFC are important for the recognition, discrimination, and categorization of objects (Riesenhuber & Poggio, 2000). The architecture of the L2 network was chosen so that each unit in L2 represents a distinct object and L2 units compete with each other so that only one unit can be active at one time (winner-take-all). It is unlikely that single neurons in IT or the PFC represent whole objects, and each L2 unit should be considered as a population of neurons encoding an object.
The winner-take-all feature of L2 of the model predicts that neural representations in higher visual areas or PFC are more competitive compared to representations in the earlier visual areas. Although we modeled this competition in L2 via strong inhibitory connections among L2 neurons, there might be other possible explanations of such competition.
The dynamics of activity in L2 was described by equation 2.1 with parameters b = 1, θ = 2, and ε = 0.3. The feedforward connections from L1 to L2 units were chosen randomly and were fixed during the simulations. We have chosen feedforward connections from binary distribution [0,1], so that units in layer 2 receive on average inputs from seven units in layer 1.
3 Results
3.1 Representation Sharpening
Units in L1 received external inputs with different strengths, which resulted in separation of L1 unit activities into strongly responding and weakly responding units (see Figure 2A). The learning rule adjusted the recurrent excitatory connections so that each unit weakened its connections to less active units and strengthened its connections to more active units. As a consequence, weakly active units received less recurrent excitation, leading to a further decrease in the activity of those units (see Figures 2B and 2C).
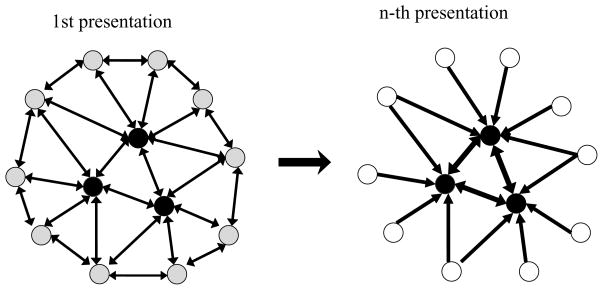
In contrast, strongly activated units received more excitation through strengthened excitatory connections, which resulted in an increase in their activity levels. Due to this form of learning, repetition of the stimulus resulted in further weakening and eventual silencing of initially weakly responding units. This process led to a smaller neural population representing the stimulus, consistent with the representation-sharpening hypothesis (Desimone, 1996). According to this hypothesis, initially many neurons responded to the stimulus (see Figure 3, left). The units had different levels of preference for the particular features of the stimulus, which resulted in different activity levels of the responding units. With repetition, only those neurons remained in the representation that responded most strongly—those for which the feature was the preferred one or close to preferred. The weakly responding neurons were eliminated from the representation (see Figure 3, right). The eliminated neurons, whose preferred features do not match the stimulus features, were presumably not important for identifying that specific object (Ringo, 1996).
Figure 3.
Illustration of representation sharpening in L1. (Left) Initial stimulus presentation activated a pattern of activity of the units in L1 that were activated to varying degrees. Darker filled circles indicate higher activity levels. Strengths of connections are indicated by the thickness of lines connecting the units. For clarity, we illustrate reciprocal connections as one line with two arrowheads, indicating two synapses. (Right) With stimulus repetition, connections between strongly activated units were strengthened, and connections from strongly responding units to weakly active units and between weakly active units were weakened and eventually silenced. This resulted in representation sharpening: only the most active units remained in the representation, and weakly responding units were eliminated from the representation of the stimulus.
3.2 Plasticity and Neural Suppression
The representation sharpening was the underlying mechanism of the neural suppression in the model, and plasticity in the excitatory connections was responsible for representation sharpening. We observed that representation sharpening in L1 occurred only when plasticity in the excitatory recurrent connections was present. In the simulations, the most active units gradually increased their activities and the less active units gradually decreased their activities while the stimulus was present (see Figure 4A, solid lines). But without plasticity in the excitatory connections, the activated units quickly reached their steady-state rates and remained there for the rest of stimulation time (see Figure 4A, dashed lines).
Representation sharpening in the model led to a decrease of the overall activity of the network even though some neurons increased their firing rates (see Figures 4A and 4B). Under conditions where the representation sharpening occurred, the overall activity in the model decreased because more neurons decreased rather than increased their activities. Again, the overall activity of L1 network decreased (see Figure 4B, solid line) only in the presence of plasticity (see Figure 4B, dashed line). No mechanisms intrinsic to a neuron, such as adaptation, were included in the model that would lead to reduction of the firing rates.
3.3 Conditions for Neural Suppression to Occur
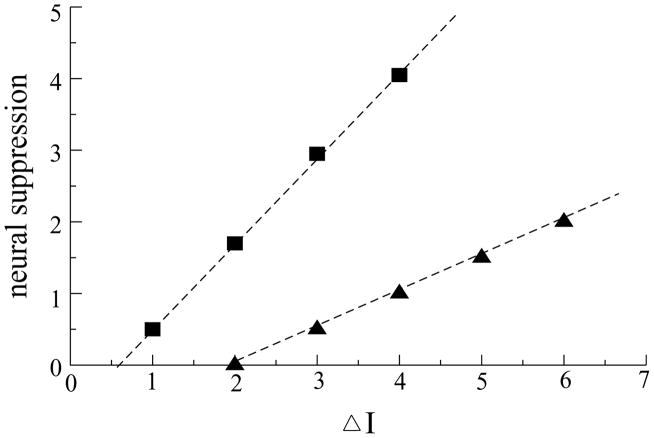
Thus, the neural suppression in the model was based on synaptic plasticity. We implemented a particular form of synaptic plasticity with competition among synaptic weights based on activities of neurons. This requires an initial distribution in the activities of neurons, with some neurons more strongly activated than others. We have found that for the neural suppression to occur, there should be a gap in activities between the most active and the weaker units. By varying the input strengths applied to different units, we found that neural suppression takes place only when the difference between the strong inputs and the weaker inputs is larger than a certain minimum value (see Figure 5). There was no neural suppression when the difference between the inputs was less than this value, in which case no units decreased their activities with repetition, and all units reached their steady states, as occurs when there is no plasticity (see Figures 4A and 4B).
Figure 5.
Decrease of the total activity of the L1 network (sum of activities of L1 units) as a function of differences between inputs to stronger and weaker units. A bigger difference between inputs to strongly activated and weakly activated units led to bigger neural suppression. But this dependence worked only above a certain threshold. We checked this dependence for two strengths of inhibition: parameter b = 0.27 (rectangular) and b = 0.2 (triangular symbols). Input to weaker units was I = 5, and inputs to stronger inputs were varied.
This observation suggests that for a given value of parameters of the model, there is a minimal width in the distribution of activities of units needed to trigger neural suppression (see Figure 5). Units with activities below the threshold will decrease their activities, and units with activities above the threshold will increase their activities. Because of the sparse distribution of highly active units found in most cortical areas, the total neural activity should decrease with priming.
3.4 Inhibition and Neural Suppression
The Hebbian learning rule implemented in the model is not very competitive (Miller, 1996). The model without included inhibitory connections led to only modest changes of neural activity with repetition. But addition of even weak inhibitory connections among units facilitated the competition among synapses and increased the neural suppression. However, the neural suppression was not due to inhibition leading to winner-take-all behavior; the inhibitory strengths were adjusted to prevent a single neuron from suppressing all the others (see, e.g., the “no plasticity” case in Figure 4A). Thus, the moderately competitive Hebbian learning rule augmented with weak inhibitory connections led to stronger competition among synapses.
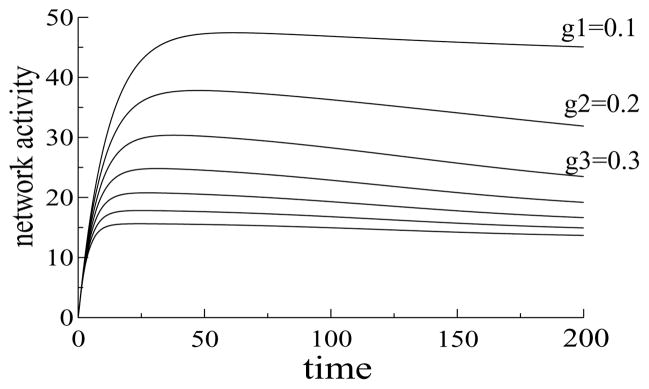
A wide range of inhibitory strengths gave rise to neural suppression (see Figure 6). Strengthening inhibition decreased the overall network activity, but the total activity decreased with repetition over a wide range of inhibitory strengths, and therefore representation sharpening was a robust feature of the model (see Figure 6). Over this range, the inhibitory strengths were too weak to engage winner-take-all behavior, and no single unit could suppress all the others.
Figure 6.
Dynamics of the total activity of L1 network (sum of activities of L1 units) for different strengths of the inhibitory connections. When inhibition was weak (b = 0.1), the total activity of the network was high (highest line), and with strong inhibition (b = 0.7), the total activity was low (lowest line). However, for all values of the inhibitory strengths, the total activity decreased with time, which was a consequence of neural suppression in L1.
3.5 Competitive Interactions Among Representations in Higher Visual Areas
Although the model demonstrated that representation sharpening is a possible mechanism underlying neural suppression observed in priming experiments, it was not clear how neural suppression can improve psychophysical performance. According to some accounts, a perceptual decision takes place when activity in an appropriate cortical area increases in response to a stimulus and reaches a threshold (Usher & McClelland, 2001; Gold & Shadlen, 2007). Improvement in psychophysical performance can be improved if the neural activity in the cortical area responsible for making a decision reached that threshold faster and more reliably.
The second layer (L2) in the rate model (see Figure 1) described processes taking place in higher visual areas, such as IT cortex, or in PFC. Each unit in L2 represented an object. We introduced competition among L2 units via strong reciprocal inhibition, so only one unit can be active at a time, suppressing all other units (winner-take-all). The winner-take-all feature of the L2 network in the rate model predicts that neural representations in higher visual areas or PFC are more competitive compared to representations in the earlier visual areas.
L2 units received inputs from randomly chosen L1 units via fixed feedforward connections. Following an input from L1, activated L2 units competed with each other, until one of them (see Figure 7A, red curve) suppressed the other units. And if there is a threshold for neural activity, and crossing that threshold indicates perception of the presented object (Gold & Shadlen, 2007), then the time it takes for the winning unit to reach the threshold can be interpreted as a reaction time.
The function of the winner-take-all architecture of the L2 network was to reduce the pattern of active units in L2, representing several objects, to a single unit representing the dominant object. The winning unit in L2 received most of its inputs from strongly responding L1 units, whose activities increased with priming. In contrast, there were L2 units that received inputs from L1 units that weakened following stimulus presentation. Thus, the winning L2 unit received stronger input with stimulus repetition, and other L2 units received weaker inputs, and this hastened the process of competition (see Figure 7B).
In Figure 7A, the winning unit was initially less active than other competing units, probably because other units received inputs from a larger number of L1 units than the winning unit. But the advantage of the winning unit was that it received inputs from the most active units in L1—units that survived representation sharpening and remained in a stimulus representation.
3.6 Stimulus Specificity of Neural Suppression
Priming is a stimulus-specific phenomenon (Wiggs & Martin, 1998). We tested in the model whether neural suppression following stimulus repetition was also stimulus specific. A stimulus was presented to the network on the first trial, followed by either the same stimulus or a different one on the second trial. The total activity of L1 units on the second trial using a different stimulus was much higher than the total activity using a second stimulus that was identical to the first (see Figure 8A).
In the example in Figure 8A, the representations of stimuli A and B on L1 partially overlapped. As a consequence, presenting stimulus B after stimulus A was not quite the same as presenting stimulus B to an inexperienced network. If there were no overlap between the representations of A and B, the response to B after A would be close to the initial response to stimulus A alone.
Although the neural activity after time 180 was higher in response to stimulus B after stimulus A than the response to stimulus A alone, the integrated response of the network to stimulus B after stimulus A was lower than the integrated response to stimulus A on the first trial. The neural activity after time 180 was higher in response to stimulus B after stimulus A than the response to stimulus A alone because the network’s response to stimulus B presented after stimulus A was not monotonically suppressed, as occurs during the presentation of stimulus A alone. This behavior was once again due to a consequence of the overlapping representations for stimuli A and B. During presentation of stimulus B after stimulus A, two processes took place simultaneously: learning the representation of stimulus B and partial unlearning of the representation for stimulus A. If we had presented stimulus B for the second time, B after B, then further decrease of neural activity would have been observed.
3.7 Neural Suppression and Neural Adaptation
A possible explanation for the reduced neural activity observed in priming experiments is adaptation of intrinsic neural excitability. This can be tested because it makes a different prediction than the sharpening hypothesis does for neural suppression. If a neuron responds equally well to two distinct stimuli, A and B, then, according to the neural adaptation hypothesis, presenting stimulus A twice (A-A) or stimulus B after stimulus A (A-B) should result in a similar reduction of the neuron’s activity. This did not occur in experimental recordings from cortical neurons, where the reduction of the neural activity of a single cell that responded well to several stimuli was stimulus specific (Sawamura, Orban, & Vogels, 2006).
We tested this prediction in the model. We followed the activity of a unit in L1 of the model that responded to two stimuli, A and B, and therefore participated in two distinct but partially overlapping populations of units representing these two stimuli (see Figure 8B). Following presentation of stimulus A, the population of L1 units representing stimulus A has been adjusted. Most of the units representing A received reduced inputs, except a few strongly responding neurons, due to a weakening of the recurrent connections. Stimulus B was represented by an overlapping but distinct population of units. And if the overlap is not large, then synaptic changes due to presentation stimulus A did not have a strong impact on the representation of stimulus B. Therefore, when stimulus B was presented after A, the recorded unit received inputs from a different set of units with largely unaffected synapses, so the response was not as suppressed as it would be for A presented after A (see Figure 8B). Thus, the behavior of the model based on sharpening hypothesis was in agreement with the experimental findings (Sawamura et al., 2006). These experiments support synaptic mechanisms of priming rather than intrinsic adaptation mechanisms.
3.8 Antipriming Effect
The improvement in the behavior with repetition that we observed in the model was attributed to the sharpening of the stimulus representation in L1. We also predicted that when two stimuli had strongly overlapping representations in L1 (as in Figure 8A), the sharpening of the representation of one stimulus would disturb the representation of the other stimulus. Therefore, if the overlap is large, an experience with one stimulus would impair the recognition of the other overlapping stimulus. This was indeed observed in the simulations (see Figure 8C). The repeated presentation of stimulus A facilitated competition among L2 units and shortened the reaction time (see Figure 8C, curves marked A and AA), but stimulus A presented after stimulus B extended the reaction time (see Figure 8C, curve marked BA). This behavior has been observed in experiments and is called antipriming (Marsolek, Schnyer, Deason, Ritchey, & Verfaellie, 2006; Marsolek, 2008). Antipriming was not built into the model (and was not even known to the authors at the time) but was implicit in the neural architecture.
3.9 Correlation Between Neural Suppression and Improvement of Behavior
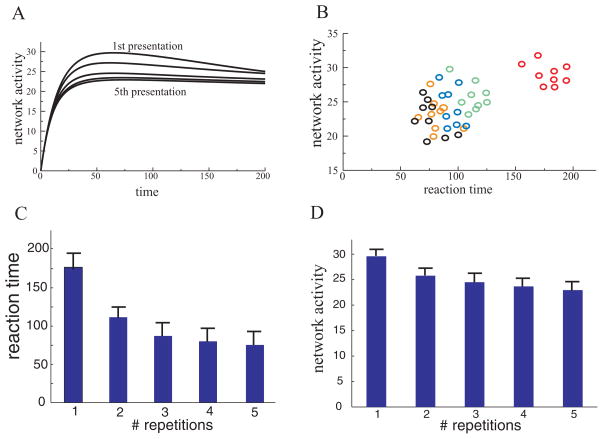
We demonstrated that repetitive presentation of a stimulus incrementally decreased network activity (see Figure 9A). We also showed that stimulus repetition incrementally decreased network activity and shortened reaction time—time for the winning L2 unit to suppress other units and resolve the competition (see Figures 9B, 9C, and 9D). This sort of behavior is usually observed in priming experiments. And now our model suggests that correlation between neural suppression and improvement of behavioral observed in priming experiments can be causal.
Figure 9.
(A) The network activity monotonically decreased during repeated presentation of the same stimulus. (B) Robustness of the priming effect. Nine stimuli were presented to the network five times each. Each red circle indicates the first presentation of stimuli, and each green, blue, orange, and black circle is a second, third, fourth, and fifth presentation, respectively. The stimuli varied in size of the input pattern, location, strength of inhibition, strengths of inputs, and so forth. For all stimuli, both reaction time and the total network activity decreased with repetition. (C) The reaction time (time for the winning unit to reach a threshold) decreased monotonically with stimulus repetition (the mean reaction times were 177, 108, 89, 81, and 77 with SD 16, 10, 11, 12, 12, respectively). (D) Total activity of the L1 network measured at the end of the stimulus presentation also decreased (mean total activity was 29, 26, 24, 23, 22.5 with SD 1.6, 2.3, 3.2, 3, 2.9, respectively).
4 Discussion
Despite the ubiquitous nature of priming phenomenon (Wiggs & Martin, 1998; Schacter et al., 2007), the neural mechanisms underlying this phenomenon remain uncertain. One of the intriguing questions is whether the neural suppression and improvements in behavior, both observed in priming experiments, are two sides of the same phenomenon: Is the correlation between neural suppression and priming (Tulving & Schacter, 1990; Schacter & Buckner, 1998; Wiggs & Martin, 1998) causal? To explore this question, we have developed a model of perceptual priming.
Neural suppression in the presented model was based on the representation-sharpening hypothesis (Desimone, 1996), which assumes that neural suppression is due to reduced populations of neurons representing the stimulus in the early visual areas. This leads to a more selective activation of neurons representing objects in higher visual areas and thereby reduces ambiguity in visual perception. Thus, the model had two processing layers: stimulus representations were sharpened in the first layer, as might occur in early areas of visual processing, and the representation sharpening facilitated competitive interactions of representations in the second layer, which might correspond to higher visual areas or the PFC. We demonstrated how neural suppression leads to improvement in behavior with priming and reproduced the essential features of the priming phenomenon, including antipriming, stimulus specificity, and the incremental nature of priming. In the model, priming was based on the sharpening of neural populations representing only a single feature of an object. The model can be scaled up to handle priming due to a sharpening of multiple sets of neural populations representing many different features of the object.
Sharpening of neuronal responses in the IT cortex of monkeys has been observed during passive viewing of randomly selected familiar stimuli (Freedman, Riesenhuber, Poggio, & Miller, 2006). This sharpening occurred without increasing average neural firing rates, supporting the sharpening hypothesis. Sharpening was also observed in monkeys trained by rewards over several months to discriminate stimuli into two categories. The sharpening of neural responses for explicitly trained stimuli occurred without an increase of average neural firing rates, as occurred with sharpening to familiar untrained stimuli. This similarity suggests that sharpening is not specific to long-term training, but rather reveals a more general neural mechanism responsible for improvement of stimulus processing. Freedman et al. (2006) also reported that changes in the responses of IT neurons with experience were most pronounced in the early neural response (80–180 msec), consistent with the prediction of our model that priming is a consequence of more efficient processing in a feedforward network.
The concept of competition among representations in L2 of the model was similar to competition between visual stimuli in binocular rivalry experiments. In binocular rivalry experiments (Blake & Logothetis, 2001), perception alternates between the two different stimuli simultaneously presented to the two eyes, which is believed due to competition between the representations of the two stimuli in higher visual areas, such as IT. Although, the competition for static stimuli may occur as early as the primary visual area V1 (Polonsky, Blake, Braun, & Heeger, 2000), when the stimulus alternates between eyes at a high frequency, then neural correlates of rivalry are found in higher visual areas (Logothetis, Leopold, & Sheinberg, 1996).
Although we assumed in the model that competition between representations takes place in higher visual areas or the PFC, neural competition may be a general characteristic throughout the vision hierarchy (Wilson, 2003; Tong, Meng, & Blake, 2006). This suggests an alternative interpretation of our two-stage model. Depending on the stimulus, representation sharpening could take place in layers 2/3 of any visual area, starting from V1, and competitive interactions (winner-take-all) take place in layers 5/6 or downstream in subcortical structures such as the striatum. Representation sharpening in layers 2/3 of V1 results in a sharper input to area V2, and this process is then replicated in all other higher areas. Pyramidal neurons in layers 5/6 project subcortically, and improvements in perception could in this way affect motor output. For example, neurons in layer 5 of V1 projects to superior colliculus, which could be responsible for reducing the latency of saccadic eye movements to primed visual targets.
Although there is evidence supporting a causal role for repetition suppression in priming in humans (Wig et al., 2005; Schacter et al., 2007), a study of neural responses in nonhuman primates came to a conclusion that correlations between behavioral priming and neural suppression were not significant (McMahon & Olson, 2007). We assume that this conclusion was based on analysis of the correlations in which the diversity of the stimuli, presented to the monkeys was not taken into account. The monkeys were trained to discriminate symmetric figures from asymmetric ones. For the symmetric stimuli, relatively smaller neural suppression accompanied larger behavioral priming, and for the asymmetric stimuli, it was the opposite. Thus, merging of these two cases may have obscured the correlations, which would be apparent if the data for the symmetric and asymmetric figures were analyzed separately.
Based on their experimental data, McMahon and Olson (2007) also proposed a scaling (or fatigue) mechanism to explain suppression of neural activity: strongly responding neurons decreased their activities to repeated presentation of the same stimulus. This scaling effect may reflect spike frequency adaption taking place simultaneously with representation sharpening. The characteristic response times of neurons in their experiment were between 200 and 450 msec. The correct response was followed by another presentation of the same or a different stimulus with various delays. If the interstimulus interval was not long enough for the responding neurons to recover, the neurons could not respond to the same degree to the repeated stimulus. Adaptation of intrinsic neural activity has a transient nature, while priming is a long-lasting phenomenon that is likely to be based on synaptic modifications. So intrinsic neural adaptation, as well as short-term synaptic depression, could have masked the neural suppression associated with long-term synaptic modification that is responsible for long-lasting behavioral priming in these experiments. Thus, adaptation does not rule out sharpening. Experiments with longer interstimulus intervals could distinguish between models based on scaling and sharpening (Grill-Spector et al., 2006).
Experiments showing that neural suppression was more stimulus specific than the neural response (Sawamura et al., 2006) support synaptic mechanisms rather than intrinsic adaptation. Neurons that responded to the same degree to two different stimuli, for example, A and B, adapted much more strongly for successive presentations of the same stimulus, for example, A-A, than for a presentation of the type A-B. Adaptation mechanisms that depend on only neural activity should produce as much adaptation to B as to A on the second presentation.
In the priming studies of IT neurons (McMahon & Olson, 2007), a new set of stimuli was designed for the test sessions, so the test stimuli were novel to the monkeys. And to prevent stimuli from being used in multiple test sessions, stimuli were chosen randomly from a data set; thus, most of the stimuli were presented in only one test session. But due to a shallow data set for symmetrical figures, some stimuli were presented in several test sessions, which might lead to the monkeys’ being able to remember those stimuli. This raises the question of how priming is related to long-term recognition memory. Priming is an implicit memory system that is primarily cortical and can be observed in amnesic patients with damage to medial temporal lobe structures, whereas familiarity and recognition are part of an explicit memory system that requires the hippocampal system. The interaction between these two memory systems deserves further study.
The priming effect survives exposure to many intervening stimuli and can last for years (Mitchell, 2006). How many presentations of intervening stimuli does it take to erase the priming memory of a particular stimulus? The answer to this question depends on the capacity of a network, the number of stimuli that can be remembered, and the accumulated effect of noise. Relevant parameters include the size of a network, the sparseness of representations, the plasticity of the synapses, the similarity of the stimuli, and the duration of stimulus presentation. In the antipriming simulations, we showed that even one stimulus that is similar to the original one is enough to disturb the original representation. However, in a large network with sparse representations, stimuli would have minimal overlap, and exposure to many intervening stimuli could occur without interference. The results of long-term priming experiments (Mitchell, 2006) suggest that the cortical representations are sparse. It should be possible to scale up the network model to replicate long-term experimental studies of priming.
Representation sharpening has been simulated in feedforward network models (Sohal & Hasselmo, 2000; Norman & O’Reilly, 2003; Bogacz & Brown, 2003). Adjustment of feedforward connections might also be involved in neural suppression, but they do not have as great a capacity as lateral interactions between neurons within a layer, such as those within cortical layer 2/3. More important, these studies did not model behavioral priming; thus, they did not examine whether neural suppression could account for changes in psychophysical measures of behavior, such as reaction time. Another model of neural suppression with repetition was based on a predictive coding paradigm (Friston, Kilner, & Harrison, 2006), which emphasized feedback connections between layers. Higher layers provided top-down prediction to bottom layers, and prediction error decreased with repetition. A critical measurement that could distinguish between the contributions of feedforward, recurrent, and feedback models is to examine the time courses of responses and the relative response decreases at different latencies in priming experiments (Grill-Spector et al., 2006). If neural suppression occurs with the same latency as the neural response, this would support feedforward models with plastic recurrent connections within a cortical area, but if neural suppression occurs much later than the neural response, this would support models that depended on feedback to earlier cortical areas.
Our model suggests that representations of an object in different cortical areas might undergo different levels of sharpening with repetition. Activity patterns should be more labile in early visual areas and more stable in higher visual areas. Thus, blockade of long-term synaptic plasticity in lower visual areas should produce a stronger deficit in perceptual priming compared to a blockade of plasticity in higher visual areas.
Representation sharpening might be relevant not only to the perception of objects but also to motion perception. In studies of motion perception, task-irrelevant perceptual learning takes place in lower visual areas, which influences processing in higher visual areas (Watanabe et al., 2002). In the prefrontal cortex, neuronal suppression with repetition was accompanied by higher neuronal selectivity (Rainer & Miller, 2000). This supports a general principle for processing in the visual system: processing in early visual areas involves adjustments to the representation of the environment in order to facilitate processing in the higher cortical areas.
Acknowledgments
This work was supported by the Howard Hughes Medical Institute (T.J.S.); the Swartz Foundation (S.B.M.); and NIDCD (R01 NS060870-01) and NINDS (R01 DC006306-05) to M.B.
Contributor Information
Samat Moldakarimov, Email: samat@salk.edu, Howard Hughes Medical Institute, Computational Neurobiology Laboratory, Salk Institute for Biological Studies, La Jolla, CA 92037, U.S.A.
Maxim Bazhenov, Email: maksim.bazhenov@ucr.edu, Howard Hughes Medical Institute, Computational Neurobiology Laboratory, Salk Institute for Biological Studies, La Jolla, CA 92037, USA and Department of Cell Biology and Neuroscience, University of California, Riverside, CA 92521, U.S.A.
Terrence J. Sejnowski, Email: terry@salk.edu, Howard Hughes Medical Institute, Computational Neurobiology Laboratory, Salk Institute for Biological Studies, La Jolla, CA 92037, USA and Division of Biological Sciences, University of California at San Diego, La Jolla, CA, 92093, U.S.A.
References
- Blake R, Logothetis NK. Visual competition. Nat Rev Neurosci. 2001;3:1–11. doi: 10.1038/nrn701. [DOI] [PubMed] [Google Scholar]
- Bogacz R, Brown MW. Comparison of computational models of familiarity discrimination in the perirhinal cortex. Hippocampus. 2003;13:494–524. doi: 10.1002/hipo.10093. [DOI] [PubMed] [Google Scholar]
- Desimone R. Neural mechanisms for visual memory and their role in attention. Proc Natl Acad Sci USA. 1996;93:13494–13499. doi: 10.1073/pnas.93.24.13494. [DOI] [PMC free article] [PubMed] [Google Scholar]
- Foeller E, Feldman DE. Synaptic basis for developmental plasticity in somatosensory cortex. Curr Opin Neurobiol. 2004;14:89–95. doi: 10.1016/j.conb.2004.01.011. [DOI] [PubMed] [Google Scholar]
- Freedman DJ, Riesenhuber M, Poggio T, Miller EK. Experience-dependent sharpening of visual shape selectivity in inferior temporal cortex. Cereb Cortex. 2006;16:1631–1644. doi: 10.1093/cercor/bhj100. [DOI] [PubMed] [Google Scholar]
- Friston K, Kilner J, Harrison L. A free energy principle for the brain. J Physiol Paris. 2006;100:70–87. doi: 10.1016/j.jphysparis.2006.10.001. [DOI] [PubMed] [Google Scholar]
- Gold JI, Shadlen MN. The neural basis of decision making. Annu Rev Neurosci. 2007;30:535–574. doi: 10.1146/annurev.neuro.29.051605.113038. [DOI] [PubMed] [Google Scholar]
- Grill-Spector K, Henson R, Martin A. Repetition and the brain: Neural models of stimulus-specific effects. Trends Cogn Sci. 2006;10:14–23. doi: 10.1016/j.tics.2005.11.006. [DOI] [PubMed] [Google Scholar]
- Gruber T, Muller MM. Effects of picture repetition on induced gamma band responses, evoked potentials, and phase synchrony in the human EEG. Cognitive Brain Res. 2002;13:377–392. doi: 10.1016/s0926-6410(01)00130-6. [DOI] [PubMed] [Google Scholar]
- Hebb DO. The organization of behavior. New York: Wiley; 1949. [Google Scholar]
- Hubel DH, Wiesel TN. Receptive fields and functional architecture of monkey striate cortex. J Physiol. 1968;195:215–243. doi: 10.1113/jphysiol.1968.sp008455. [DOI] [PMC free article] [PubMed] [Google Scholar]
- Levy DA, Stark CEL, Squire LR. Intact conceptual priming in the absence of declarative memory. Psychol Science. 1997;15:680–686. doi: 10.1111/j.0956-7976.2004.00740.x. [DOI] [PMC free article] [PubMed] [Google Scholar]
- Li L, Miller EK, Desimone R. The representation of stimulus familiarity in anterior inferior temporal cortex. J Neurophysiol. 1993;69:1918–1929. doi: 10.1152/jn.1993.69.6.1918. [DOI] [PubMed] [Google Scholar]
- Logothetis NK, Leopold DA, Sheinberg DL. What is rivaling during binocular rivalry? Nature. 1996;380:621–624. doi: 10.1038/380621a0. [DOI] [PubMed] [Google Scholar]
- Marsolek CJ. What antipriming reveals about priming. Trends Cogn Sci. 2008;12:176–181. doi: 10.1016/j.tics.2008.02.005. [DOI] [PubMed] [Google Scholar]
- Marsolek CJ, Schnyer DM, Deason RG, Ritchey M, Verfaellie M. Visual antipriming: Evidence for ongoing adjustments of superimposed visual object representations. Cogn Affect Behav Neurosci. 2006;6:163–174. doi: 10.3758/cabn.6.3.163. [DOI] [PubMed] [Google Scholar]
- McMahon DB, Olson CR. Repetition suppression in monkey inferotemporal cortex: Relation to behavioral priming. J Neurophysiol. 2007;97:3532–3543. doi: 10.1152/jn.01042.2006. [DOI] [PubMed] [Google Scholar]
- Miller EK, Desimone R. Parallel neuronal mechanism for short-term memory. Science. 1994;263:520–522. doi: 10.1126/science.8290960. [DOI] [PubMed] [Google Scholar]
- Miller KD. Synaptic economics: Competition and cooperation in synaptic plasticity. Neuron. 1996;17:371–374. doi: 10.1016/s0896-6273(00)80169-5. [DOI] [PubMed] [Google Scholar]
- Mitchell DB. Nonconscious priming after 17 years: Invulnerable implicit memory? Psychological Science. 2006;17:925–929. doi: 10.1111/j.1467-9280.2006.01805.x. [DOI] [PubMed] [Google Scholar]
- Norman KA, O’Reilly RC. Modeling hippocampal and neocortical contributions to recognition memory: A complementary-learning-systems approach. Psychol Rev. 2003;110:611–646. doi: 10.1037/0033-295X.110.4.611. [DOI] [PubMed] [Google Scholar]
- Polonsky A, Blake R, Braun J, Heeger J. Neuronal activity in human primary visual cortex correlates with perception during binocular rivalry. Nature Neurosci. 2000;3:1153–1159. doi: 10.1038/80676. [DOI] [PubMed] [Google Scholar]
- Rainer G, Miller EK. Effects of visual experience on the representation of objects in the prefrontal cortex. Neuron. 2000;27:179–189. doi: 10.1016/s0896-6273(00)00019-2. [DOI] [PubMed] [Google Scholar]
- Riesenhuber M, Poggio T. Models of object recognition. Nature Neurosci. 2000;3:1199–1204. doi: 10.1038/81479. [DOI] [PubMed] [Google Scholar]
- Ringo JL. Stimulus specific adaptation in inferior temporal and medial temporal cortex of the monkey. Behav Brain Res. 1996;76:191–197. doi: 10.1016/0166-4328(95)00197-2. [DOI] [PubMed] [Google Scholar]
- Sawamura H, Orban GA, Vogels R. Selectivity of neuronal adaptation does not match response selectivity: A single-cell study of the FMRI adaptation paradigm. Neuron. 2006;49:307–318. doi: 10.1016/j.neuron.2005.11.028. [DOI] [PubMed] [Google Scholar]
- Schacter DL, Buckner RL. Priming and the brain. Neuron. 1998;20:185–195. doi: 10.1016/s0896-6273(00)80448-1. [DOI] [PubMed] [Google Scholar]
- Schacter DL, Wig GS, Stevens WD. Reductions in cortical activity during priming. Curr Opin Neurobiol. 2007;17:171–176. doi: 10.1016/j.conb.2007.02.001. [DOI] [PubMed] [Google Scholar]
- Sohal V, Hasselmo ME. A model for experience-dependent changes in the responses of inferotemporal neurons. Network: Computation in Neural Systems. 2000;11:169–190. [PubMed] [Google Scholar]
- Tong F, Meng M, Blake R. Neural bases of binocular rivalry. Trends Cogn Sci. 2006;10:502–511. doi: 10.1016/j.tics.2006.09.003. [DOI] [PubMed] [Google Scholar]
- Tulving E, Schacter DL. Priming and human memory systems. Science. 1990;247:301–306. doi: 10.1126/science.2296719. [DOI] [PubMed] [Google Scholar]
- Usher M, McClelland JL. The time course of perceptual choice: The leaky, competing accumulator model. Psychol Rev. 2001;108:550–592. doi: 10.1037/0033-295x.108.3.550. [DOI] [PubMed] [Google Scholar]
- Watanabe T, Nanez JE, Koyama S, Mukai I, Liederman J, Sasaki Y. Greater plasticity in lower-level than higher-level visual motion processing in a passive perceptual learning task. Nature Neurosci. 2002;5:1003–1009. doi: 10.1038/nn915. [DOI] [PubMed] [Google Scholar]
- Wig GS, Grafton ST, Demos KE, Kelley WM. Reductions in neural activity underlie behavioral components of repetition priming. Nature Neurosci. 2005;8:1228–1233. doi: 10.1038/nn1515. [DOI] [PubMed] [Google Scholar]
- Wiggs CL, Martin A. Properties and mechanisms of perceptual priming. Curr Opin Neurobiol. 1998;8:227–233. doi: 10.1016/s0959-4388(98)80144-x. [DOI] [PubMed] [Google Scholar]
- Wilson HR. Computational evidence for a rivalry hierarchy in vision. Proc Natl Acad Sci USA. 2003;100:14499–14503. doi: 10.1073/pnas.2333622100. [DOI] [PMC free article] [PubMed] [Google Scholar]
- Wilson HR, Cowan JD. Excitatory and inhibitory interactions in localized populations of model neurons. Biophysical Journal. 1972;12:1–24. doi: 10.1016/S0006-3495(72)86068-5. [DOI] [PMC free article] [PubMed] [Google Scholar]


