Abstract
Optical coherence tomography (OCT) has the potential to be a noninvasive method for hematocrit (HCT) measurement. This study shows the effect of erythrocyte aggregation at the level seen in healthy humans and pathological states on HCT measurement based on monitoring the slope changes in OCT depth reflectivity profile using spectral-domain optical coherence tomography (SDOCT). Our measurement indicates that the HCT estimated by SDOCT depends on the erythrocyte aggregation state and the flow rate. Measured HCT in blood samples with 0.6% and 2% dextran 500 is underestimated by 4.5%–10.5% and 17.1%–19.5% for HCT from 35%–55% at a flow rate of 4.7 mm/s. Underestimation is smaller at a high flow rate as compared to a low flow rate, indicating erythrocyte aggregation is an important factor that will affect accurate HCT measurement using SDOCT.
Index Terms: Erythrocyte aggregation, hematocrit (HCT), spectral-domain optical coherence tomography (SDOCT)
I. Introduction
Noninvasive monitoring of hematocrit (HCT) is important for many clinical applications, such as daily monitoring of blood hematocrit for patients with blood disorders, during dialysis, in an emergency room environment, and during surgery. HCT is defined as the ratio of the volume of packed red blood cells (RBCs) to the volume of whole blood. Various noninvasive methods, which differ not only in principle but also in the significance of their results, can be used to study HCT: ultrasound-based continuous HCT measurement [1] and near-infrared optical imaging [2]. Measurement of HCT has been widely studied with ultrasound, such as ultrasoundvelocity- based measurements and ultrasound-wave-attenuationbased measurements from the Doppler power spectrum [3], [4]. Recently, feasibility of noninvasive HCT measurement using spectral-domain low coherence interferometry/optical coherence tomography (LCI/OCT) has been demonstrated by Iftimia et al. [5]. They determined the value of HCT by monitoring changes of the slope of the LCI depth reflectivity profile as a function of RBCs by directly accessing small vessels of the retina. OCT in combination with retina tracking, using a relatively simple theoretical model to extract the HCT level from the depth reflectivity profile, does not require a complicated system and algorithm employed by multigate Doppler ultrasound.
It is well known that aggregation and disaggregation of RBCs are two important phenomena in the rheology of blood. For normal blood, rouleaux (2-D aggregates) are easily decomposed into their individual cell constituents as the blood flowincreases. In some pathological cases, however, the capillary circulation is seriously affected because nonseparable rouleaux are formed. Cerebrovascular accidents, acute myocardial infarctions, and diabetes are closely related to excessive RBC aggregation. Recently, RBC aggregation has been reported to have a significant effect on OCT signals in our and other studies [6]–[10]. In these studies, dextrans have been used to increase the refractive index of plasma and induce RBC aggregation that led to significant improvement in light penetration through circulating or steadystate blood measured by OCT. The results indicated that RBC aggregation can reduce OCT measured attenuation (scattering) of human blood at rest and in flow. As HCT is determined as a function of attenuation in blood, whereas the attenuation coefficient is calculated from the slope of the LCI/OCT depth reflectivity profile, a better understanding of the effect of blood aggregation on HCT measurement is essential for developing LCI/OCT methods as diagnostic tools for in vitro as well as in vivo blood analysis.
This study was to determine whether RBC aggregation at levels normally seen in the human and excessive RBC aggregation in some pathological cases affects HCT measurement based on the slope of depth reflectivity profile using spectral-domain optical coherence tomography (SDOCT) [11]. Our results indicate that there is a flow rate dependence on the HCT estimation.
II. Materials and Methods
A. Materials
The use of human blood for tests is considered as disadvantageous due to risk of infection, restricted availability, and relatively high cost. Bovine as well as porcine blood are practical due to sufficient availability and adequate quantities. The properties of porcine blood are more similar to human blood than those of bovine blood, particularly in RBC aggregation tendency [12]. For example, human and porcine blood naturally aggregate, but bovine blood shows little or no natural aggregation [13]. The results from blood tests with porcine blood can then be regarded as a safe estimation for human blood. Thus, porcine blood samples were used in our studies. Various HCT levels were obtained by mixing extracted RBCs with porcine plasma using ethylenediaminetetraacetic acid (EDTA) as an anticoagulant (Animal Technologies, Inc., Tyler, TX). Different suspensions of normal RBCs, artificially aggregated with dextran, were prepared. RBCs were resuspended in plasma of dextran 500 (Dx500, average molecular mass 500 kDa; Sigma, USA) at different HCTs (30% ≤ HCT ≤ 70%). A plasma dextran concentration of 0.6% [in weight/volume (w/v)] was used to induce the RBC aggregation in the range for healthy humans [14] and 2% to induce excessive aggregation.
B. SDOCT Measurement
Aschematic of theSDOCTsystem is shownin Fig. 1. Asuperluminescent diode (SLD) with a spectrum centered at 1310 nm and a full-width at half-maximum bandwidth of 95 nm and a total delivered power of 8 mW was used. Back-reflected light from the reference and sample arms was guided into a spectrometer and dispersed over a 1×1024 indium gallium arsenide (InGaAs) detector array at 7.7 kHz. The total wavelength range spreading on the detector array was 130 nm, corresponding to a spectral resolution of 0.13 nm and an imaging depth of 3.6 mm in air. The resulting axial resolution was about 8 μm [15]. The lateral resolution of the system was about 13.8 μm.
Fig. 1.
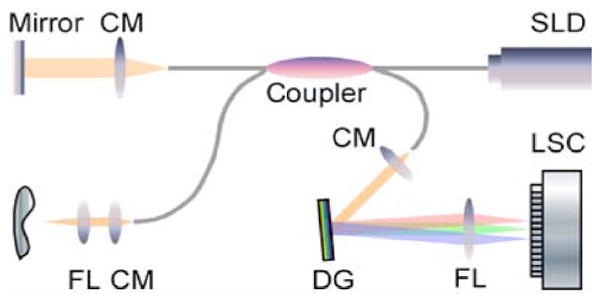
Schematic of a fiber-based SDOCT system used in the experiments (FL: focusing lens; DG: diffraction grating; CM: collimator; and LSC: line-scan camera).
All OCT measurements were performed just after RBC suspensions were prepared and pumped through a round glass capillary tube with a 300 μm inner diameter (VitroCom, Inc., Mountain Lakes, NJ). A programmable syringe pump (Harvard Apparatus, Holliston, MA) was used to make the blood flow with an approximately constant speed at a rate of 20 μL/min, corresponding to an average flow velocity of 4.7 mm/s within the glass capillary. In some experiments, the speed was at a rate of 42.5 (~10 mm/s) or 425 μL/min (~100 mm/s) for the blood samples with HCT = 45% (normal HCT in the human male). The flow rates in these experiments simulate the real values within major human retinal vessels with diameters >200 μm. The results would provide basic information for developing a method of OCT in combination with retinal tracking to achieve in vivo HCT measurement. After each OCT measurement, a small drop of blood sample from the other end was collected and smeared onto a glass slide for microscopy observation to investigate aggregation of the blood samples. OCT “M-scans” (a single A-line repeatedly acquired in time without transverse scanning) were performed. Two thousand OCT depth reflectivity profiles (A-lines) were averaged for each dataset. According to the single-scattering model, the attenuation coefficient (μt) of the sample can be obtained theoretically from the reflectance measurements at two different depths, z1 and z2 [7], [16]:
| (1) |
where Δz = |z1 − z2|. R(z1) and R(z2) represent the reflectance at depths z1 and z2, respectively. In this paper, the data of μt were obtained by linear fitting of the slope of the average profile to minimize noise. A single-scattering model is valid in this study because we limited our linear fitting to within 100 μm from the blood surface, which is much smaller than the mean reduced scattering length of the blood. Slope changes in (1) are a direct measure of the scattering coefficient μs-OCT, which depends upon the volume fraction of RBCs (i.e., HCT) provided, the influence of μa can be regarded as an approximately constant factor at around 1310 nm [17]. The decrease in attenuation by the addition of dextran was calculated according to
| (2) |
where the subscripts control and dextran refer to the samples without and with dextran, respectively. Triplicate samples were prepared and measured for each HCT. All final results of attenuation were means of triplicate experiments. A paired t-test statistical analysis was applied for the differences in attenuation between the control group (without dextran) and the treated group (with dextran). For all tests, a level of 0.05 was chosen as a significant level.
III. Results and Discussion
A. Correlation Between HCT and Slope
First, we evaluated the SDOCT system’s capability to discriminate between different HCT levels. OCT signals of the porcine blood samples with various HCT levels of 30%–70% without dextran at a flow rate of 4.7 mm/s were taken, and the slope (attenuation) of the OCT signal was computed. Representative OCT structure images and profiles for three different HCT values are shown in Fig. 2(a) and (b). It can be seen that the slope of the OCT signal increases as the HCT increases [Fig. 2(b)]. A higher HCT level means a higher scattering coefficient, and as a result, a bigger OCT slope.
Fig. 2.
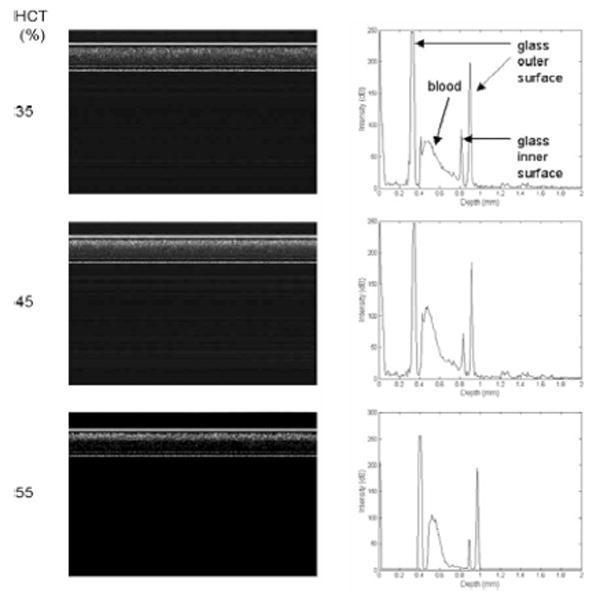
OCT structure images and depth reflectivity profiles for porcine blood samples with three different HCT values at a flow rate of 4.7 mm/s. The axial axis represents scan depth (0–3.6 mm) and the horizontal axis represents 2000 A-lines in OCT structure images.
In Fig. 3, attenuation (half of the slope) in the porcine blood is plotted against HCT. Discrete points are the measured data denoted by a “diamond”; a solid line represents the outcome of regression analysis of the first six data points; a dashed line is for fitting all the data points. As shown in Fig. 3, attenuation increases linearly with increasing HCT up to 55% according to the relationship:
Fig. 3.
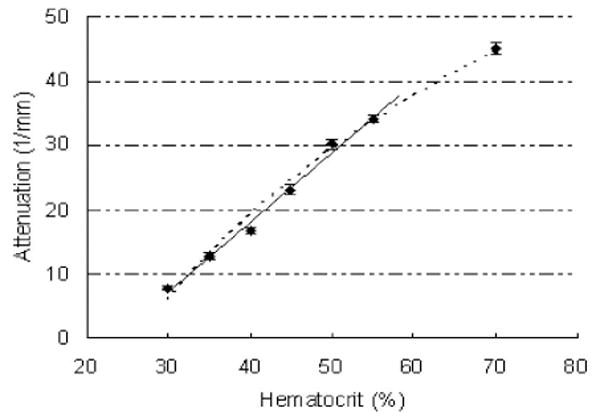
Attenuation in porcine blood measured against HCT.
| (3) |
The value of attenuation was averaged from triplicate samples (n = 3); the corresponding correlation coefficient for the linear fitting was calculated as R2 = 0.992. From (3), the HCT for porcine blood is calculated as
| (4) |
Contrary to the linear increase at lower HCT, for a higher HCT value of 0.7, the attenuation appears to decrease. A similar behavior has been described by Iftimia [5], where at very high concentrations of RBC, the scattering coefficient starts to saturate or even decrease. The slope change is smaller in Fig. 3 than the result in [3]. The inconsistency may be caused by different kinds of RBC and the light source wavelength used.
B. Dextran Effects
We investigated the effect of dextran by measuring the attenuation values of HCT ranging from 35% to 55% with 0.6% or 2% Dx500 (Fig. 4). For comparison, attenuation values of blood samples without dextran are also included. It can be seen that the attenuation decreases with the addition of dextran in plasma, and 2% dextran results in more decrease in attenuation than 0.6% dextran. The differences are between 22.7% and 9.9% for blood with 0.6% dextran (t-test, P < 0.01) and 55.5% and 31.2% for blood with 2% dextran (t-test, P < 0.01) with HCT in an increasing order. The estimated HCT calculated from the measured attenuation according to (4) against real HCT is plotted in Fig. 5. There is an underestimation of 4.5%–10.5% for the blood samples with 0.6% Dx500 and an underestimation of 17.1%–19.5% for blood samples with 2% Dx500.
Fig. 4.
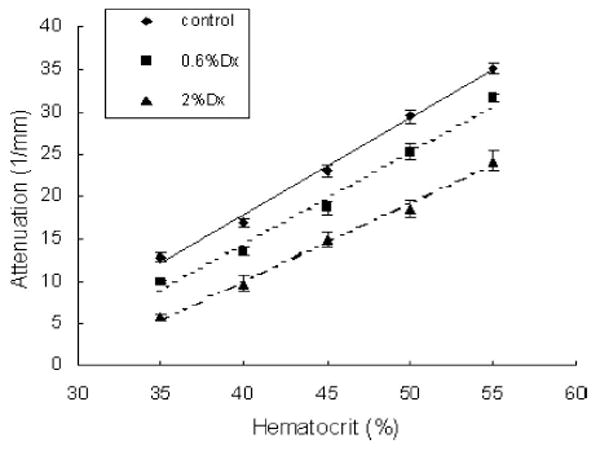
Attenuation in porcine blood with dextran measured against HCT.
Fig. 5.
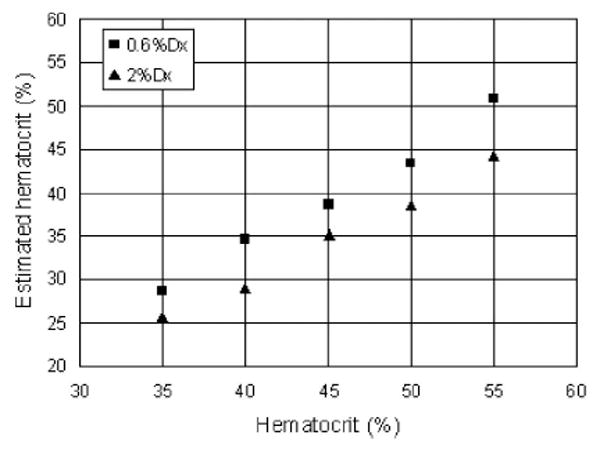
Comparison of the results calculated from SDOCT measurement and real HCT for porcine blood with dextran.
The underestimation for HCT measurement using SDOCT by the addition of dextran may first be explained by the refractive index matching effect [18]. The predominant source of scattering in blood is the difference in refractive index between the cytoplasm of RBCs (nbc) and plasma (nbp). According to a scattering model for blood described by Twersky [19], the attenuation coefficient is directly proportional to the difference in refractive index between the hemoglobin and suspending medium. Mie theory approximation also demonstrates that the reduced scattering coefficient is related to the ratio of nbc/nbp [18]. The scattering (attenuation) in blood can be reduced when the refractive index of plasma is increased with the addition of dextran [8]. The refractive indexes of porcine plasma (control) with 0.6% Dx and 2% Dx are 1.345, 1.350, and 1.357, respectively, measured by the SDOCT. Note that the refractive index of the porcine plasma increased by 0.37% and 0.9% with 0.6% and 2% dextran, corresponding to the more pronounced decrease in attenuation caused by 2% dextran. Refractive index matching effect also explains the greater decrease in attenuation at the smaller HCT for both dextran-treated samples.
Our previous studies have demonstrated that refractive index matching is not the only factor affecting blood scattering properties. Erythrocyte aggregation is more important in changing blood scattering property than refractive index matching [8]. In this study, RBC aggregate micrographs were taken with phase contrast microscopy with a 35-mm camera (Nikon microscope, ×40) after each OCT measurement. Fig. 6 shows the representative aggregation states among the control and the blood samples with 0.6% and 2% Dx500 (HCT = 45%) at a flow rate of 4.7 mm/s presented by the blood smear microscopy image. The control blood shows little or no aggregation phenomenon [Fig. 6(a)]; 0.6% Dx500 induces slight blood aggregation with short rouleaux [Fig. 6(b)]. Rouleaux and network aggregates are visualized in the blood with 2% Dx500, as depicted in Fig. 6(c). It corresponds well to other studies where dextran efficiency in producing aggregation increases with concentration up to a critical point. It is well known that the erythrocyte aggregation increases intensity of the transmitted light. It might be related to the decrease of the backscattered signal caused by a decrease in diffusing surfaces because of aggregation [20], [21]. Greater light transmission originating from decreased attenuation by the addition of dextran is observed from the OCT images in Fig. 6 (left).
Fig. 6.
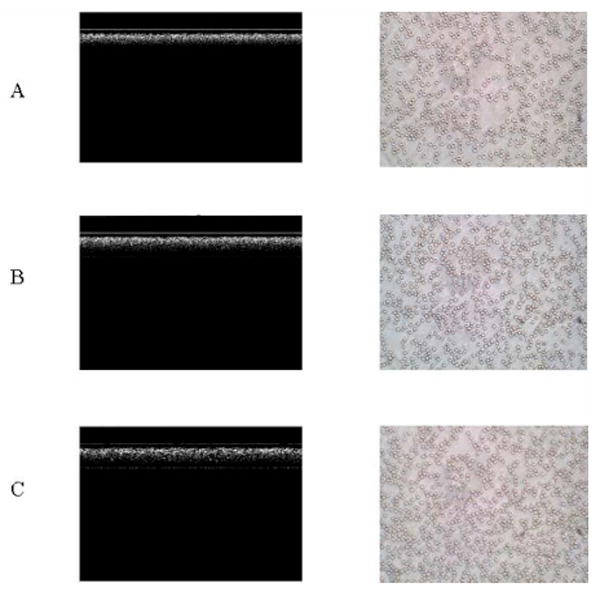
OCT images (left) and smear microscopy images (×40) (right) for blood at 45% HCT at a flow rate of 4.7 mm/s. A: control; B: with 0.6% Dx500; and C: with 2% Dx500. The axial axis represents scan depth (0–3.6 mm) and the horizontal axis represents 2000 A-lines in OCT structure images.
In order to further demonstrate that erythrocyte aggregation contributes to discrepancies when measuring HCT using the OCT depth reflectivity profile, attenuation in the blood samples at a higher flow rate (100 mm/s) was investigated. For normal blood, rouleaux are easily decomposed to their individual cell constituents as the blood flow (shear) increases. As expected, RBC aggregation is shear rate-dependent (Fig. 7, right). The levels of aggregation induced by both concentrations of dextran are lower at a higher flow rate of 100 mm/s than those at 4.7 mm/s (Fig. 6, right). The different aggregation phenomenon can also be seen by comparing the OCT structure images (Fig. 7, left).
Fig. 7.
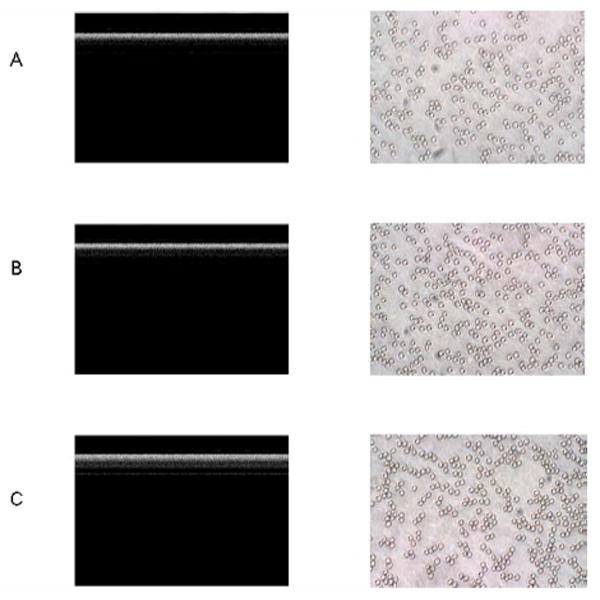
OCT images (left) and smear microscopy images (×80) (right) for blood at 45% HCT at a flow rate of 100 mm/s. A: control; B: with 0.6% Dx500; and C: with 2% Dx500. The axial axis represents scan depth (0–3.6 mm) and the horizontal axis represents 2000 A-lines in OCT structure images..
Correspondingly, a decrease in attenuation [Δμt calculated according to (2)] caused by the addition of dextran at a flow rate of 100 mm/s is much smaller than at a rate of 4.7 mm/s. Δμt values (HCT = 45%) at three flow rates are presented in Table I. The differences in Δμt between the blood samples at the two flow rates of 4.7 and 100 mm/s result from the lower levels of aggregation because flow rate only changes the blood aggregation. In addition, when the flow rate was only raised to 10 mm/s, there were no significant differences in Δμt for both 0.6% and 2% dextran-treated samples compared to the samples at a rate of 4.7 mm/s (Table I), corresponding to similar blood aggregation levels between the samples at these two flow rates. These experiments further support the suggestion that blood aggregation would affect accurate HCT measurement using SDOCT.
Table I.
Decrease in Attenuation (Δμt, %) Caused by Dextrans at Various Flow Rates
| Flow Sample\ | 4.7mm/s | 10mm/s | 100mm/s |
|---|---|---|---|
| 0.6%Dx500 | 9.8 | 9.1 | 5.9 |
| 2%Dx500 | 25.1 | 24.9 | 17.3 |
We noticed that there are some regions near the center of the tube with reduced scattering signals in the OCT images shown in Fig. 7(b) and (c). This may be due to the motion-induced signal fading at the center of a parabolic flow. It is well known that SDOCT systems suffer from inherent motion-induced artifacts, such as SNR reduction and fringe washout [22]. Axial motion causes fringe washout and decays the signal intensity by a factor of sinc2 (k0υ║τ/π), where k0 is the center wave number, υ║ is the axial flow velocity, and τ is the camera exposure time. For example, a 24.4 μs camera exposure time, 1.3 μm center wavelength, and an 86° Doppler angle induce about 1.0 dB (axial-motion-caused) SNR reduction for a 100 mm/s flow in our experiment. However, the maximum flow velocity at the center reaches 200 mm/s and causes ~4.3 dB SNR reduction. The SNR reduction caused by transverse flow motion is approximately , where υ⊥ is the transverse flow velocity and Δx is the transverse resolution of the system. The transverse-flow-induced SNR reduction is 0.48 dB for a peak flow of 200 mm/s in our system. The overall motioninduced SNR reductions caused a slightly reduced scattering band near the center of the tube, as shown in Fig. 7. The optimization of the experiment was possible by fine adjustment of the capillary tube to make the Doppler angle close to 90° so that the axial-motion-induced fringe washout and SNR reduction could be avoided, and the total motion-induced artifacts minimized. However, the motion-induced effects must be taken into consideration if much higher flow rates are studied. In addition, for large blood vessels, we may need to confine the linear fitting to a region near the vessel wall where the flow velocity is relatively low.
It should be pointed out that no significant fluctuations in hemoglobin concentration between the sample with dextran and the control were observed with the measurements of a B-hemoglobin photometer in our previous studies [7], [8]. Although the B-hemoglobin photometer is based on the principle of absorption characteristic of blood in an 800 nm band, the hemoglobin absorption occurring in the wavelength region used in this study (1310 nm) may have a negligible effect on the results because of its low absorption at 1310 nm. Changes in attenuation of blood with dextran may be attributed to the decrease in scattering by the addition of dextran.
IV. Conclusion
The principal finding of this study is that RBC aggregation and refractive index change in plasma cause a significant underestimation of HCT using OCT measurement. In order to develop a novel instrument based on OCT/LCI for in vivo measurements of the real value of blood HCT, compensation for the discrepancy caused by RBC aggregation is necessary since increased RBC aggregation has been observed in various pathological states. Developing methods such as Doppler OCT [23] that allows simultaneous measurements of RBC aggregation and HCT are essential for accurate determination of HCT. Alternatively, a calibration method to retrieve accurate values of HCT from underestimated ones may be a way to resolve the problem.
Acknowledgments
This work was supported in part by the National Institutes of Health under the Research Grant EB-00293, Grant CA-91717, and Grant RR-01192, in part by the Air Force Office of Scientific Research under Grant FA9550-0401-0101, in part by the Beckman Laser Institute Endowment, in part by the National Natural Science Foundation of China under Grant 30470426, and in part by Zhejiang Provincial Natural Science Foundation under Grant X206958.
Biographies

Xiangqun Xu received the B.Sc. degree in biochemistry from Xiamen University, Xiamen, China, in 1985, the M.Sc. degree in biochemistry from Zhejiang Medical University, Hangzhou, China, in 1997, and the Ph.D. degree in biomedical engineering from Keele University, Keele, U.K., in 2003.
She was engaged in postdoctoral training in biomedical optics at Cranfield University, U.K. She is currently a Professor in biomedical engineering at Zhejiang Sci-Tech University, Hangzhou. Her current research interests include medical imaging, diagnostic spectroscopy, and the application of optics in medicine.

Lingfeng Yu received the B.S. degree in precision instrument from Tsinghua University, Beijing, China, in 1998, and the M.Phil. and Ph.D. degrees in mechanical engineering from Hong Kong University of Science and Technology, Kowloon, Hong Kong, in 2001 and 2003, respectively.
He was a Postdoctoral Research Fellow with the Biophysics and Biomedical Physics Division, Department of Physics, University of South Florida. He is currently a Postdoctoral Researcher in the Department of Biomedical Engineering, Beckman Laser Institute, University of California, Irvine. He is the author or coauthor of more than 20 peer-reviewed journal articles. His current research interests include optical coherence tomography, optical Doppler tomography, digital holographic imaging, quantitative phase-contrast microscopy, and 3-D microscopy.
Dr. Yu was awarded the Alexander von Humboldt Fellowship of Germany in 2005.

Zhongping Chen received the B.S. degree in applied physics from Shanghai Jiao Tong University, Shanghai, China, in 1982, the M.S. degree in electrical engineering and the Ph.D. degree in applied physics from Cornell University, Ithaca, NY, in 1987 and 1993, respectively.
He is currently a Professor and the Vice Chair of the Department of Biomedical Engineering, University of California, Irvine. He is the author or coauthor of more than 100 peer-reviewed papers and review articles. He holds a number of patents in the fields of biomaterials, biosensors, and biomedical imaging. His current research interests include biomedical photonics, microfabrication, biomaterials, and biosensors.
Dr. Chen is a Fellow of the American Institute of Medical and Biological Engineering (AIMBE) and the Optical Society of America. He is a Co-Founder of the Optical Coherence Tomography (OCT) Medical Imaging, Inc.
Contributor Information
Xiangqun Xu, School of Science, Zhejiang Sci-Tech University, Hangzhou 310018, China (xuxiangqun@zstu.edu.cn).
Lingfeng Yu, Beckman Laser Institute, University of California, Irvine, CA 92612 USA (yulingfeng@gmail.com).
Zhongping Chen, Beckman Laser Institute, University of California, Irvine, CA 92612 USA (z2chen@uci.edu).
References
- 1.Johner C, Chamney P, Schnedity D, Krämer M. Evaluation of an ultrasonic blood volume monitor. Nephrol Dial Transplant. 1998;13:2098–2103. doi: 10.1093/ndt/13.8.2098. [DOI] [PubMed] [Google Scholar]
- 2.Schmitt JM, Guan-Xiong Z, Miller J. Measurement of blood hematocrit by dual-wavelength near-IR photoplethsymography. Proc SPIE. 1992;1441:150–161. [Google Scholar]
- 3.Secomsky W, Nowicki A, Guidi F, Tortoli P. IEEE Ultrason Symp. Vol. 2. Atlanta, GA: 2001. Estimation of hematocrit by means of attenuation measurement of ultrasonic wave in human blood; pp. 1277–1280. [Google Scholar]
- 4.Secomsky W, Nowicki A, Guidi F, Tortoli P, Lewin PA. Noninvasive measurement of blood hematocrit in artery. Bull Polish Acad Sci. 2005;53:245–250. [Google Scholar]
- 5.Iftimia NV, Hammer DX, Bigelow CE, Rosen DI, Ustun T, Ferrante AA, Vu D, Ferguson RD. Toward noninvasive measurement of blood hematocrit using spectral domain low coherence interferometry and retinal tracking. Opt Exp. 2006;14:3377–3388. doi: 10.1364/oe.14.003377. [DOI] [PubMed] [Google Scholar]
- 6.Brezinski M, Saunders K, Jesser C, Li X, Fujimoto J. Index matching to improve OCT imaging through blood. Circulation. 2001;103:1999–2003. doi: 10.1161/01.cir.103.15.1999. [DOI] [PubMed] [Google Scholar]
- 7.Tuchin VV, Xu X, Wang RK. Dynamic optical coherence tomography in optical clearing, sedimentation and aggregation study of immersed blood. Appl Opt. 2002;41:258–271. doi: 10.1364/ao.41.000258. [DOI] [PubMed] [Google Scholar]
- 8.Xu X, Wang RK, Elder JB, Tuchin VV. Effect of dextraninduced changes in refractive index and aggregation on optical properties of whole blood. Phys Med Biol. 2003;48:1205–1221. doi: 10.1088/0031-9155/48/9/309. [DOI] [PubMed] [Google Scholar]
- 9.Xu X, Wu L, Wang RK. Optical clearing of blood by dextrans. Proc SPIE. 2003;5149:21–28. [Google Scholar]
- 10.Yu Kirillin M, Priezzhev AV, Tuchin VV, Wang RK, Myllylä R. Effect of red blood cell aggregation and sedimentation on optical coherence tomography signals from blood samples. J Phys D, Appl Phys. 2005;38:2582–2598. [Google Scholar]
- 11.Fercher AF, Hitzenberger CK. Measurement of intraocular distances by backscattering spectral interferometry. J Opt Commun. 1995;117(5):43–48. [Google Scholar]
- 12.Yuan YW, Shung KK. Ultrasonic backscattering from flowing whole blood. I: Dependence on shear rate and hematocrit. J Acoust Soc Amer. 1988;84:52–58. doi: 10.1121/1.397238. [DOI] [PubMed] [Google Scholar]
- 13.Cardoso AV, Camargos AO. Geometrical aspects during formation of compact aggregates of red blood cells. Mater Res. 2002;5:263–268. [Google Scholar]
- 14.Bishop J, Nance PR, Popel AS, Intaglietta M, Johnson PC. Effect of erythrocyte aggregation on velocity profiles in venules. Amer J Physiol Heart Circ Physiol. 2001;280:H222–H236. doi: 10.1152/ajpheart.2001.280.1.H222. [DOI] [PubMed] [Google Scholar]
- 15.Ahn YC, Jung W, Chen Z. Turbid two-phase slug flow in a microtube: Simultaneous visualization of structure and velocity field. Appl Phys Lett. 2006;89:064109-1–064109-3. [Google Scholar]
- 16.Schmitt JM, Knüttel A, Bonner RF. Measurement of optical properties of biological tissues by low-coherence reflectometry. Appl Opt. 1993;32:6032–6042. doi: 10.1364/AO.32.006032. [DOI] [PubMed] [Google Scholar]
- 17.Roggan A, Friebel M, Dorschel K, Hahn A, Mueller G. Optical properties of circulating human blood in the wavelength range 400–2500 nm. J Biomed Opt. 1999;4:36–46. doi: 10.1117/1.429919. [DOI] [PubMed] [Google Scholar]
- 18.Tuchin VV. Optical Clearing of Tissue and Blood. PM 154. Bellingham, WA: SPIE Press; 2005. [Google Scholar]
- 19.Twersky V. Absorption and multiple scattering by biological suspensions. J Opt Soc Amer. 1970;60:1084–1093. doi: 10.1364/josa.60.001084. [DOI] [PubMed] [Google Scholar]
- 20.Shvarrtsman LD, Fine I. Optical transmission of blood: Effect of erythrocyte aggregation. IEEE Trans Biomed Eng. 2003 Aug;508:1026–1033. doi: 10.1109/TBME.2003.814532. [DOI] [PubMed] [Google Scholar]
- 21.Enejder AMK, Swartling J, Aruna P, Andersson-Engels S. Influence of cell shape and aggregate formation on the optical properties of flowing whole blood. Appl Opt. 2003;42:1384–1394. doi: 10.1364/ao.42.001384. [DOI] [PubMed] [Google Scholar]
- 22.Yun SH, Tearney G, de Boer J, Bouma B. Motion artifacts in optical coherence tomography with frequency-domain ranging. Opt Exp. 2004;12:2977–2998. doi: 10.1364/opex.12.002977. [DOI] [PMC free article] [PubMed] [Google Scholar]
- 23.Wang L. Ph.D. dissertation. Dept. Electr. Eng. Comput. Sci., Univ; California, Irvine: 2004. Development of phase-resolved optical Doppler tomography for imaging and quantifying flow dynamics and particle size in microfluidic channels. [Google Scholar]


