

Abstract
The goals of this investigation were to illustrate the use of pharmacokinetic (PK)/pharmacodynamic (PD) modeling strategies in drug development based on a multiple-dose study of gefitinib in a preclinical tumor model. Mice bearing subcutaneous LN229-wild-type EGFR or LN229-EGFRvIII mutant (a sensitizing mutation) tumors were administered gefitinib at oral doses of either 55 mg/kg/d PO × 15 days or 30 mg/kg/d PO × 15 days, respectively, as dictated by the equivalent PK/PD dosing strategy. In each tumor group, gefitinib plasma and tumor concentrations were quantitated, as well as the tumoral amounts of phosphorylated-ERK1/2 (pERK), a selected PD endpoint, and tumor size. The resultant data provided the basis to develop hybrid physiologically-based PK/PD/tumor growth models for each tumor type. It was found that the 1.83-fold dose difference administered to the two tumor groups resulted in analogous pERK profiles on both Days 1 and 15, and further induced similar antitumor efficacy based on tumor size. In addition, using brain tumor patient PK data linked to the pERK PD model, simulations were conducted to illustrate potential applications of a target tumor model to patients. The simulations provided insight on the relationships between blood-brain barrier penetration, brain tumor gefitinib concentrations and the extent of inhibition of pERK. The implementation of the PK/PD equivalent dosing strategy offers a new approach to drug development.
Keywords: PK/PD modeling, tumor growth model, EGFR inhibitor, brain tumors, model simulations
Introduction
The epidermal growth factor receptor (EGFR) is an important anticancer drug target based on its role in tumor cell proliferation, and the fact it is overexpressed or mutated in many cancers, such as malignant gliomas in which it is altered in over 50% of patients (1). The activation of EGFR, located on the cell membrane, causes activation of key downstream signaling pathways, notably ERK and PI3K-AKT, which are involved with the maintenance of the cancer phenotype of unabated growth and inhibition of apoptosis (2). Therapeutic intervention of EGFR signaling has included antibodies (i.e. Cetuximab) binding to the extracellular domain, and small molecule inhibitors, such as erolitinib and gefitinib that competitively bind to intracellular kinase domains. The clinical activity of these agents is the subject of numerous trials, mostly as part of combination chemotherapeutic strategies (1, 3). In an effort to define a role for anti-EGFR therapy, a number of EGFR gene mutations have been identified that are associated with drug sensitivity or resistance. One mutation in the EGFR gene, known as the vIII mutant, causes constitutive activation and of its signaling partners, is prominent in 27–64% of glioma patients with overexpressed EGFR, and causes sensitization to EGFR inhibitors, particularly in the presence of normal phosphatase and tensin homolog (PTEN) (4, 5). It is likely that anti-EGFR therapy will be integrated into the fabric of cancer chemotherapy in a number of cancer types in the foreseeable future.
There has been a resurgence in drug discovery and development approaches attributed, in part, to the failure of past strategies overly focused on high-throughput screens, to the limited number of new drug approvals by the FDA, and to the explosion of potential new drug targets afforded by the human genome. A recent panel, the Translational Research Working Group for anticancer drug development (6), highlighted many issues confronting the drug development community and considered the importance of preclinical PK studies. This is not a new idea, and in the FDA Critical Path Initiative and subsequent documents, the desire for model-based drug development was recognized as an important fundamental direction (7). Although these initiatives are timely and stimulate discussion, the lack of attention to how preclinical PK and PD investigations should be conducted and integrated into a global translational effort is apparent. Our efforts in this regard have highlighted the importance of examining drug disposition and dynamics in target tissues that allows comprehensive PK/PD models to be derived and extrapolated to predict pharmacological characteristics in patients (8, 9).
The combination of model-based drug development and burgeoning interest in EGFR inhibitors led to our first study on gefitinib (9). This study employed LN229 EGFR wild-type and vIII mutant tumors and single doses of gefitinib to contrast the PD response by measuring pERK in tumors. The resultant PK/PD models of gefitinib in each tumor type were used to illustrate the concept of equivalent PK/PD dosing that devised multiple-dose regimens to achieve the same degree of pERK inhibition. To assess the validity of the equivalent PK/PD methodology, the current investigation completed multiple-dose trials in wild-type EGFR and EGFRvIII mutant tumor groups, and extended the associated PK/PD models to a preclinical efficacy model based on tumor size, and finally to brain tumor patients.
Materials and Methods
Chemicals and reagents
Gefitinib was supplied by Polymed Therapeutics Inc. LN229-wild-type EGFR cell line was purchased from the American Type Culture Collection. LN229-EGFRvIII mutant cell line was kindly provided by Dr. W.K. Cavenee (University of California, San Diego, CA). The following reagents were purchased from commercial suppliers: DMEM (Mediatech Inc., Manassas, VA); heat-inactivated FBS (Invitrogen, Carlsbad, CA); penicillin and streptomycin (GIBCO-BRL, Carlsbad, CA); Matrigel matrix (Becton Dickinson, Franklin Lakes, NJ); and ELISA kit to measure pERK (R&D systems, Minneapolis, MN).
Tissue culture
Human glioblastoma cell lines LN229-wild-type EGFR and LN229-EGFRvIII mutant were cultured in DMEM supplemented with 10% heat-inactivated FBS, 100 U/mL penicillin, and 100 µg/mL streptomycin in a humidified atmosphere with 5% CO2 at 37 °C.
Design of gefitinib dosing regimens for EGFR wild-type and vIII mutant tumor-bearing groups
The design of gefitinib multiple-dose regimens for EGFR-wild-type and vIII mutant tumor-bearing mice was performed in a series of steps that culminated in the selection of gefitinib doses of 55 mg/kg/d PO × 15 days in the wild-type tumor group and 30 mg/kg/d PO × 15 days in the vIII mutant tumor group. The goal of these steps that employed the PK/PD model derived from our single dose studies (9) was to identify gefitinib doses that produced equivalent pERK profiles in each tumor group based on maximum gefitinib tumor concentrations of 15 µg/g in wild-type EGFR tumors. This concentration was targeted since it was within the range of values reported in brain tumor patients (10). The model-predicted pERK inhibition nadirs and area between the effect curves (ABEC) values, a measure of the cumulative degree of inhibition, at the designated equivalent doses were 0.36 vs. 0.35 and 132 vs. 129 for the EGFR wild-type and the vIII mutant tumor group, respectively. ABEC is determined as the difference between the baseline value of pERK (equal to 1 without drug present) to the pERK values obtained following inhibition due to gefitinib, and as a cumulative measure, in this case drug response, is complimentary to the area under the drug concentration-time curve or AUC that measures the cumulative drug exposure.
In vivo experiments of gefitinib in xenografts of EGFR-wild-type and mutant tumors
Animal and tumor implantation methods were analogous to those previously reported (9). All animal studies were approved by the Institutional Animal Care and Use Committee. Male adult (20–25 g) athymic swiss mice (nu/nu) bearing subcutaneous xenografts of EGFR-wild-type and vIII mutant tumors of about 0.3 mL volume were randomly assigned to control or gefitinib treatment groups. In the wild-type EGFR tumor group, gefitinib was administered at a dose of 55 mg/kg/d PO × 15 days, whereas in the vIII mutant tumor group the dose was 30 mg/kg/d PO × 15 days by oral gavage. Both the wild-type and vIII mutant tumor vehicle-control groups were administered with 1% polysorbate-80 at 0.4 mL/d PO × 15 days. Gefitinib PK/PD investigations were conducted in the treatment group on both Day 1 and Day 15 by using a serial sacrifice study design with blood and tumor samples collected at predose, 0.5, 2, 4, 8, 12 and 24 hours. For both treatment and control groups, tumor sizes were measured every 3 days throughout the multiple-dose administrations.
Gefitinib and pERK analyses
Gefitinib concentrations in plasma and tumor homogenate were measured by using an electrospray ionization LC/MS/MS system (Applied Biosystems) as previously described (9). Detailed procedures for the preparation and analysis of pERK in tumor samples were analogous to those previously published (9).
Preclinical PK, PD and tumor growth models
PK, PD, and tumor growth models were developed with the SAAMII software (version 1.2, University of Washington, Seattle, WA; ref.11) based on a sequential modeling approach of first defining the PK model, then the PD model, and finally the tumor growth model.
A physiologically-based hybrid PK model (see Figure 1) for each tumor group was developed based on the observed plasma and tumor gefitinib concentrations from both Day l and Day 15. Model variables of bioavailability (F), volume of distribution of the central compartment (Vc), absorption rate constant (Ka) and tumor blood flow rate (Q) were set equal to those obtained from the single-dose gefitinib PK/PD models (9) in which IV and oral drug administrations were utilized. The model-estimated variables in each tumor group were the elimination rate constant (K10), inter-compartmental rate constants (K12, K21) and tumor to plasma partition coefficient (Ri). An exponential equation describing the actual mean tumor volumes (Vt) in wild-type and mutant EGFR tumor groups during the 15 days treatment was incorporated into the respective PK models to account for the volume changes.
Figure 1.

Schematic representation of a hybrid PK/PD/tumor growth model consisting of a 2-compartment systemic disposition model, a 1-compartment tumor model, a 2-compartment target-response model and a Gompertz tumor growth model. The model was developed based on a sequential modeling approach of first defining the PK model, then the PD model, and finally the tumor growth model. The PK model variables included the elimination rate constant (K10), volume of distribution in the plasma compartment (Vc), inter-compartment transfer rate constants (K12, K21), absorption rate constant (Ka), bioavailability (F), blood flow rate (Q), tumor to plasma partition coefficient (Ri). The tumor volume (Vt) was represented by an exponential equation describing the actual mean tumor volumes during the 15 days treatment. The PD model variables included tumor drug concentration for 50% inhibition of pEGFR (IC50), the zero-order rate constant for the formation of pEGFR (Kin), the rate constant from the drug target compartment (pEGFR) to the response compartment (pERK) (Ktr), and a first-order rate constant for degradation and dephosphorylation of pERK (Kout), which was expressed by an exponential equation Kout = Kout (0) (−r·time) in order to describe the change of Kout during the 15 days treatment, in which Kout(0) represents the baseline Kout level and r is the arbitrary constant associated with the reduction of Kout. The pEGFR0 and Imax were fixed as 1. The tumor growth model included the rate constants for exponential and linear tumor growth (Kgexp and Kgzero), a first-order rate constant representing the signal propagation between the inhibitory compartments (Ksp), and γ, a variable that mediates the switch from the exponential to linear tumor growth.
Once the hybrid PK models were finalized, the associated PK variables were held constant and linked to the associated EGFR wild-type and vIII mutant tumor PD models that used the fraction of baseline pERK in the tumor as the PD response. A 2-compartment target-response model (9) was applied to the PD observations on both Day 1 and Day 15, in which the target compartment represented pEGFR, and the response compartment represented pERK (see Figure 1). The best-fit hybrid PK/PD models were evaluated according to the statistical criteria provided by the SAAM II program including the minimization of the objective function, the Akaike information criteria and the precision of variable estimation as measured by the coefficient of variations.
Finally, a Gompertz tumor growth model (12) was linked to the final PD model for each tumor group by using pERK as the biomarker. The tumor growth model and link scheme to the PD model (see Figure 1) was analogous to that used previously for a TGF-β kinase antagonist, LY2157299, in which phosphorylation of Smad was the PD endpoint (13). The rate equation for the tumor growth models was:
where TS is the tumor size; Kgexp and Kgzero are the rate constants for exponential and linear tumor growth, respectively; γ is a variable that mediates the switch from the exponential to linear tumor growth, and was fixed to 0.34 by model simulations. INH2 represents the final growth inhibitory signal due to gefitinib that was transmitted through a series of steps from INH0 (pERK inhibition) and another signal transduction compartment INH1. The rate equations for INH0, INH1 and INH2 are listed as followed:
where Ksp is a first-order rate constant representing the signal propagation between the inhibitory compartments. INH0, INH1 and INH2 are equal to 0 for the baseline condition or control group. The tumor growth models for each tumor group were derived in a sequential manner by estimating values for Kgexp, Kgzero in the control group first, and then estimating Ksp in the gefitinib treated groups.
Clinical PK/PD models
Previously published PK data in cancer (14, 15) and brain tumor (16, 17) patients permitted the development of a compartmental PK model that described gefitinib plasma concentrations (see Supplementary Method S1). Since those studies employed noncompartmental analyses, the two studies (14, 15) that provided graphs of gefitinib plasma concentrations were digitized so that compartmental models could be developed. The net result of this exercise yielded a 1-compartment model with first-order absorption and elimination to characterize gefitinib plasma concentrations for multiple-dose regimens in brain tumor patients not receiving enzyme-inducing anti-eplileptic drugs (EIAEDs) since these agents can alter the PKs of gefitinib (16, 17). This model was then used as input into a physiologically-based blood flow-limited model that predicted gefitinib’s brain tumor concentrations. The model for brain tumor was based on patient data reported by Hofer (10) and Lassman (18) in which a small number of tissue samples from surgically resected malignant gliomas were analyzed for gefitinib. In 4 patients (2 from each study), the gefitinib brain tumor/plasma concentration ratio ranged from about 2 to 13 supporting appreciable drug penetration in tumor, and the use of a blood flow-limited model in brain tumor. These tumor/plasma concentration ratios also can be used to estimate the range of partition coefficient values likely to be encountered in patients. The blood flow-limited model structure also required estimates of tumor volume (i.e. 50 mL) and blood flow (i.e. 2400 mL/h) that were taken from previously published work (8). The complete PK model for gefitinib in brain tumor patients consisted of the 1-compartment model that generated plasma concentrations of gefitinib for input into the blood flow-limited brain tumor compartment.
The PK model was linked directly to the preclinical PD pERK models for either wild-type EGFR or mutant vIII EGFR tumors. Two simulation exercises were completed; one, to determine the gefitinib dose that predicted equivalent pERK profiles in the two tumor types, and two, to examine the effect of gefitinib brain tumor concentrations as set by the tumor/plasma partition coefficient on the percent inhibition of pERK at the nadir. Both simulations were done in the context of a multiple-dose regimen of gefitinib administered every 24 hours for 15 days to ensure steady-state was achieved.
Results
Preclinical PK model of gefitinib in mice bearing wild-type and vIII mutant EGFR tumors
Hybrid physiologically-based PK models (see Figure 1) were applied to describe the multiple dose PK data from both Day 1 and Day 15. The preclinical hybrid PK models, one for the wild-type EGFR and the other for the mutant vIII tumor groups, were applied simultaneously to observed plasma and tumor gefitinib concentrations collected on Days 1 and 15. The best-fit PK models identified by this procedure consisted of two-compartment systemic models linked to single blood flow-limited tumor compartments, which were analogous to those found following single doses of gefitinib (9). Similar to the single-dose PK models, the estimated gefitinib tumor to plasma partition coefficient (Rt) was much greater than 1, indicating high tumor penetration. It can be seen that the predicted plasma and tumor concentration profiles on Day 1 and Day 15 generally agreed with the observed values (see Figure 2), and that the estimated variables were reliably estimated with low coefficients of variation (see Table 1). Specifically, both the plasma and tumor gefitinib model-predicted and observed areas under the concentration-time curves for each tumor group were within 20% of one another. For each tumor group, the plasma and tumor gefitinib concentration profiles were similar between Day 1 and Day 15, with less than 16% differences in the observed area under the concentration-time curves, suggesting gefitinib obeyed linear pharmacokinetic properties with no apparent saturable or time-dependent processes altering the PK behavior on Days 1 and 15. It was anticipated that higher plasma and tumor concentrations would be obtained in the wild-type tumor group compared to the vIII mutant tumor group given the approximate 1.83-fold dose difference between the two tumor groups. Moreover, and consistent with model linearity the two tumor types possessed similar model predicted parameters except the intercompartment rate constant K(12) (see Table 1), and thus, the dose difference accounts for the major differences in actual gefitinib concentrations.
Figure 2.
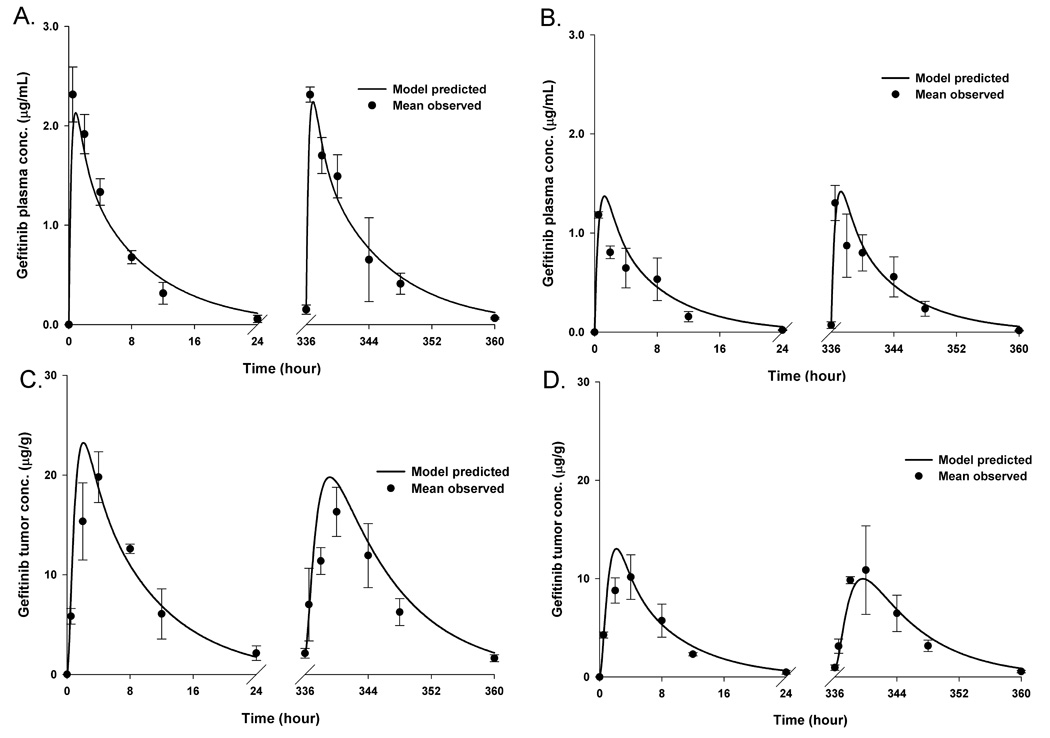
The PK model-predicted (―――) and mean (n = 3–4) observed (●) gefitinib concentrations for plasma (A), tumor (C) of LN229-wild-type EGFR tumor bearing group and plasma (B), tumor (D) of LN229-EGFRvIII mutant group, respectively. Bars = ± 1 SD. The multiple dose regimens consisted of 55 mg/kg/d PO × 15 days and 30 mg/kg/d PO × 15 in LN229-wild-type EGFR and LN229-EGFRvIII mutant tumor-bearing groups, respectively. Physiologically-based hybrid PK models were fitted to the observed plasma and tumor gefitinib concentrations from both Day l and Day 15.
Table 1.
PK, PD and tumor growth model parameters of gefitinib in LN229-wild-type EGFR and LN229-EGFRvIII mutant tumor bearing athymic mice following 55 mg/kg/d PO × 15 days and 30 mg/kg/d PO × 15 days administrations, respectively.
| Variables | LN229-wild-type EGFR tumor bearing group |
LN229-EGFRvIII mutant tumor bearing group |
|
|---|---|---|---|
| PK model | F | 0.45 | 0.52 |
| K(10) (h−1) | 0.54 (1.6)* | 0.40 (1.6) | |
| K(12) (h−1) | 1.65 (6.7) | 0.74 (8.3) | |
| K(21) (h−1) | 0.55 (6.3) | 0.50 (7.2) | |
| Ka (h−1) | 0.88 | 0.82 | |
| Q (mL.h−1) | 4.5 | 4.4 | |
| Rt | 13.7 (2.1) | 10.7 (2.0) | |
| Vc (mL) | 75.0 | 103.8 | |
| Vt (mL) | 0.2819e0.0024·time | 0.2693e0.0036·time | |
| PD model | IC50 (µg/g) | 25.5 (20.2) | 9.8 (22.6) |
| Kin (h−1) | 4.5 | 5.3 | |
| Kout(0) (h−1) | 6.4 (7.3) | 6.7 (9.6) | |
| r | 0.0006 (30.5) | 0.0005 (42.8) | |
| Ktr (h−1) | 2.2 (20.0) | 1.4 (24.7) | |
| Tumor growth model |
Kgzero (h−1) | 6.1(147.7) | 27.6 (52.3) |
| Kgexp (h−1) | 0.14 (342.9) | 0.034 (46.0) | |
| Ksp (h−1) | 1.3 (3.45) | 1.0 (4.7) | |
| Gamma | 0.34 | 0.34 | |
Values represent mean (% coefficient of variation) of model fitted variables.
PD model of gefitinib in wild-type and vIII mutant EGFR tumors
The PD model was fitted to the combined Day 1 and Day 15 pERK observations for both the wild-type EGFR and mutant vIII EGFR tumor groups. Each treatment group showed a relatively rapid decline in pERK with nadirs within 2 to 4 hours following a gefitinib dose, and about 70–80% baseline return at 24 hours for each tumor type (see Figure 3). In both tumor groups, more profound nadirs were observed on Day 1 (0.39, 0.37) compared to Day 15 (0.50, 0.47), which suggested the development of mild resistance to gefitinib over the 15-day treatment period. The ABEC values further supported mild resistance to suppression of pERK by gefitinib, with observed ABEC values (fraction of baseline pERK × day) decreasing from 11.3 on Day 1 to 8.7 on Day 15 in the wild-type tumor group, and from 9.8 on Day 1 to 7.3 on Day 15 in the vIII mutant tumor group. To account for the augmented pERK response over the 15-day treatment period, it was found that a time-dependent exponential function for Kout (Kout = Kout(0) (-r·time), in which Kout(0) represents the baseline Kout value and r is the arbitrary constant) a variable reflecting the dephosphorylation and degradation of pERK best characterized this phenomenon. Alternate approaches of applying time-dependent functions to Kin and Ktr did not properly characterize the pERK profiles; however at this time, a specific mechanism for reduced dephosphorylation/degradation of pERK on Day 15 is unknown. The drug resistant phenomenon was not due to altered gefitinib PKs as both plasma and tumor exposures were similar on Days 1 and 15. The exponential functions for Kout in each tumor group were quite similar (see Table 1), and thus, whatever the underlying mechanism it is not unique to a particular tumor type.
Figure 3.
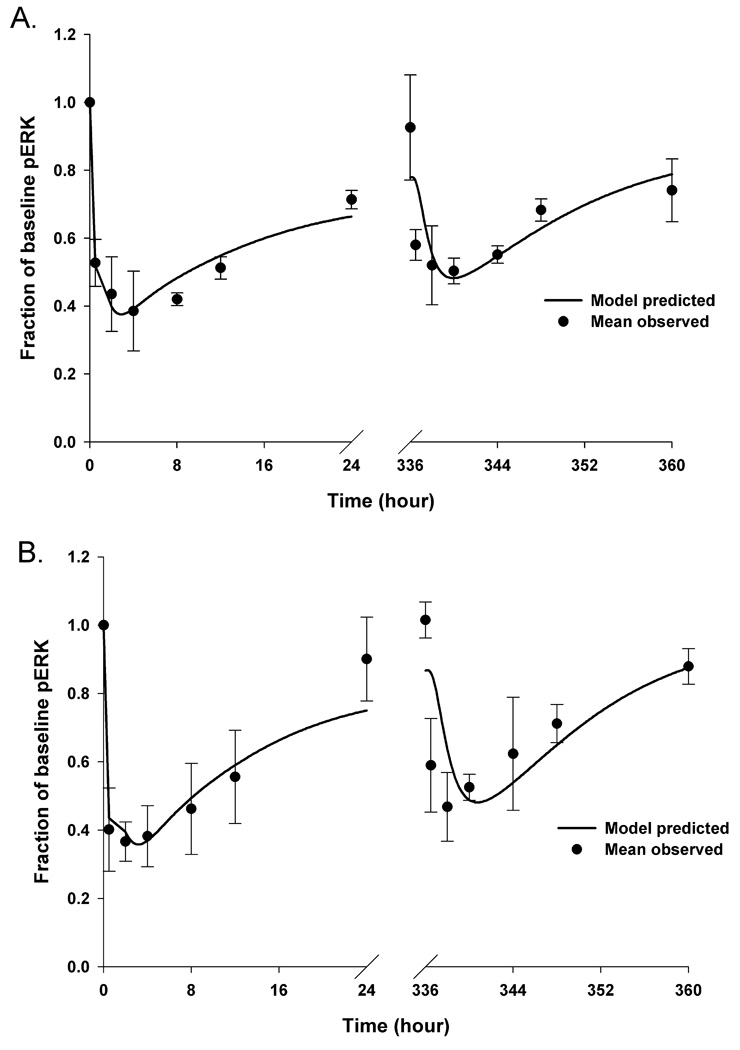
The PK/PD model-predicted (―――) and mean (n = 3–4) observed (●) fractional inhibition of pERK for wild-type tumor group (A) and vIII mutant tumor group (B), respectively. Bars = ± 1 SD. Once the hybrid PK models were finalized, the associated PK variables were held constant and linked to a 2-compartment target-response model, consisting of a target compartment representing pEGFR, and a response compartment representing pERK, which was applied to the PD observations on both Day 1 and Day 15.
In the modeling process, the baseline pEGFR0 and Imax were set to 1 according to the assumption that the phosphorylation of pEGFR was not inhibited in the absence of gefitinib treatment, and that it could be fully inactivated if the drug concentration in the tumor is sufficiently high. In order to reduce the parameter estimation difficulties, the values of Kin, a variable that represents the formation of pEGFR, were set equal to those obtained from the single-dose gefitinib PK/PD models, based on the assumption that the rate of change in pEGFR is dependent on the tumor cell line, and not a factor in resistance to gefitinib. The 2.5-fold greater IC50 value in the wild-type tumor group was consistent with the lower drug sensitivity seen in vitro in wild-type tumor cells compared to the mutant vIII EGFR cells (9). The other PD model variable, Ktr, reflects the signaling efficiency from pEGFR and pERK, and was estimated to be 2.2 h−1 and 1.4 h−1 for the wild-type tumor and the vIII mutant tumor, respectively. All of the estimated PD variables are listed in Table 1. Overall, the model-predicted pERK profiles agreed with the actual measurements of pERK in tumors for both tumor groups (see Figure 3) with the differences between model-predicted and observed ABEC values being less than 11% on both Days 1 and 15. The greatest discrepancies in singular values were the pre-dose values on Day 15 that were near baseline and underpredicted by about 15 – 20%. Unlike Day 1 we did not assume the pre-dose pEGFR0 was equal to 1 on Day 15.
Tumor growth model
A tumor growth model was applied to characterize the size of the EGFR wild-type and EGFRvIII mutant xenografts, in which the growth inhibitory signal was assumed to be due to the extent of pERK inhibition. In this case, it was assumed that the control and gefitinib treatment groups had equivalent values for Kgexp, Kgzero, and gamma, and the inhibitory action of gefitinib on tumor growth was transmitted through the signalling cascade of INH0, INH1, and INH2. Therefore, the only variable that needed to be estimated for the drug-treated tumor growth models was Ksp, a variable representing the rate of signal propagation between the inhibitory compartments. Gamma was set equal to 0.34 for both tumor types based on the model simulations, and it was found this value best described the transition from the exponential tumor growth phase to the linear tumor growth phase. Ksp was estimated as 1.3 day−1 and 1.04 day−1 for the wild-type tumor and the vIII mutant tumor, respectively. The tumor growth model variables are listed in Table 1. The model-predicted tumor growth profiles sufficiently captured the measured tumor size for each tumor type (see Figure 4). It can be seen that tumor size was reduced in the gefitinib-treated groups compared to the corresponding control group, with approximately 38% and 30% tumor growth inhibition on Day 15 in the wild-type tumor and the vIII mutant tumors, respectively. The nearly equal tumor growth inhibition in the EGFR wild-type and vIII mutant groups supports a fundamental premise of equivalent PK/PD dosing that analogous PD profiles will be equally efficacious.
Figure 4.
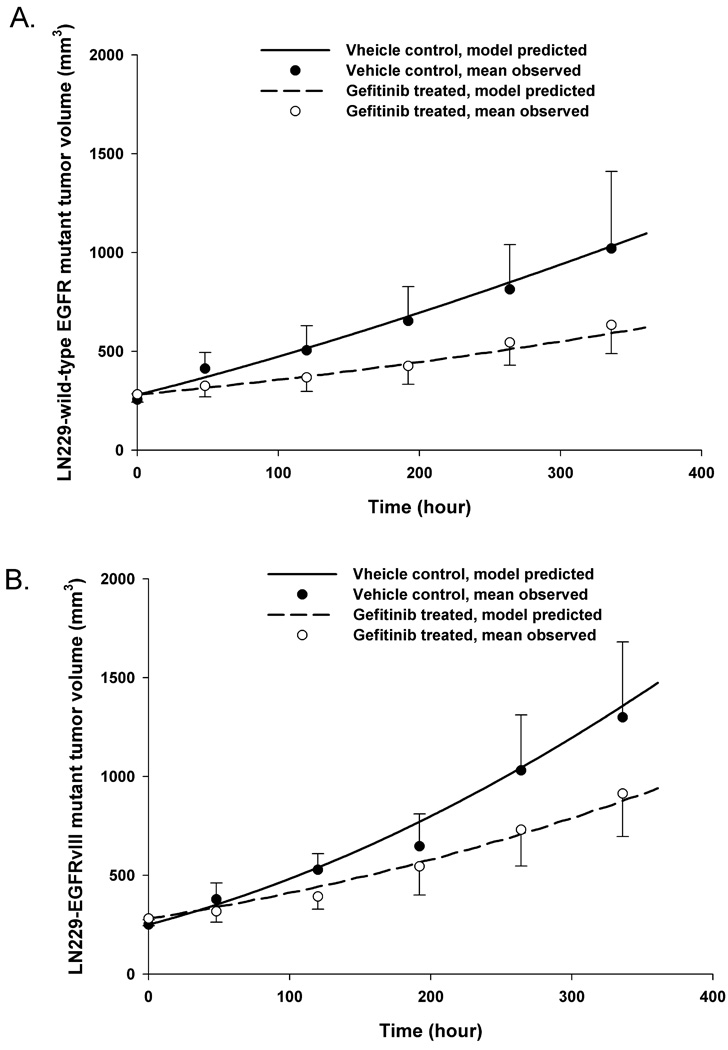
The PK/PD/tumor growth model-predicted (―――, gefitinib-treated group; ―――, vehicle control group) and mean observed (●, gefitinib-treated group, n = 23; ○, vehicle control group, n = 9) tumor sizes are presented for wild-type tumor group (A) and vIII mutant tumor group (B), respectively. Bars = ± 1 SD. Once the hybrid PK/PD models were finalized, a Gompertz tumor growth model was linked to the final PD model for each tumor group by using pERK as the biomarker. The tumor growth models for each tumor group were derived in a sequential manner by fitting to the control groups first, and then fitting to the gefitinib-treated groups.
Clinical PK/PD model for gefitinib
The PK/PD model structure for gefitinib in brain tumor patients was similar to that in mice except systemic disposition in patients required only a single compartment (see Supplementary Figure S1). The 1-compartment model describing gefitinib’s plasma concentrations was based on data obtained in cancer patients who received a 14-day course of 525 mg/d (14), a dose level close to the 500 mg/d dose used in brain tumor patients not receiving EIAEDs (16,17). The model would not be applicable to patients receiving EIAEDs, and extension of the systemic model developed at 525 mg/d to much lower or higher gefitinib doses should be done cautiously as the available data suggests gefitinib PKs are not strictly dose-proportional (15). The blood flow-limited model for gefitinib’s disposition in brain tumors assumes appreciable drug accumulation and homogeneity, and has no provisions to specifically assess blood-brain barrier (BBB) transport. The relatively high tumor/plasma concentration ratios is an indication that significant efflux at the BBB by ABC transporters, such as P-glycoprotein and ABCG2, is limited; however these processes require further consideration as gefitinib has been shown to be both a substrate and inhibitor depending on its concentration (19). The simplifying assumption of concentration homogeneity within the tumor is consistent with blood flow-limited tissue compartments, yet does not account for well-known spatial dependencies in anticancer drug concentrations in an individual’s brain tumor (20). However, the simulations conducted by varying the brain tumor partition coefficient (Rbt) reflect the spatial variations in gefitinib’s tumor accumulation, either within or between tumors as observed in patients (10, 18), which are often attributed to breakdown of the BBB.
The first simulation applied the equivalent PK/PD dosing strategy to brain tumor patients bearing either EGFR wild-type or vIII mutant tumors (see Figure 5A) assuming the same PK model parameters with the Rbt equal to 10. This value falls within the range of 2–13 reported for brain tumor to plasma gefitinib concentration ratios in patients (10, 18), and correspondingly predicted brain tumor concentrations (see Figure 5A) that coincided with the mean of 9.4 ± 9.3 µg/g (n = 5) measured in two patients with malignant gliomas (10). The simulations indicated that to achieve a similar degree of pERK inhibition patients with wild-type EGFR tumors required a 2-fold greater dose of 1000 mg/d compared to a 500 mg/d dose in patients with the vIII variant tumors. It can also be seen that the fluctuation in pERK levels is minimal in a 24-hour dosing period suggesting that current schedules of once daily dosing are adequate at least in terms of duration of inhibitory action. Once steady-state is achieved at about Day 10, the fluctuation in pERK values are less than 10% in a 24-hour dosing interval, whereas brain tumor concentrations vary on the order of 30%.
Figure 5.
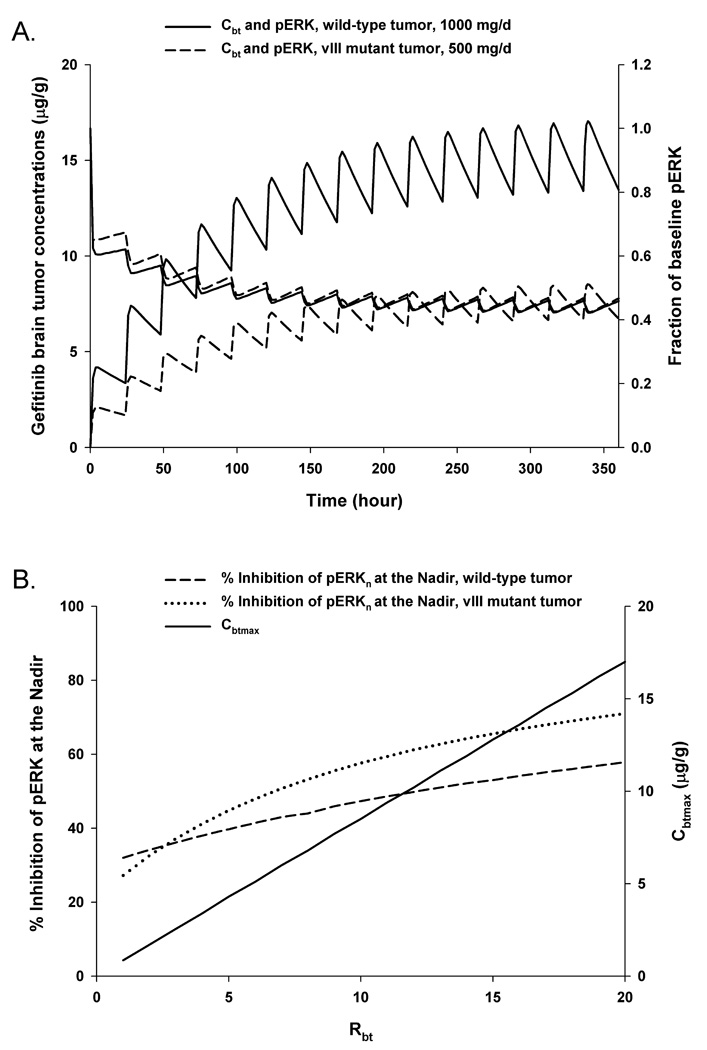
Clinical PK/PD model simulations. Model simulations of gefitinib brain tumor concentration-time profiles (left y-axis) and corresponding tumor pERK inhibition-time profiles (right y-axis) following 1000 mg/d PO × 15 days in patients bearing intracerebral wild-type EGFR tumors (―――) and 500 mg/d PO × 15 days in patients bearing intracerebral EGFRvIII mutant tumors (―――). The brain tumor partition coefficient, Rbt, was set to 10 (A). The effects of the brain tumor partition coefficient (Rbt) on the steady-state maximum brain tumor concentration (i.e. Cbtmax, ―――) and the percent inhibition of pERK at the nadir in patients bearing either intracerebral wild-type EGFR (―――) or EGFRvIII mutant (······) tumors following 500 mg/d of gefitinib for 15 days (B).
The second simulation determined how changes in the brain tumor partition coefficient influenced both the steady-state maximum brain tumor concentration (i.e. Cbtmax) and the percent inhibition of pERK at the nadir (see Figure 5B) in both tumor types following 500 mg/d of gefitinib for 15 days. Given the same dosing schedule in patients with either wild-type or vIII mutant tumors the PK model predicts analogous steady-state brain tumor concentrations that increase proportionately with increases in the partition coefficient. The PD response, as measured by the percent inhibition of pERK at the nadir, is greater and more sensitive in vIII EGFR tumors than in the wild-type counterpart, with changes in the nadir being about 45% in the vIII tumors versus about 25% in wild-type tumors over the 20-fold change in partition coefficients. Further, it can be deduced from this simulation that in wild-type EGFR tumors steady-state brain tumor gefitinib concentrations need to be at least 10 µg/g to reach 50% inhibition of pERK, which corresponds to a partition coefficient of 12. Based on the small amount of patient data and the known inhomogeneity in drug distribution in tumors its unlikely that all regions of the tumor could achieve this degree on inhibition at a dose of 500 mg/d. Achievement of this degree of pERK inhibition throughout mutant vIII tumors is more readily attainable, and according to the model occurs at gefitinib maximum concentrations of between 5–6 µg/g and a partition coefficient of between 6–7. Overall, the PK model of gefitinib is consistent with the very limited available data, yet should be applied judiciously given its speculative nature.
Discussion
The inclusion of translational medicine in the NIH Roadmap and FDA Critical Path Initiatives has motivated a reanalysis of how preclinical and clinical research may be bridged to hasten drug development and yield a clearer understanding of the relationships between preclinical and clinical studies. Academic drug discovery and development programs have arisen as a means to foster a “from the bench to the bedside” strategy. These programmatic efforts, although not always explicitly stated, renew the importance of PK/PD principles and investigations throughout the drug development process, in part, due to the quantitative pharmacological information that can be provided. In this regard, and as highlighted by the FDA (http://www.fda.gov/oc/initiatives/criticalpath/stanski/stanski.html), model-based drug development is a key component of the translational science effort. However, much of the current focus has been in the clinical domain, and definitive model-based approaches in the preclinical setting have not been forthcoming. The current project was conducted based on the equivalent PK/PD dosing strategy (9) that is representative of model-based drug development, and may prove to be a technique that enhances our ability to select the most efficacious drugs in an era of molecular and targeted chemotherapy.
A new component of the model development approach was to link the PD model to a tumor growth model, and thus, facilitate quantitative comparisons between drugs and tumor types in a preclinical setting. The efficacy model and link to the PD model were based on an approach recently described by Bueno L, et al (13) that analyzed a pSMAD inhibitor. The approach of using two intermediate compartments (i.e. INH1 and INH2) seemed applicable to our study since inhibition of pERK is amongst a cascade of events that result in apoptosis and register as a retardation in tumor size. The control and gefitinib-treated efficacy models were constructed to readily determine the drug effect as INH2 is nonzero only for gefitinib treatments, and Kgexp, Kgzero and gamma were equal in the control and drug-treated models. This attribute of distinguishing the drug-dependent features enables the use of simulations to see how different dosing regimens alter tumor size relative to control, and may permit the elimination of costly size-based efficacy studies. It should be appreciated that the complex mechanisms of gefitinib activities involve other signaling pathways, such as PI3K-AKT, which may reveal other useful PD endpoints. Whether one or multiple PD endpoints can best be formulated into tumor size models will require further studies.
The equivalent PK/PD dosing strategy was designed to overcome the limitations of semi-empirical tumor-size based studies, and place PK/PD investigations at the center of preclinical drug development. The hypothesis that equal degrees of pERK inhibition afforded by gefitinib in the sensitive and resistant tumor variants will produce equal degrees of tumor growth retardation was supported, and suggests further examination of equivalent PK/PD dosing, for instance, to assess relationships between target inhibition and tumor growth for a series of tumors and drug candidates.
The development of a clinical PK/PD model for gefitinib based on patient PK properties and the preclinical pERK model was a novel feature of the investigation, and demonstrated through simulations the types of questions that can be addressed. Although the model is viewed as speculative it is believed that the model-based approach to address pharmacological questions may generate increased interest to obtain clinical data to further develop and validate tumor-based models. It was shown that patients possessing the vIII EGFR mutation in tumors require about a 50% lower dose than patients with wild-type EGFR, assuming normal PTEN and no other genetic differences in the two tumor types. The 24-hour dosing intervals, regardless of tumor type, maintained suppression of pERK over the 24-hour period once steady-state was achieved, although the extent of inhibition never exceed 80% at doses of 500 mg/d. The simple physiologically-based blood flow-limited brain tumor model is able to predict gefitinib concentrations due to changes in tumor volume, blood flow and drug distribution into tumor. The latter was used as a variable to represent possible changes in drug penetration and associated maximum brain tumor gefitinib concentrations within and between patients due to alterations in the BBB. The simulations showed the limited conditions in which 50% pERK inhibition at the nadir could be achieved, and baits the question of the degree and duration of inhibition that leads to antitumor activity. This type of uncertainty in the meaning of target inhibition (i.e. pEGFR) and downstream effectors (i.e. pERK and pAKT) has been expressed by Lassman and co-workers (18) based on sparse data collected in brain tumor patients. It is believed that through the continued collection of sparse brain tumor samples from patients and the application of predictive models that these uncertainties can be mitigated. The application of the preclinical PD pERK model to patients was done without any variable scaling to account for possible differences between mouse xenograft gliomas and patient tumors. The pertinent PD variables in the target-response model are Kin, Kout, Ktr and IC50, and how these may be related between species will have to be addressed in a broader context with more patient data. It is also appreciated that the complexities of drug resistance, feedback signalling and crosstalk when multiple drugs are used will require a reassessment of the PD model. In summary, although the clinical PK/PD model is speculative it highlights a future direction of establishing links between preclinical and clinical models based on tumor measurements, sites that cannot be frequently sampled in patients.
In conclusion, this investigation developed a preclinical PK/PD/efficacy model predicated upon a molecular determinant of drug activity that highlighted the use of equivalent PK/PD dosing. Further, a clinical PK/PD model was also devised based on cancer patient data and naive scaling of a PD model that demonstrated target inhibition as a function of drug accumulation and tumor type. It is proposed that these preclinical and clinical modelling approaches can provide a foundation for drug development, and lead to the rational selection and use of anticancer drug candidates in different tumor types.
Supplementary Material
Acknowledgments
Grant information: This project was supported by NIH grants CA072937 and CA127963 awarded to JMG.
Abbreviations list
- PK
pharmacokinetic
- PD
pharmacodynamic
- PO
orally
- EGFR
epidermal growth factor receptor
- pEGFR
phosphorylated-EGFR
- pERK
phosphorylated-ERK1/2
- PTEN
phosphatase and tensin homolog
- DMEM
Dulbecco's Modified Eagle Medium
- FBS
fetal bovine serum
- ABEC
the area between the effect curve
- EIAEDs
enzyme-inducing anti-eplileptic drugs
- BBB
blood-brain barrier
- Rbt
brain tumor partition coefficient
- Cbtmax
steady-state maximum brain tumor concentration
References
- 1.Wen PY, Kesari S. Malignant gliomas in adults. N Engl J Med. 2008;359:492–507. doi: 10.1056/NEJMra0708126. [DOI] [PubMed] [Google Scholar]
- 2.Dutta PR, Maity A. Cellular responses to EGFR inhibitors and their relevance to cancer therapy. Cancer Lett. 2007;254:165–177. doi: 10.1016/j.canlet.2007.02.006. [DOI] [PMC free article] [PubMed] [Google Scholar]
- 3.Halatsch M-E, Schmidt U, Behnke-Mursch J, Unterberg A, Wirtz CR. Epidermal growth factor receptor inhibition for the treatment of glioblastoma multiforme and other malignant brain tumors. Cancer Treatment Reviews. 2006;32:74–89. doi: 10.1016/j.ctrv.2006.01.003. [DOI] [PubMed] [Google Scholar]
- 4.Heimberger AB, Hlatky R, Suki D, et al. Prognostic effect of epidermal growth factor receptor and EGFRvIII in glioblastoma multiform patients. Clin Cancer Res. 2005;15:1462–1466. doi: 10.1158/1078-0432.CCR-04-1737. [DOI] [PubMed] [Google Scholar]
- 5.Mellinghoff IK, Wang MY, Vivanco I, et al. Molecular determinants of the response of glioblastomas to EGFR kinase inhibitors. N Engl J Med. 2005;353:2012–2024. doi: 10.1056/NEJMoa051918. [DOI] [PubMed] [Google Scholar]
- 6.Schilsky RL, Gordon G, Gilmer TM, et al. The translational research working group developmental pathway for anticancer agents (drugs or biologics) Clin Cancer Res. 2008;14:5685–5691. doi: 10.1158/1078-0432.CCR-08-1265. [DOI] [PMC free article] [PubMed] [Google Scholar]
- 7.Woodcock J, Woosley R. The FDA ciritical path initiative and its influence on new drug development. Annu Rev Med. 2008;59:1–12. doi: 10.1146/annurev.med.59.090506.155819. [DOI] [PubMed] [Google Scholar]
- 8.Zhou Q, Guo P, Kruh GD, Vicini P, Wang X, Gallo JM. Predicting human tumor drug concentrations from a preclinical pharmacokinetic model of temozolomide brain disposition. Clin Cancer Res. 2007;13:4271–4279. doi: 10.1158/1078-0432.CCR-07-0658. [DOI] [PubMed] [Google Scholar]
- 9.Wang S, Guo P, Wang X, Zhou S, Gallo JM. Preclinical pharmacokinetic/pharmacodynamic models of gefitinib and the design of equivalent dosing regimens in EGFR wild-type and mutant tumor models. Mol Cancer Ther. 2008;7:407–417. doi: 10.1158/1535-7163.MCT-07-2070. [DOI] [PubMed] [Google Scholar]
- 10.Hofer S, Frei K, Rutz HP. Gefitinib accumulation in glioblastoma tissue. Cancer Biol Ther. 2006;5:483–484. doi: 10.4161/cbt.5.5.2653. [DOI] [PubMed] [Google Scholar]
- 11.Barrett PH, Bell BM, Cobelli C, et al. SAAM II: simulation, analysis, and modeling software for tracer and pharmacokinetic studies. Metabolism. 1998;47:484–492. doi: 10.1016/s0026-0495(98)90064-6. [DOI] [PubMed] [Google Scholar]
- 12.Norton L. A Gompertz model of human breast cancer growth. Cancer Res. 1988;48:7067–7071. [PubMed] [Google Scholar]
- 13.Bueno L, de Alwis DP, Pitou C, et al. Semi-mechanistic modelling of the tumour growth inhibitory effects of LY2157299, a new type I receptor TGF-beta kinase antagonist, in mice. Eur J Cancer. 2008;44:142–150. doi: 10.1016/j.ejca.2007.10.008. [DOI] [PubMed] [Google Scholar]
- 14.Nakagawa K, Tamura T, Negoro S, et al. Phase I pharmacokinetic trial of the selective oral epidermal growth factor receptor tyrosine kinase inhibitor gefitinib (‘Iressa’, ZD1839) in Japanese patients with solid malignant tumors. Ann Oncol. 2003;14:922–930. doi: 10.1093/annonc/mdg250. [DOI] [PubMed] [Google Scholar]
- 15.Swaisland HC, Smith RP, Laight A, et al. Single-dose clinical pharmacokinetics studies of gefitinib. Clin Pharmacokinet. 2005;44:1165–1177. doi: 10.2165/00003088-200544110-00004. [DOI] [PubMed] [Google Scholar]
- 16.Reardon DA, Quinn JA, Vredenburgh JJ, et al. Phase I trial of gefitinib plus sirolimus in adults with recurrent malignant glioma. Clin Cancer Res. 2006;12:860–868. doi: 10.1158/1078-0432.CCR-05-2215. [DOI] [PubMed] [Google Scholar]
- 17.Pardos MD, Yung WK, Wen PY, et al. Phase-1 trial of gefitinib and temozolomide in patients with malignant glioma: a North American brain tumor consortium study. Cancer Chemother Pharmacol. 2008;61:1059–1067. doi: 10.1007/s00280-007-0556-y. [DOI] [PMC free article] [PubMed] [Google Scholar]
- 18.Lassman AB, Rossi MR, Raizer JJ, et al. Molecular study of malignant gliomas treated with epidermal growth factor receptor inhibitors: tissue analysis from North American Brian Tumor Consortium Trials 01–03 and 00–01. Clin Cancer Res. 2005;11:7841–7850. doi: 10.1158/1078-0432.CCR-05-0421. [DOI] [PubMed] [Google Scholar]
- 19.Li J, Cusatis G, Brahmer J, et al. Association of variant ABCG2 and the pharmacokinetics of epidermal growth factor receptor tyrosine kinase inhibitors in cancer patients. Caner Biol Ther. 2007;6:432–438. doi: 10.4161/cbt.6.3.3763. [DOI] [PubMed] [Google Scholar]
- 20.Levin VA. Pharmacokinetics and CNS chemotherapy. In: Hellmann K, Carter SK, editors. Fundamentals of cancer chemotherapy. New York: McGraw-Hill; 1986. p. 28. [Google Scholar]
Associated Data
This section collects any data citations, data availability statements, or supplementary materials included in this article.