

Abstract
Background
Chronic kidney disease (CKD) is a worldwide health problem with increasing prevalence and poor outcomes including severe cardiovascular disease and renal osteodystrophy. With advances in medical treatment, CKD patients are living longer and require oral care. The aim of this study was to determine the effects of CKD and dietary phosphate on mandibular bone structure using a uremic mouse model.
Methods
Uremia (U) was induced in female DBA/2 mice by partial renal ablation. Uremic mice received either a normal phosphate (NP) or a high phosphate (HP) diet. Sham surgeries were performed in a control group of mice, and half received either a NP or a HP diet. At termination, animals were sacrificed and mandibles collected for microcomputed tomography (micro-CT) and histological analysis.
Results
Sera levels of BUN, PTH and alkaline phosphatase were all significantly increased in U/NP and U/HP vs. Sham controls, while serum calcium was increased in the U/HP group and no differences were noted in serum phosphate levels between groups. Micro-CT analyses revealed a significant reduction in cortical bone thickness and an increase in trabecular thickness and trabecular bone volume/tissue volume in U/NP and U/HP groups compared to Sham/NP. A significant reduction in cortical bone thickness was also found in the Sham/HP vs. Sham/NP group. Histological evaluation confirmed increased trabeculation in the U groups.
Conclusions
CKD in mice, especially under conditions of high phosphate feeding, results in marked effects on alveolar bone homeostasis.
Keywords: Bone biology, periodontal-systemic disease interactions, risk factor(s)
INTRODUCTION
Chronic kidney disease (CKD) is a worldwide public health problem with increasing prevalence, high cost, and poor outcome. An estimated 26 million Americans have some stage of CKD.1 Uremia is a result of CKD and adverse outcomes of CKD include kidney failure, cardiovascular disease (CVD), and premature death.2 Other complications include hyperparathyroidism, renal osteodystrophy (ROD) and CKD-Mineral and Bone Disorder (CKD-MBD), which is a systemic disorder that manifests as abnormalities in bone and mineral metabolism and/or extra-skeletal calcification.3
Reduction in kidney function causes phosphate retention and the suppression of renal hydroxylation of 25-hydroxy vitamin D, leading to hypocalcemia that stimulates hyperparathyroidism (SHPT). Phosphate is a known regulator of mineral metabolism and contributor to uremic hyperplastic parathyroid growth and parathyroid hormone (PTH) secretion. Elevated PTH exerts its effects primarily on bone where it stimulates osteoclasts to mobilize calcium from bone tissue to normalize serum calcium, resulting in resorption and reduced bone mass.4, 5 This can lead to osteitis fibrosa, a form of ROD. ROD is a result of alterations in bone morphology associated with CKD as either high-turnover, low-turnover or mixed osteodystrophy. Osteitis fibrosa and mixed osteodystrophy are high-turnover bone diseases characterized by elevated serum PTH levels and abnormal mineralization.6
Elevated serum phosphate induces SHPT through indirect and direct mechanisms.7 In addition, hyperphosphatemia indirectly inhibits 1,25(OH)2D3 production.8 This latter effect of phosphate may be a result of increased serum levels of fibroblast growth factor 23 (Fgf23). Fgf23, secreted predominantly by osteocytes and osteoblasts in bone and odontoblasts and cementoblasts/cytes in teeth, is a potent phosphaturic hormone acting in the kidney to decrease circulating levels of phosphate.9 Serum Fgf23 levels are related inversely to renal function and have been associated with progression of CKD,10, 11 and further, are highly correlated with arterial calcification,12 potentially contributing to CVD.
With advances in medical treatment, the adjusted mortality in Medicare CKD patients decreased 46% between 1994 and 2006, from 251 to 136 per 1,000 patient years.13 Patients with CKD are living longer and will continue to require oral care. Existing data have revealed chronic renal disease can significantly affect periodontal health.14 Oral manifestations associated with CKD, including gingival enlargement, xerostomia, oral malodor, mucosal lesions and oral infections, are consequences principally due to adverse oral side-effects of drug therapy.15 In addition, a wide range of bony anomalies, including brown tumors, have been reported related to defects of calcium metabolism and resultant secondary hyperparathyroidism.15 Other findings in renal failure patients include bone demineralization accompanied by trabeculation and cortical loss, giant cell radiotransparencies or inappropriate calcification of soft tissues.16
The existence of an increased prevalence and severity of periodontitis in end-stage renal disease patients remains controversial.14 However, because periodontitis may contribute to systemic inflammation, which has been associated with atherosclerotic complications, the periodontal status of these patients should be monitored.14, 17 Based on data from the third National Health and Nutrition Examination Survey (NHANES III), researchers have suggested including edentulism and low serum titer to Aggregatibacter actinomycetmemcomitans, a periodontal pathogen, as risk indicators for CKD and periodontal status as a risk factor for CKD.18, 19 In pediatric CKD patients, dental calculus scores were correlated with renal disease severity and are thought to be a reflection of other tissue calcification pathologies.20
The aim of this study was to determine the effects of renal insufficiency in the context of normal or high phosphate feeding on mandibular bone structure.
MATERIALS AND METHODS
Animals and Diets
Female dilute brown agouti/2 (DBA/2) mice were purchased at 11 weeks old**,†† and maintained in a specific pathogen-free environment. Dilute brown agouti/2 mice were chosen based on pilot studies demonstrating these mice develop skeletal changes and vascular calcification consistent with CKD-MBD following renal ablation surgery (unpublished data). High phosphate (HP) and normal phosphate (NP) diets were purchased for mouse chow.‡‡ The HP diet contained 0.9% phosphate, 0.6% calcium and the NP diet contained 0.5% phosphate and 0.6% calcium. Mice had access to food and water ad libitum and were maintained in compliance with the National Institutes of Health (NIH) guide for the Care and Use of Laboratory Animals. The University of Washington Animal Care Committee approved the study protocol.
Surgical procedure
Uremia was induced in 18 week old mice following the two-step surgical procedure for partial renal ablation described by Gagnon and Gallimore.21 During the first surgery, the right kidney was exposed and its surface was electrocauterized, except the area around the hilum, leaving 2 mm of intact tissue. Following a two-week recovery period, a second surgery was performed to remove the left kidney. Control mice underwent sham surgeries, where dorsal incisions were made, the kidneys exposed then reinserted into the abdominal cavity. Within 72 hours after the second surgery, uremic and sham-operated mice were put on either the NP or the HP diet. Animals were terminated by IP Nembutal overdose (0.4–0.5 mg/g animal weight) between 14–15 weeks after the first surgery, as previously described,12 and mandibles were dissected using scissors. For histological analysis, tissues were placed in Bouin’s fixative solution§§ for 24–48 hrs at 4–10°C, followed by storage in 70% ethanol. For microCT, mandibles were preserved in RNA stabilization reagent.***
Study groups
1) Sham/NP: sham operated mice fed the NP diet, 2) Sham/HP: sham operated mice fed the HP diet, 3) U/NP: uremic mice fed the NP diet, and 4) U/HP: uremic mice fed the HP diet. A minimum of 4 animals per group were analyzed.
Serum chemistry
Saphenous blood was collected prior to termination (week 14 after the first surgery) and serum levels of blood urea nitrogen (BUN), phosphorus (Pi), calcium (Ca), alkaline phosphatase (ALP) and cholesterol were analyzed by standard autoanalyzer laboratory methods.††† Serum PTH levels were determined using mouse intact PTH ELISA.‡‡‡
Quantitative analysis of mandibles using micro-computed tomography (micro-CT)
Mandibles were wrapped in parafilm during scanning to prevent drying. Mandibles were scanned in a 1076 SkyScan micro-CT desktop scanner§§§ and subsequently reconstructed and analyzed with the packaged NRecon and CTAn software. The x-ray source was operated at 50 kV/200 μA with a 0.5 mm Al filter. Images were acquired at 18 μm resolution with a 1.2° rotational step. Scans were reconstructed with 20% beam hardening and ring correction factor of 6. From the reconstructed data sets volume of interests (VOI) were defined for each mandible as follows: A buccal-lingual cross-slice of the first mandibular molar in the furcation zone (between mesial and distal roots) was identified. Ten slices prior to and after the identified furcation slice were added to generate a VOI. To analyze the alveolar bone, the incisor and the molar were removed from the slices. From raw images of the samples, thresholds were established to differentiate between trabecular and cortical bone. The lower and upper thresholds for trabecular bone were defined to be from 40–74 grayscale units, while the thresholds for cortical bone were defined as 75–255 grayscale units on an 8-bit grayscale. The same values were used for all samples analyzed. Subsequently, morphometrics were calculated for cortical and trabecular bone using CTAn software§§§.
Statistical Analysis
Statistical analyses were performed using the statistical software package.**** Group means and variances were determined using ANOVA, and values are presented as means ± SEM. Posthoc, pair-wise comparisons of group means were performed using Fisher’s PLSD analysis, and differences between groups were considered statistically significant at a P-value of < 0.05. The Pearson correlation coefficient (R) and P-values were used to determine associations. A positive correlation between two variables, shown as R > 0.5, was considered statistically significant at a P-value < 0.05.
Histological Analysis of Mandibles
At termination, mandibles were immersed in Bouin’s fixative and kept overnight at 4–10°C and then transferred to 70% ethanol for storage. For demineralization, mandibles were dissected from the surrounding tissues and kept in AFS solution (acetic acid, neutral buffered formalin, and sodium chloride) for three weeks. Tissues were then processed and embedded in paraffin for sectioning using a rotary microtome. Five micrometer frontal sections of the mandible were obtained and stained with hematoxylin and eosin (H&E) as previously described.22 Images were taken using a Nikon Eclipse E400 microscope camera system. Images of the cortical bone were taken at the middle mesio-distally of the mesial root of the mandibular first molar. Images of the trabecular bone were taken in the furcation area between the mesial and distal roots of the mandibular first molar.
RESULTS
Serum chemistry
Data on serum chemistry are presented in Figure 1. There were significant differences between the sham groups and the uremic groups in multiple parameters measured. Serum BUN, PTH and ALP were all markedly increased 2.5–3.5 fold, 6–8 fold, and 2.5 fold respectively in both uremic groups as compared to the sham control groups (Figure 1A–C). Serum analysis revealed no significant increase in serum phosphorus levels in the uremic groups compared to each other or any of the sham control groups (Figure 1D). Serum calcium was significantly elevated in the U/NP group compared to the control groups, while no significant difference in serum calcium was found between the U/HP group and the sham controls (Figure 1E). Body weight was significantly decreased in both uremic groups compared to the sham control groups (Figure 1F).
Figure 1.
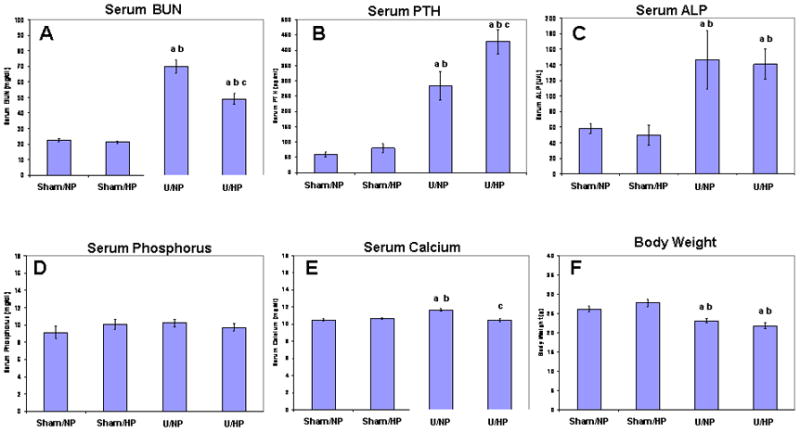
Serum values and body weights in uremic mice and sham controls fed normal (NP) or high phosphate (HP) diets. (A) Blood urea nitrogen, BUN; (B) Parathyroid hormone, PTH; (C) alkaline phosphatase, ALP; (D) Phosphorus; (E) Calcium; (F) Body weight. Data represent the mean ± SEM. ‘a’ represents a statistically significant difference (p<0.05) compared with the Sham/NP group; ‘b’ represents a statistically significant difference (p<0.05) compared with the Sham/HP group; and ‘c’ represents a statistically significant difference (p<0.05) compared with the U/NP group.
Micro-CT analysis
Results from micro-CT analyses are shown in Figure 2. Tomographic cross sectional slices were taken within the furcation zone as described in the Materials and Methods section. The region of interest used to evaluate bone quality is shown in Figure 2A. One mouse representative for each group is shown in Figure 2(B–E), with similar results noted for other mice in their respective groups. A decrease in bone density was observed, along with an increase in trabeculation in U/NP and U/HP groups compared to the Sham/NP group (Figure 2D, E vs. B). The Sham/HP group also appeared to have decreased bone density compared to the Sham/NP group; however this observation was not confirmed quantitatively as described below (Figure 2C vs. B).
Figure 2.
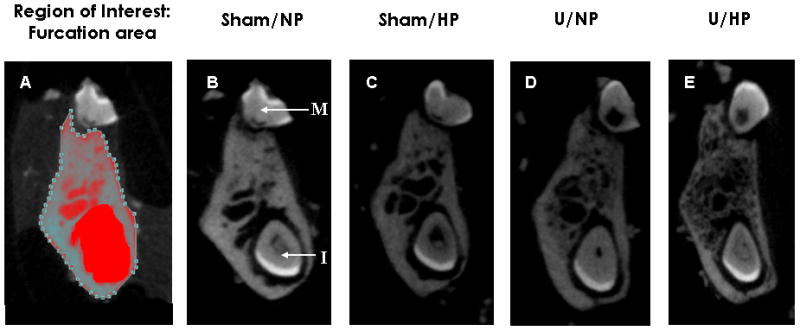
Tomographic cross sectional slices of the furcation area of the first mandibular molar. (A) Area highlighted represents the region of interest (area of bone) evaluated for comparison between groups. (D–E) Representative mandibles from Sham/NP, Sham/HP, U/NP and U/HP groups. M= molar tooth; I= incisor tooth.
Cortical and trabecular bone morphometrics are presented in Figure 3. As shown in Figure 3A the mean cortical bone thickness for the Sham/NP, Sham/HP, U/NP and U/HP groups was 0.234 ± 0.006 mm, 0.203 ± 0.006 mm, 0.188 ± 0.013 mm and 0.155 ± 0.004 mm, respectively. The reduction in cortical bone thickness between the Sham/HP, U/NP and U/HP groups compared to the Sham/NP group was significant (13.2%, 19.7%, 33.8% reduction in cortical bone thickness respectively), with the greatest decrease seen in the U/HP group. Furthermore, the reduction in cortical bone thickness between U/HP and U/NP groups was also significantly different (p<0.05).
Figure 3.
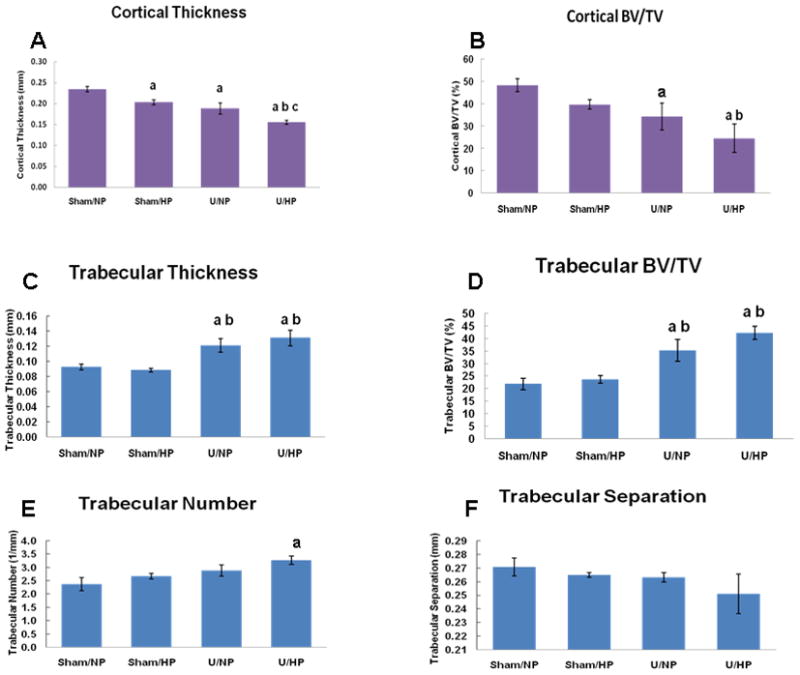
Mandibular bone morphometrics based on micro-CT analysis. A, B. Cortical bone morphometrics based on micro-CT analysis of the furcation zone between the mesial and distal roots of the mandibular first molar. Bars represent mean ± SEM; p<0.05, ANOVA; ‘a’ compared with Sham/NP group, ‘b’ compared with Sham/HP group, ‘c’ compared with U/NP group. BV/TV= bone volume/tissue volume. C–F. Trabecular bone morphometrics based on micro-CT analysis of the furcation area between the mesial and distal roots of the mandibular first molar. Bars represent mean ± SEM; p<0.05, ANOVA; ‘a’ compared with Sham/NP group, ‘b’ compared with Sham/HP group, ‘c’ compared with U/NP group. BV/TV= bone volume/tissue volume.
As shown in Figure 3B, a significant reduction in bone density, as represented by cortical Bone Volume/Tissue Volume (BV/TV) was detected in both U/NP and U/HP groups (34.3 and 24.6% BV/TV, respectively) compared with the Sham/NP group (48.3% BV/TV) (p=0.0423 and p=0.0037, for U/NP and U/HP respectively). This represented a 29.0% and 49.1% decrease in cortical BV/TV for U/NP and U/HP groups as compared to the Sham/NP group, respectively.
Next, trabecular bone morphometrics were examined (Figure 3C–F). As shown in Figure 3C, trabecular thickness in the U/NP and U/HP groups was increased by 31.5% and 42.4%, respectively when compared with the Sham/NP group. These increases were significant (p<0.05). The increase in trabecular thickness in the U/NP and U/HP groups was also significant (p<0.05) when compared to the Sham/HP group (37.5% and 48.9% increase respectively).
A similar relationship was found when trabecular BV/TV was analyzed. As shown in Figure 3D, trabecular BV/TV was increased by 61.9% and 94.2% for U/NP and U/HP groups, respectively when compared with the Sham/NP group. An increase of 49.4% and 79.2% in trabecular BV/TV was found for the U/NP and U/HP groups, respectively, when compared with the Sham/HP group. All of these increases were significant (p<0.05).
As presented in Figure 3E, trabecular number was increased in the Sham/HP, U/NP and U/HP groups when compared with the Sham/NP group. However, the increase in trabecular number of 37.9% was significant (p <0.05) only for the U/HP group. Correspondingly, there was a trend towards a decrease in trabecular separation in the Sham/HP, U/NP and U/HP groups when compared to the Sham/NP group (Figure 3F). The greatest decrease in trabecular separation was noted in the U/HP group, but this was not significant.
Linear regression analysis revealed an inverse correlation between serum PTH levels and cortical bone thickness (R=0.78), as well as between serum PTH levels and cortical BV/TV (R=0.69) (Figure 4A,B). Conversely, a positive correlation was found between serum PTH levels and trabecular bone thickness (R=0.80), as well as between serum PTH levels and trabecular BV/TV (R=0.82; Figure 4C,D).
Figure 4.
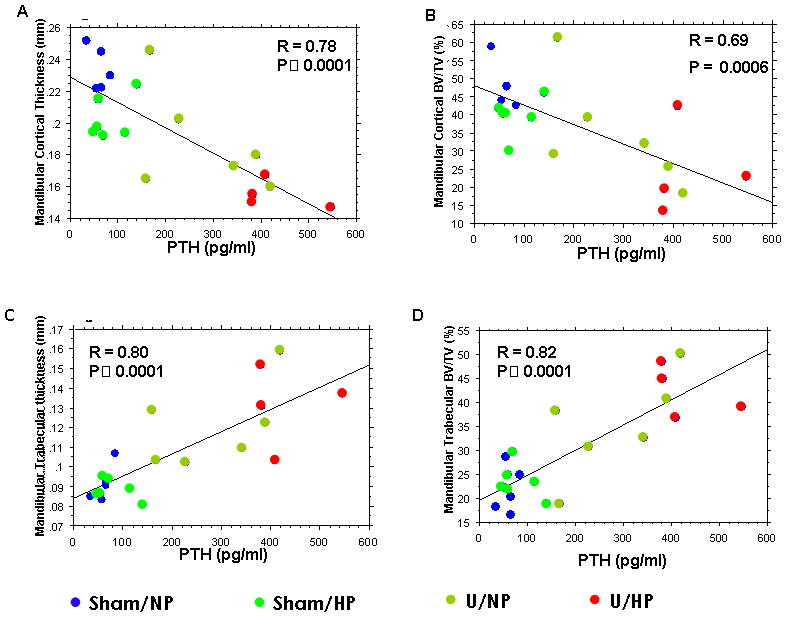
Linear regression analysis between serum parathyroid hormone (PTH) levels and mandibular bone morphometrics in all groups. (A) Correlation with cortical thickness; (B) Correlation with cortical bone volume/tissue volume (BV/TV); (C) Correlation with trabecular thickness; and (D) Correlation with trabecular BV/TV.
Histological evaluation
Histological evaluation of the buccal cortical bone in relationship to the middle mesio-distal of the mesial root of the first molar is presented in Figure 5. A representative section from one mouse is shown from each group and these were similar to sections obtained from other mice in their respective groups. The Sham/NP group exhibited well-organized cortical lamellar bone and the periodontal ligament (PDL) fibers were obliquely oriented (Figure 5A,E). Similarly, the Sham/HP group exhibited well-organized cortical bone and appropriately oriented PDL fibers (Figure 5B,F). The PDL space appeared wider in the U/NP group (Figure 5C,G) as compared to the Sham/NP group. The PDL fibers in the U/HP group (Figures 5D,H) appeared disrupted, with loss of orientation.
Figure 5.
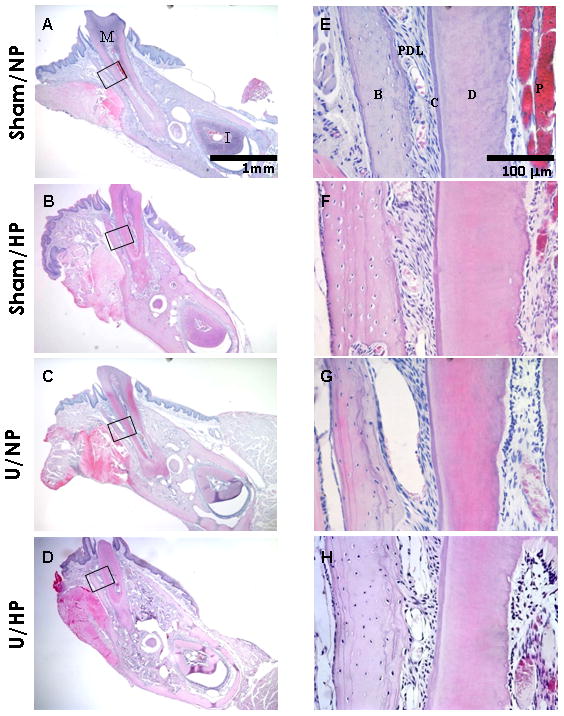
Histological staining of cortical bone. Buccal-lingual cross sections of the mesial root of the mandibular first molar. Sham/NP (A/E), Sham/HP (B/F), U/NP (C/G), U/HP (D/H). M= molar tooth; I= incisor tooth; B= bone; PDL= periodontal ligament; C= cementum; D= dentin; P=pulp. Hematoxylin & eosin, original magnification ×40 for A–D, ×400 for E–H.
Histological evaluation of the trabecular bone was performed in the furcation area between the mesial and distal roots of the mandibular first molar as seen in Figure 6. One representative section from each group is shown and these were similar to sections from other mice in their respective groups. As noted in Figures 6A/6E, the Sham/NP group exhibited a normal trabecular bone pattern with few bone marrow spaces. The Sham/HP group also displayed normal trabecular bone patterns (Figure 6B,F). The U/NP group exhibited an increase in bone marrow space and the trabecular projections appeared longer and more finger-like compared to the Sham/NP group (Figure 6C,G). The U/HP group revealed a dramatic change in the trabecular bone pattern (Figure 6D,H). There was an increase in number of finger-like trabecular projections, forming a lace-like pattern. There was also an increase in porosity of bone compared to the other three groups. The histological observations supported the findings of the micro-CT analysis regarding the increase in trabecular number and decrease in trabecular separation.
Figure 6.
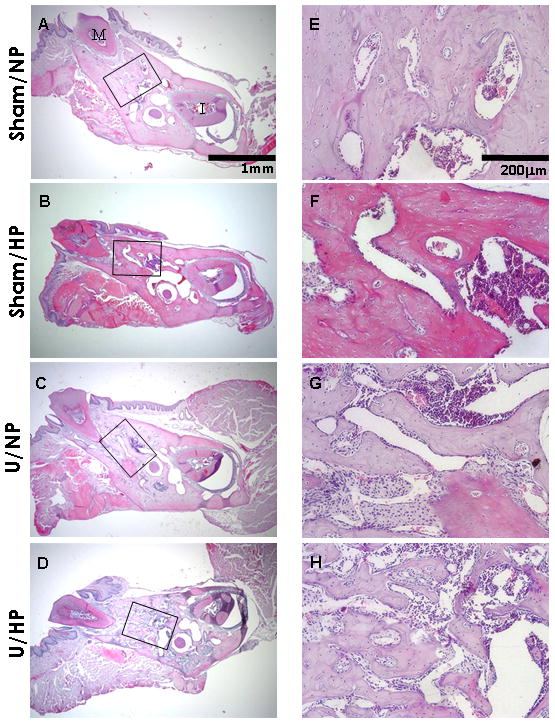
Histological staining of trabecular bone. Buccal-lingual cross sections of the furcation area between the mesial root and distal root of the mandibular first molar. Sham/NP (A/E), Sham/HP (B/F), U/NP (C/G), U/HP (D/H). Note the marked increase in trabecular bone in the U/HP group. M= molar tooth, I= incisor tooth. Hematoxylin & eosin, original magnification ×40 for A–D, ×200 for E–H.
DISCUSSION
In the present studies, we employed a uremic mouse model to determine the effects of CKD and phosphate loading on the dentoalveolar complex. Sera levels of BUN, PTH and alkaline phosphatase were all significantly increased in U/NP and U/HP vs. sham controls, while serum calcium was increased in the U/HP group. No differences were noted in serum phosphate levels between groups. Micro-CT analyses showed a significant reduction in cortical bone thickness and an increase in trabecular thickness and trabecular bone volume/tissue volume in U/NP and U/HP groups compared to Sham/NP, with the most dramatic changes occurring in the U/HP group. A significant reduction in cortical bone thickness was also found in the Sham/HP vs. Sham/NP group. Histological evaluation confirmed increased trabeculation in the U groups. These data indicate that uremia, especially in the context of phosphate loading, has dramatic effects on the bones of the oral cavity.
While high phosphate feeding appeared to exacerbate skeletal changes in the uremic mice, serum phosphate levels in the mice were not elevated above sham control levels. This is likely due to compensatory increases in phosphate regulating hormones. Indeed, PTH was elevated in the uremic mice, and previously we showed that high serum levels of FGF23 are induced by phosphate feeding in uremic mice.12 Nevertheless, even small elevations in serum phosphate have been correlated with increased risk of cardiovascular disease and mortality in CKD patients,23 and vascular calcification is observed only in uremic mice treated with a high phosphate diet and not a normal phosphate diet.12 Thus, it is important to determine whether or not phosphate load in the CKD model even in the absence of measurable hyperphosphatemia, has an effect on bone activity.
Although no changes were noted in serum phosphate between the groups we did observe marked increases in serum BUN, PTH and ALP in U/NP and U/HP mice vs. sham/NP or sham/HP mice, indicative of a uremic condition and of altered bone metabolism. Further, decreased body weight was noted in U/NP and U/HP vs. sham groups. Not surprisingly, increased serum levels of PTH and ALP correlated with altered alveolar bone to include decreased cortical thickness and BV/TV and increased trabecular thickness and BV/TV. At the gross histological level this paralleled the disorientation of the PDL and increased trabeculation of alveolar bone, most apparent in the U/HP group. The bone changes occurred rather rapidly, i.e. 3 months following kidney ablation surgery and most likely sooner, but early samples were not taken for the studies here.
The decrease in cortical thickness and increase in trabeculation observed supports previous clinical reports of CKD patients that demonstrated thinning of cortical bone 15, 24 and increased trabeculation as determined by biopsies of the ilium.24 These data also support observations by Antonelli and Hottel, who noted a decrease in mineralization and alterations in trabeculae, producing a finely meshed pattern, in the mandible of a patient with CKD.25 A review by Jover-Cervero et al. suggested that patients had decreased trabeculation as determined by examining case reports of mandibles of CKD patients using dental panoramic radiographs.15 These differences may be attributed to several factors including stage and duration of disease,25 levels of serum Ca/P, Fgf23, ALKP, and BUN, diet (e.g. high protein/thus high protein diet), type of bone evaluated (long bones, iliac crest, mandibles) and mechanism of evaluation (bone biopsy vs. radiographs) and gender/species differences.
Surprisingly, while the effect on bone metabolism was modest, we noted a significant decrease in cortical thickness in samples from SHAM/HP mice vs. SHAM/NP mice. This finding coupled with a dramatic effect on alveolar bone in both U/NP and U/HP, with the greatest effect in U/HP, highlight the impact of CKD on bone metabolism, as well as potential effects of a high phosphate diet on bone homeostasis.
Previous studies from our group and others over the last decade have brought attention to phosphate as being more than a passive molecule controlled by calcium/calcium signaling.26 In fact, there is mounting evidence that inorganic phosphate acts as a signaling molecule, able to regulate genes associated with osteoblast differentiation, e.g. osteopontin, dentin matrix protein 1, bone sialoprotein and osteocalcin.27–31
Furthermore, data from humans, as well as rodent models, have shown that alterations in local as well as systemic levels of phosphate often result in profound and unique effects on mineralized tissues of the oral cavity vs. other mineralized tissues. These include inadequate cementum formation resulting in lack of PDL attachment, and subsequently severe periodontal disease, in humans and rodents with mutations in alkaline phosphatase, an enzyme that breaks down pyrophosphate (PPi) to inorganic phosphate (Pi) at local sites.32–34 In contrast, the reverse situation (i.e. excessive cementum formation) occurs in rodents exhibiting high levels of Pi relative to PPi locally, due to a mutation/knock out (KO) of either PC-1 (plasma cell glycoprotein 1, also known as ectonucleotide pyrophosphatase/phosphodiesterase 1, ENPP1) or ANK (progressive ankylosis protein).22 PC-1 is a membrane bound enzyme that can generate PPi for extracellular release35 while ANK encodes a transmembrane protein that regulates transport of PPi ions across the plasma membrane to the extracellular environment.36 At the systemic level, insufficient levels of Fgf23 in humans37 and in mice38 result in hyperphosphatemia, abnormally elevated levels of 1, 25 (OH)2 D3 and increased PTH. We have reported (via abstract) a tooth phenotype in Fgf23−/− mice including ectopic “mineral-like” tissue within the pulp chamber.39 In contrast, in murine models with mutation in PHEX, (phosphate regulating gene with homologies to endopeptidases on the X-chromosome), or DMP-1 (Dentin matrix protein 1), resulting in high levels of FGF23, hypophosphatemia and low levels of 1, 25 (OH)2 D3, there is evidence of deficient cementum formation40, 41 and previously reported defects in dentin formation with human counterparts.42, 43
Previous studies in humans and animal models focusing on non-oral bones report that CKD affects bone homeostasis.3, 9, 12, 21 The results of our studies, demonstrating that CKD in mice results in marked effects on alveolar bone homeostasis, seen by 3 months, and furthermore also noted in sham animals given HP diets for 3 months, suggest that bones of the oral cavity are highly sensitive to alterations related to uremic conditions, including dysregulation of phosphate metabolism.
Acknowledgments
NIH Grants HL62329 (to CMG); T32 DE07023-29 (MME salary support) and DE015109 (to MJS)
The authors thank the University of Washington Departments of Periodontics, Oral Biology, Bioengineering, and Pathology for their support. This study was supported by NIH grants HL62329 (to CMG, UW), T32 DE07023-29 (MME salary support, UW), and DE015109 (to MJS, UW). The authors report no conflict of interest related to this study.
Footnotes
No conflicts for any authors
Charles River laboratories, Wilmington, MA
Harlan, Indianapolis, IN
Dyets Inc., Bethlehem, PA
Electron Microscopy Sciences, Hatfield, PA
RNAlater, Qiagen Inc., Valencia, CA
Phoenix Central Laboratory, Everett, WA
ALPCO, Salem, NH
SkyScan, Kontich, Belgium
Stat View, SAS Institute, Cary, NC
References
- 1.Chronic Kidney Disease (CKD) [Accessed: April 29, 2009]; Available at: http://www.kidney.org/kidneydisease/ckd/index.cfm#facts.
- 2.Levey AS, Eckardt KU, Tsukamoto Y, et al. Definition and classification of chronic kidney disease: a position statement from Kidney Disease: Improving Global Outcomes (KDIGO) Kidney Int. 2005;67:2089–2100. doi: 10.1111/j.1523-1755.2005.00365.x. [DOI] [PubMed] [Google Scholar]
- 3.Moe S, Drueke T, Cunningham J, et al. Definition, evaluation, and classification of renal osteodystrophy: a position statement from Kidney Disease: Improving Global Outcomes (KDIGO) Kidney Int. 2006;69:1945–1953. doi: 10.1038/sj.ki.5000414. [DOI] [PubMed] [Google Scholar]
- 4.Cozzolino M, Dusso AS, Slatopolsky E. Role of calcium-phosphate product and bone-associated proteins on vascular calcification in renal failure. J Am Soc Nephrol. 2001;12:2511–2516. doi: 10.1681/ASN.V12112511. [DOI] [PubMed] [Google Scholar]
- 5.Ganesh SK, Stack AG, Levin NW, Hulbert-Shearon T, Port FK. Association of elevated serum PO(4), Ca x PO(4) product, and parathyroid hormone with cardiac mortality risk in chronic hemodialysis patients. J Am Soc Nephrol. 2001;12:2131–2138. doi: 10.1681/ASN.V12102131. [DOI] [PubMed] [Google Scholar]
- 6.Cozzolino M, Galassi A, Gallieni M, Brancaccio D. Pathogenesis and treatment of secondary hyperparathyroidism in dialysis patients: the role of paricalcitol. Curr Vasc Pharmacol. 2008;6:148–153. doi: 10.2174/157016108783955310. [DOI] [PubMed] [Google Scholar]
- 7.Rodriguez M, Almaden Y, Hernandez A, Torres A. Effect of phosphate on the parathyroid gland: direct and indirect? Curr Opin Nephrol Hypertens. 1996;5:321–328. doi: 10.1097/00041552-199607000-00006. [DOI] [PubMed] [Google Scholar]
- 8.Portale AA, Halloran BP, Morris RC., Jr Physiologic regulation of the serum concentration of 1,25-dihydroxyvitamin D by phosphorus in normal men. J Clin Invest. 1989;83:1494–1499. doi: 10.1172/JCI114043. [DOI] [PMC free article] [PubMed] [Google Scholar]
- 9.Patel TV, Singh AK. Kidney disease outcomes quality initiative guidelines for bone and mineral metabolism: emerging questions. Semin Nephrol. 2009;29:105–112. doi: 10.1016/j.semnephrol.2009.01.003. [DOI] [PMC free article] [PubMed] [Google Scholar]
- 10.Emmett M. What does serum fibroblast growth factor 23 do in hemodialysis patients? Kidney Int. 2008;73:3–5. doi: 10.1038/sj.ki.5002651. [DOI] [PubMed] [Google Scholar]
- 11.Fliser D, Kollerits B, Neyer U, et al. Fibroblast growth factor 23 (FGF23) predicts progression of chronic kidney disease: the Mild to Moderate Kidney Disease (MMKD) Study. J Am Soc Nephrol. 2007;18:2600–2608. doi: 10.1681/ASN.2006080936. [DOI] [PubMed] [Google Scholar]
- 12.El-Abbadi MM, Pai AS, Leaf EM, et al. Phosphate feeding induces arterial medial calcification in uremic mice: role of serum phosphorus, fibroblast growth factor-23, and osteopontin. Kidney Int. 2009;75:1297–1307. doi: 10.1038/ki.2009.83. [DOI] [PMC free article] [PubMed] [Google Scholar]
- 13.Collins AJ. United States Renal Data System excerpts from the 2008 Annual Data Report. Volume One: Atlas of Chronic Kidney Disease & End-Stage Renal Disease in the United States. J Am Kidney Disease. 2009;53:S1–S374. doi: 10.1053/j.ajkd.2008.10.005. [DOI] [PubMed] [Google Scholar]
- 14.Craig RG. Interactions between chronic renal disease and periodontal disease. Oral Dis. 2008;14:1–7. doi: 10.1111/j.1601-0825.2007.01430.x. [DOI] [PubMed] [Google Scholar]
- 15.Proctor R, Kumar N, Stein A, Moles D, Porter S. Oral and dental aspects of chronic renal failure. J Dent Res. 2005;84:199–208. doi: 10.1177/154405910508400301. [DOI] [PubMed] [Google Scholar]
- 16.Jover Cervero A, Bagan JV, Jimenez Soriano Y, Poveda Roda R. Dental management in renal failure: patients on dialysis. Med Oral Patol Oral Cir Bucal. 2008;13:E419–426. [PubMed] [Google Scholar]
- 17.Segelnick SL, Weinberg MA. The Periodontist’s Role in Obtaining Clearance Prior to Patients Undergoing a Kidney Transplant. J Periodontol. 2009;80:874–877. doi: 10.1902/jop.2009.080515. [DOI] [PubMed] [Google Scholar]
- 18.Fisher MA, Taylor GW. A prediction model for chronic kidney disease includes periodontal disease. J Periodontol. 2009;80:16–23. doi: 10.1902/jop.2009.080226. [DOI] [PMC free article] [PubMed] [Google Scholar]
- 19.Fisher MA, Taylor GW, Papapanou PN, Rahman M, Debanne SM. Clinical and serologic markers of periodontal infection and chronic kidney disease. J Periodontol. 2008;79:1670–1678. doi: 10.1902/jop.2008.070569. [DOI] [PubMed] [Google Scholar]
- 20.Davidovich E, Davidovits M, Peretz B, Shapira J, Aframian DJ. The correlation between dental calculus and disturbed mineral metabolism in pediatric patients with chronic kidney disease. Nephrol Dial Transplant. 2009 doi: 10.1093/ndt/gfp101. [DOI] [PubMed] [Google Scholar]
- 21.Gagnon RF, Gallimore B. Characterization of a mouse model of chronic uremia. Urol Res. 1988;16:119–126. doi: 10.1007/BF00261969. [DOI] [PubMed] [Google Scholar]
- 22.Nociti FH, Jr, Berry JE, Foster BL, et al. Cementum: a phosphate-sensitive tissue. J Dent Res. 2002;81:817–821. doi: 10.1177/154405910208101204. [DOI] [PubMed] [Google Scholar]
- 23.Kestenbaum B, Sampson JN, Rudser KD, et al. Serum phosphate levels and mortality risk among people with chronic kidney disease. J Am Soc Nephrol. 2005;16:520–528. doi: 10.1681/ASN.2004070602. [DOI] [PubMed] [Google Scholar]
- 24.Schober HC, Han ZH, Foldes AJ, et al. Mineralized bone loss at different sites in dialysis patients: implications for prevention. J Am Soc Nephrol. 1998;9:1225–1233. doi: 10.1681/ASN.V971225. [DOI] [PubMed] [Google Scholar]
- 25.Antonelli JR, Hottel TL. Oral manifestations of renal osteodystrophy: case report and review of the literature. Spec Care Dentist. 2003;23:28–34. doi: 10.1111/j.1754-4505.2003.tb00286.x. [DOI] [PubMed] [Google Scholar]
- 26.Foster BL, Tompkins KA, Rutherford RB, et al. Phosphate: known and potential roles during development and regeneration of teeth and supporting structures. Birth Defects Res C Embryo Today. 2008;84:281–314. doi: 10.1002/bdrc.20136. [DOI] [PMC free article] [PubMed] [Google Scholar]
- 27.Foster BL, Nociti FH, Jr, Swanson EC, et al. Regulation of cementoblast gene expression by inorganic phosphate in vitro. Calcif Tissue Int. 2006;78:103–112. doi: 10.1007/s00223-005-0184-7. [DOI] [PubMed] [Google Scholar]
- 28.Fatherazi S, Matsa-Dunn D, Foster BL, Rutherford RB, Somerman MJ, Presland RB. Phosphate regulates osteopontin gene transcription. J Dent Res. 2009;88:39–44. doi: 10.1177/0022034508328072. [DOI] [PMC free article] [PubMed] [Google Scholar]
- 29.Beck GR., Jr Inorganic phosphate as a signaling molecule in osteoblast differentiation. J Cell Biochem. 2003;90:234–243. doi: 10.1002/jcb.10622. [DOI] [PubMed] [Google Scholar]
- 30.Beck GR, Jr, Moran E, Knecht N. Inorganic phosphate regulates multiple genes during osteoblast differentiation, including Nrf2. Exp Cell Res. 2003;288:288–300. doi: 10.1016/s0014-4827(03)00213-1. [DOI] [PubMed] [Google Scholar]
- 31.Rutherford RB, Foster BL, Bammler T, Beyer RP, Sato S, Somerman MJ. Extracellular phosphate alters cementoblast gene expression. J Dent Res. 2006;85:505–509. doi: 10.1177/154405910608500605. [DOI] [PMC free article] [PubMed] [Google Scholar]
- 32.Beertsen W, VandenBos T, Everts V. Root development in mice lacking functional tissue non-specific alkaline phosphatase gene: inhibition of acellular cementum formation [In Process Citation] J Dent Res. 1999;78:1221–1229. doi: 10.1177/00220345990780060501. [DOI] [PubMed] [Google Scholar]
- 33.van den Bos T, Handoko G, Niehof A, et al. Cementum and dentin in hypophosphatasia. J Dent Res. 2005;84:1021–1025. doi: 10.1177/154405910508401110. [DOI] [PubMed] [Google Scholar]
- 34.Whyte MP. Hypophosphatasia and the role of alkaline phosphatase in skeletal mineralization. Endocr Rev. 1994;15:439–461. doi: 10.1210/edrv-15-4-439. [DOI] [PubMed] [Google Scholar]
- 35.Johnson K, Moffa A, Chen Y, Pritzker K, Goding J, Terkeltaub R. Matrix vesicle plasma cell membrane glycoprotein-1 regulates mineralization by murine osteoblastic MC3T3 cells. J Bone Miner Res. 1999;14:883–892. doi: 10.1359/jbmr.1999.14.6.883. [DOI] [PubMed] [Google Scholar]
- 36.Ho AM, Johnson MD, Kingsley DM. Role of the mouse ank gene in control of tissue calcification and arthritis. Science. 2000;289:265–270. doi: 10.1126/science.289.5477.265. [DOI] [PubMed] [Google Scholar]
- 37.Dumitrescu CE, Kelly MH, Khosravi A, et al. A case of familial tumoral calcinosis/hyperostosis-hyperphosphatemia syndrome due to a compound heterozygous mutation in GALNT3 demonstrating new phenotypic features. Osteoporos Int. 2009;20:1273–1278. doi: 10.1007/s00198-008-0775-z. [DOI] [PMC free article] [PubMed] [Google Scholar]
- 38.Sitara D, Razzaque MS, Hesse M, et al. Homozygous ablation of fibroblast growth factor-23 results in hyperphosphatemia and impaired skeletogenesis, and reverses hypophosphatemia in Phex-deficient mice. Matrix Biol. 2004;23:421–432. doi: 10.1016/j.matbio.2004.09.007. [DOI] [PMC free article] [PubMed] [Google Scholar]
- 39.Chu EY, Blethen FA, Tompkins KA, et al. Phosphate dysregulation disrupts morphology and proteins within the dentoalveolar complex. J Dent Res. 2009;88 (Spec Iss A):3090. [Google Scholar]
- 40.Ye L, Zhang S, Ke H, Bonewald LF, Feng J. Periodontal breakdown in the dmp1 null mouse model of hypophosphatemic rickets. J Dent Res. 2008;87:624–629. doi: 10.1177/154405910808700708. [DOI] [PMC free article] [PubMed] [Google Scholar]
- 41.Fong H, Chu EY, Tompkins KA, et al. Aberrant cementum phenotype associated with hypophosphatemic Hyp mouse. J Perio. 2009;80:1348–1354. doi: 10.1902/jop.2009.090129. [DOI] [PMC free article] [PubMed] [Google Scholar]
- 42.Chaussain-Miller C, Sinding C, Septier D, Wolikow M, Goldberg M, Garabedian M. Dentin structure in familial hypophosphatemic rickets: benefits of vitamin D and phosphate treatment. Oral Dis. 2007;13:482–489. doi: 10.1111/j.1601-0825.2006.01326.x. [DOI] [PubMed] [Google Scholar]
- 43.Abe K, Masatomi Y, Nakajima Y, et al. The occurrence of interglobular dentin in incisors of hypophosphatemic mice fed a high-calcium and high-phosphate diet. J Dent Res. 1992;71:478–483. doi: 10.1177/00220345920710031101. [DOI] [PubMed] [Google Scholar]