Abstract
Optical properties of composite restoratives, both cured and uncured, are of obvious importance in a procedure reliant on photoactivation, since they may affect light transmission and therefore, materials conversion upon which mechanical properties and ultimate clinical performance are dependent. The objective of the present study was to evaluate simultaneous, real-time conversion, temperature and optical properties development. The dimethacrylate resin (BisGMA / TEGDMA 70/30 mass %) was prepared at three filler loading (0, 35 or 70 mass % - no fill, low and high fill, respectively) combined with three initiator concentrations (CQ/EDMAB: 0/0, 0.2/0.8 or 1.0/1.6 mass %). Specimens were exposed to either low (50 mW/cm2) or high (500 mW/cm2) irradiance. Simultaneous conversion (near-IR peak area), temperature (thermocouple) and visible light transmission (UV-Vis spectroscopy) measurements were conducted throughout the polymerization process. The refractive index of the resin rises linearly with conversion (r2 = 0.976), producing a refractive index match between resin/filler at approximately 58 % conversion in these materials. The percentage increase in light transmission during conversion was greater for increasing filler levels. Higher CQ content led to maximum light transmission at slightly higher levels of conversion (60-65 and 50-55 % for the high and low filled materials, respectively). The broad distribution of filler concentrations allows for the clinically relevant generalization that highly filled composites not only jeopardize absolute light transmission, conversion and depth of cure, but also demonstrates the complex interrelationship that exists between materials, processing conditions and the optical properties of dental composites.
Keywords: Dental composites, photopolymerizatoin, reaction kinetics, optical properties, depth of cure
Introduction
Optical properties of dental composites are not only vital for their effective clinical use as esthetic restorative materials, but also affect their photopolymerization. Composite composition, including choice of monomers, fillers and pigments as well as advanced layering placement techniques provide exceptional matching of shade and translucency between the final cured composite and the adjacent natural tooth. Visible light activation of composites is universally recognized as a highly convenient and efficient mode to initiate the polymerization process of these materials. Effective transmission of the photoinitiating wavelength range within the composite is the necessary determinant of the polymerization reaction kinetics as well as the overall conversion achieved, which in turn dictates a variety of non-compromisable physical and mechanical properties of the set composite, such as hardness, strength and wear. There is a well-defined relationship between composite optical properties and depth of cure, which also depends on spectral output, irradiance and exposure time associated with the curing light.[1-4] Changes in either the monomers or the filler used affect the resin-filler refractive index mismatch that in turn affects reaction kinetics and conversion.[5]
A systematic study of light attenuation in commercial dental composites emphasizes the fact that molar extinction coefficients based on unfilled resin cannot be applied to filled systems where scattering and absorption influence pathlength as well as local irradiance and the spectrum of transmitted light.[6] Light attenuation based on absorption has been found to be inversely proportional to incident wavelength while scattering tends to be maximized in the visible wavelength range, which generally coincides with filler particle size for dental composites.[7] Optical studies combining Kubelka and Munk modeling with experimental work has demonstrated that as the refractive index difference between resin and filler narrows, the scattering coefficient decreases and transmission efficiency improves. Along with filler refractive index and loading level, the filler morphology, which includes size and distribution of filler particles affects optical properties.[6, 8, 9] Even without filler, the optical properties of crosslinking monomers change during polymerization with the refractive index rise that accompanies polymerization[10] and light scattering associated with gelation and vitrification.[11]
Photopolymerization kinetics of the resin matrix is complex and incorporation of filler only complicates this further. Factors like initiator absorptivity, concentration and efficiency all influence the rate of initiation but the localized intensity and wavelength of light within the composite are also primary features controlling the photopolymerization process. Several studies have pointed to a modest but significant reduction in final conversion associated with the presence of filler in composites. This effect can be attributed to diminished light transmission, increased glass transition temperature and a reduced exothermic response in filled materials.[12] As a means to improve general understanding of photopolymerization in filled systems, a more comprehensive investigation of the interrelated nature of light, temperature and conversion in both static and actively converting model composite materials.
Materials and Methods
Materials
The comonomer resin matrix used in this study was composed of Bis-GMA (2,2-bis[4-(2-hydroxy-3-methacryloxypropoxy)phenyl]propane; Esstech, Essington, PA) and triethylene glycol dimethacrylate (TEGDMA; Esstech) in a 70:30 weight ratio. The photoinitiator consisted of camphorquinone (CQ; Aldrich Chemical, Milwaukee, WI) combined with ethyl 4-N,N-dimethylaminobenzoate (EDMAB; Aldrich) at either: 0/0 mass %, 0.2/0.8 mass % or 1.0/1.6 mass % (designated as unactivated, low CQ or high CQ, respectively) relative to the monomer mass. The filler consisted of irregular particulate barium glass, which had been pretreated with 3-methacryloxypropyltrimethoxysilane and was used as received from the supplier (0.7 μm average diameter; Schott Glass, Elmsford, NY). The filler content was varied as either: none (designated as no fill), 35 mass % (low fill) or 70 mass % (high fill) based on total composite mass.
Photocuring
Photopolymerization was accomplished with a quartz-tungsten-halogen dental curing light (light guide: 11 mm diameter; VIP, Bisco, Schaumburg, IL) operated with an incident irradiance of 500 mW/cm2 (high) or 50 mW/cm2 (low - obtained by interposing a neutral density filter (optical density of 1) between the curing light and the specimen). These values refer to the effective irradiance reaching the specimen, verified by a visible light radiometer (IL1400A; International Light Technologies, Peabody, MA). Specimen thickness was 0.8 mm (thin) unless specifically noted. In additional experiments, 1.6 (medium) or 3.0 mm (thick) specimens were used. The 60 s curing cycle program of the dental light was used unless otherwise noted. The polymer specimens used for the refractive index measurements were prepared as films (10 × 20 × 0.5 mm) sandwiched between Mylar strips and glass slides. Specimens with incrementally increasing conversion were obtained using irradiation times of 8, 15, 20 and 60 s at an irradiance of 500 mW/cm2. An additional high conversion sample was obtained by a 60 s irradiation in a dental light curing oven (Triad 2000, Dentsply, York, PA), in which the cure temperature reaches approximately 65 °C.
Refractive index
A variable temperature Abbe-type refractometer (2T; Atago, Bellevue, WA) was used to measure refractive indices of unfilled liquid resin or composite paste specimens applied directly to the prisms as well as polymerized resin and composite specimens. The polymer films required addition of 1-bromonaphthalene as a high refractive index interfacial contact agent. Refractive index readings were obtained at room temperature (21.8 ± 0.6 °C) unless otherwise noted. Where necessary, the refractometer was connected to a circulating bath to control the specimen temperature between 20 and 65 °C. Polymer specimens used to assess thermal effects on refractive index were photocured at room temperature and then thermally conditioned for 15 min in an oven at 80°C. A conversion of 73 % was measured at this point by NIR, which was also used to verify that no additional post-cure was obtained during subsequent heating cycles. The refractive index of the particulate filler was determined by analysis of the cosolvent refractive index that provided a transparency maximum as 1-bromonapthalene was added dropwise to a stirred slurry of the filler in isopropanol.
Reaction kinetics and conversion
Near-infrared (NIR) direct transmission spectra were acquired in real-time during photopolymerizations via fiber optic cables (1 m × 1 mm diameter) attached to a Fourier transform infrared spectrophotometer (Nexus 670; Thermo Nicolet, Waltham, MA) equipped with a white light source and MCT/A detector and operated at 8 cm−1 resolution to give a temporal resolution of 0.5 s. The area of the methacrylate vinyl absorbance band centered at 6165 cm−1 was used to follow the polymerization reaction.
Transmitted light intensity
A UV/Vis spectrometer (Ocean Optics USB 2000, Dunedin, FL) with fiber optic input was used to record dynamic full spectrum (240-880 nm averaged from 10 scans) data at a temporal resolution of 0.2 s. The reported UV-Vis optics data are based on the integrated area of the 460-480 nm region of the spectra since this represents the maximum absorbance wavelength for CQ. A variety of neutral density filters were used to accommodate the broad range of transmitted light intensity given by differences in filler contents and specimen thickness. These differences were accounted for in the graphs by normalizing the maximum light transmission in every sample by its light transmission at the initial state. Therefore, data are reported as “relative light transmission”, in percentage values. Transmitted light intensity of the standardized visible curing light output through either unactivated monomer, as resin and composite pastes, or fully cured polymer specimens was also monitored.
Temperature
Internal specimen temperature was measured with an embedded small gauge thermocouple (K-type, 0.13 mm diameter, Omega Engineering, Stamford, CT) placed close to the center of mass with the resulting output signal of a digital thermometer (314 Datalogger; Monarch Instrument, Amherst, NH) conveyed to a computer at a data sampling interval of 1 s. Except as noted, all photopolymerizations were conducted at room temperature; however, in order to isolate the effects of temperature from that associated with conversion and optical properties, a variable intensity infrared heat lamp (250 W, 550-880 nm; Philips) was used to modify the temperature of specimens in either the unpolymerized or fully polymerized state. An aperture was used to restrict the heat lamp exposure to just the mounted specimen. A previous study has shown that the NIR vinyl peak area is not affected by temperatures varying from 20-60 °C.[13] The UV-Vis spectrometer was used to measure the intensity (averaged over 460-480 nm) of the visible curing light transmitted through unactivated specimens (n = 3) of either the unfilled resin or the high fill composite paste at 5 °C increments during the cooling cycles from 60 °C to room temperature. In an identical process, the IR heat lamp was used to examine the temperature dependent optical properties of fully cured unfilled polymer and high fill composite specimens (n = 3), which had been thermally preconditioned to 80 °C.
Experimental set-up
Stable and repeatable orientation and alignment of the specimen, curing light and analytical instrumentation was facilitated with an optical bench (Figure 1) fitted with a collimating lens on the NIR output fiber, which focused the NIR signal through the mounted specimen to a condensing lens that maximized signal collection for the NIR return fiber. The visible light intensity transmitted through the specimen was monitored after passing through a calibrated neutral density filter, an aperture to exclude stray light and finally into the UV/Vis fiber optic inlet.
Figure 1.
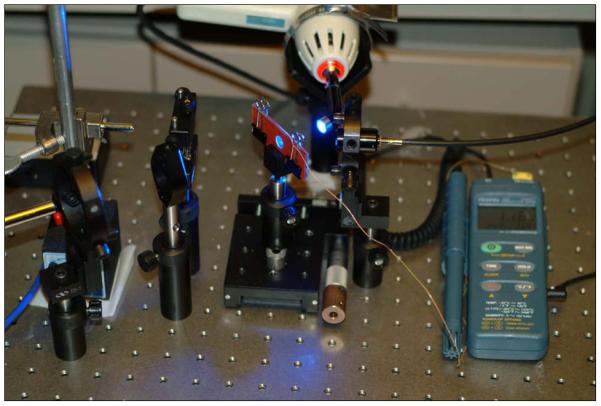
Optical bench arrangement for simultaneous measurement of conversion, optical transmittance and temperature during visible light-activated photopolymerization. Components: A) dental curing light, B) specimen clamped between glass slides. C) NIR fiber optic output directed through a collimated lens, D) condensing lens, E) NIR fiber optic return, F) neutral density filter, G) UV/Vis fiber optic input, H) thermocouple/digital thermometer.
Results and Discussion
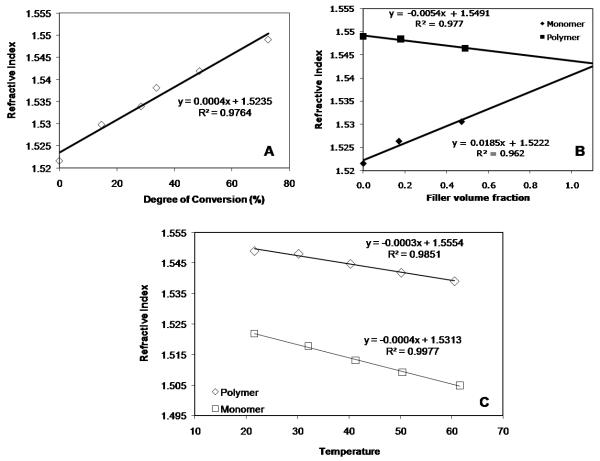
Several fundamental measurements were conducted initially to provide the basis for a better interpretation of the results obtained in the subsequent dynamic kinetics, temperature and light transmission experiments. The refractive index of the monomeric phase is controlled in a linearly additive manner based on the composition of the comonomers used.[14] In this study the standard 70:30 weight ratio of Bis-GMA/TEGDMA monomers provides a resin with a room temperature refractive index (nD22) = 1.5216 ± 0.0003. This result is in agreement with the refractive index calculated based on the mass fraction contributions of the aromatic Bis-GMA monomer (nD22 = 1.5480 ± 0.0007) and the aliphatic TEGDMA comonomer (nD22 = 1.4597 ± 0.0003). The barium glass filler used here provides a refractive index (nD22 = 1.5449 ± 0.0027) significantly greater than that of the uncured resin. However, during polymerization, the refractive index of the resin matrix rises considerably due to increased density coupled with a decrease in polarizability. The partial cure study conducted on the unfilled resin here provided photopolymer samples spanning a range of conversion from less than 15 % to greater than 70 %. A linear dependence (r2 = 0.976) was observed between degree of conversion and refractive index (Figure 2-A). Based on these results, a refractive index match between the matrix and filler phases for this material is expected to occur at approximately 58 % conversion at room temperature. Due to localized heterogeneity in dimethacrylate polymers at all stages of conversion, even at an ideal refractive index match between filler and matrix, some degree of light scattering will persist resulting in translucent materials. It can be anticipated that any changes in resin composition that result in higher initial reactive methacrylate group concentration would correspond with greater changes in refractive index for a given level of conversion. Obviously, variation in the selection of comonomers or their relative proportions provides a simple means to adjust the initial refractive index of the resin.
Figure 2.
Refractive index of Bis-GMA/TEGDMA (70:30 by wt) as affected by (A) degree of conversion (unfilled resins), (B) filler volume fraction (for composites in the monomeric and polymeric states, respectively) and (C) temperature (for unfilled resins in the monomeric and polymeric states, respectively).
In addition to the unfilled materials, refractive indices of both uncured and polymerized composites were determined at the various filler loading levels. Refractive index is an averaged value for heterogeneous materials as is apparent when the values for uncured and cured samples of resin, low fill and high fill materials are compared. When this refractive index data is plotted as a function of filler volume fraction (Figure 2-B), the monomeric and polymeric plots reflect linear fits (r2 = 0.968 and 0.974, respectively). While this was not the main objective of this analysis, the fact that the lines converge serves as an additional independent validation of the filler refractive index (based on density estimates for the monomer (1.15 g/cm3), polymer (1.23 g/cm3) and filler (3.00 g/cm3)). The slope of the refractive index plot for the polymeric materials is less than that of the monomeric series, which reflects that the conversion-dependent iso-refractive index point in this monomer/filler system occurs at relatively high conversion. This technique provides an alternative means to identify the resin conversion level that establishes a refractive index match with filler without resorting to the partial cure study shown in Figure 2-A.
As expected, heating monomer or polymer specimens resulted in decreased refractive index (Figure 2-C) corresponding to density reductions. Excellent linear regression fits were obtained for the unfilled monomers and polymers (r2 values of 0.998 and 0.985, respectively) with differences observed between the slopes (−4.33×10⁻⁴ and −2.66×10⁻⁴ °C−1, respectively) indicative of a reduced coefficient of thermal expansion (CTE) associated with crosslinked polymer compared with unconstrained monomer.[15] The temperature range evaluated in the refractive index thermal response study was selected to encompass the temperature excursions associated with the various resin and composite photopolymerizations conducted here.
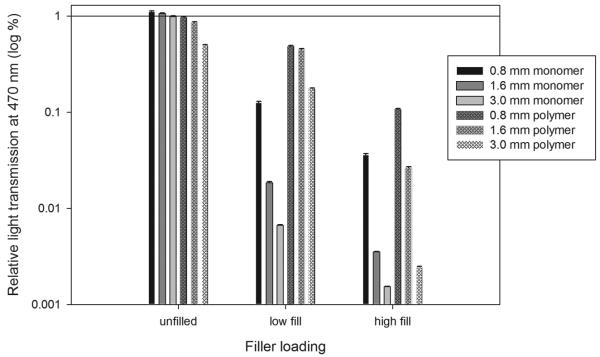
Optical properties in the visible light region, particularly those of the filled materials, are affected by thermal change (Figure 3). The reason for the modest improvement in visible light transmission efficiency with heating for the unfilled materials is unclear. Heating the monomer and polymer specimens may reduce dimensions of microscopic air bubbles or defects, which could account for improved transmission. Apart from that, the demonstrated reduction in refractive index that accompanies the heating of these materials possibly led to a better match with the refractive index of the glass slide (1.517) used to contain the sample. Further evidence for that is the slight increase in light transmission above the baseline for unfilled materials at different thicknesses shown in Figure 4. In the composite materials, the unpolymerized resin has a refractive index below that of the filler and the differential is only enhanced by heating. This effect accounts for the inverse relationship noted between temperature and transmission efficiency for the uncured paste. For the polymerized materials, on the other hand, based on the data presented in Figure 2-C, the refractive index of the organic phase of the composite should coincide with that of the filler at approximately 40 °C, assuming a negligible thermal effect on filler optical properties due to the significantly higher coefficient of thermal expansion. Any exotherm during cure would be expected to impose a transient thermal effect on composite optics in addition to conversion-dependent changes, which may be useful when designing irradiation protocols or other optical parameters in these materials.
Figure 3.
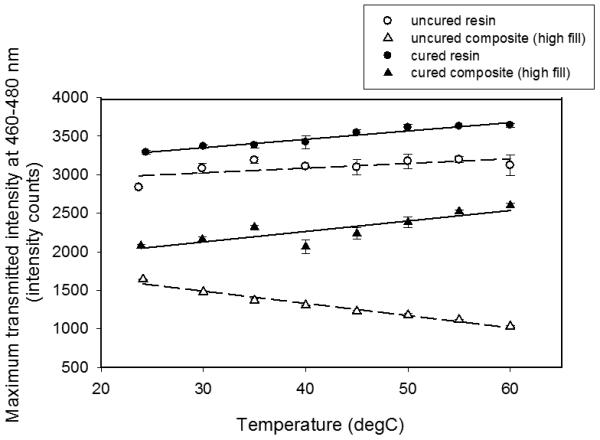
Temperature effects on visible light transmitted intensity at 460-480 nm.
Figure 4.
Normalized transmission at 470 nm as a function of filler loading x specimen thickness in the monomeric and polymeric states. Thin: 0.8 mm; Medium: 1.5 mm; Thick: 3.0 mm.
From the data shown in Figure 4, a trend can be identified for a reduction in transmitted visible light intensity as the specimen thickness increased from 0.8 to 3.0 mm, at the various filler levels. The unfilled monomers consistently provided considerably lower optical densities as compared with the corresponding unfilled polymers, particularly the thick specimens where visible light transmission was reduced by approximately 50 % upon polymerization. In the filled materials, light transmission decays in an exponential manner with specimen thickness; however, in contrast to the unfilled materials, optical translucency was dramatically improved for the polymerized composites compared with the unpolymerized pastes.
The preceding background studies were then applied to help interpret results of the dynamic study of composite photopolymerization, which used simultaneous, real-time monitoring of conversion, temperature and visible light transmission. Conversion results along with corresponding temperature maxima are reported in Table 1. Direct dependencies were evident in photopolymerization rates and limiting conversion values associated with variations in either the initiator concentration or the irradiance level used. The effect of the filler loading level is more complex since similar reaction rates and conversion are observed for the unfilled and high fill materials under analogous curing conditions, both statistically lower than the conversion / rate reached by the low fill material. The trend of the low fill composite to produce a statistically significant greater final conversion than the unfilled resin was observed with the high light intensity for both the high and low CQ pairs as well as the low light intensity, high CQ combination. In spite of the filler content that displaces reactive monomer, equivalent maximum temperatures were achieved in all the paired unfilled and low filled materials whether low or high levels of CQ or light intensities were employed. This seems to suggest that, at the low filler content, the limited replacement of matrix with filler, which still allows appreciable light transmission in the polymeric state, the reduction in the reactive group concentration may be balanced by a rate enhancement effect linked to the filler, perhaps by higher resin viscosity in the vicinity of the particle interfaces. In contrast, the use of high filler content significantly reduced the exothermic response in each case compared with the unfilled and low filled systems, which could explain the lower conversion.
Table 1.
Final conversion (%), temperature maximum (°C) and relative light transmission at P1 (point at which the light curing unit reached its maximum intensity), P2 (maximum light transmission through the sample) and P3 (final light transmission through the sample). t1= time at P1 and t2= time at P2
| Material/Condition | Final Conversion |
Temperature Maximum, °C |
Optical Properties | |
|---|---|---|---|---|
| P1 – P2 / t1 – t2 | P3 – P1 | |||
| High Light Intensity (500 mW/cm2) | ||||
| High fill/low CQ | 0.582 ± 0.011a | 32.2 ± 0.2a | 0.011 ± 0.001a | 0.145 ± 0.011a |
| High fill/low CQ* | 0.600 ± 0.001a | 31.0 ± 0.1a | 0.011 ± 0.001a | 0.160 ± 0.004a |
| High fill/high CQ | 0.667 ± 0.008b | 37.7 ± 1.3b | 0.032 ± 0.002b | 0.217 ± 0.012b |
| Low fill/low CQ | 0.640 ± 0.006c | 44.5 ± 1.6c | 0.019 ± 0.001c | 0.239 ± 0.002b |
| Low fill/ high CQ | 0.716 ± 0.009d | 46.8 ± 2.6c,d | 0.029 ± 0.001b | 0.273 ± 0.009c |
| No fill/low CQ | 0.595 ± 0.004a | 49.5 ± 5.2c,d | - | - |
| No fill/high CQ | 0.678 ± 0.004b | 52.7 ± 1.1d | - | - |
| Low Light Intensity (50 mW/cm2) | ||||
| High fill/low CQ | 0.468 ± 0.016e | 29.3 ± 0.9a | ||
| Low fill/high CQ | 0.585 ± 0.007a | 35.5 ± 2.2a,b | ||
| No fill/high CQ | 0.554 ± 0.004f | 40.0 ± 0.9b | ||
Unless otherwise specified, specimens dimensions: 12 mm diameter × 1.6 mm thick
Specimen dimension: 12 mm diameter × 0.8 mm thick
Within each column, letters designate groupings that are statistically different (ANOVA/Tukey; P < 0.05)
At the onset of photopolymerization, an estimate of the light transmission efficiency at any given depth in the specimen due to absorbance by CQ can be calculated from the Beer-Lambert law as: I'/Io = 10−ε[A]D where: I' and Io correspond to the local and incident irradiance values, respectively; ε = CQ molar absorptivity (46 mol/L at λmax = 469 nm)[16]; [A] = initial CQ concentration; D = depth. This provides an under-estimation of transmission efficiency since monochromatic light was not used and CQ absorbance at wavelengths other than 470 nm is reduced. For a 1.6 mm thick unfilled specimen, the calculation predicts 79.7 % of the initial incident light intensity would reach the back of the specimen. While the low CQ concentration (0.2 mass %) at this thickness does not conform to the thin film approximation, where uniform light intensity (I'/Io ≥ 0.9) is experienced throughout the sample from the onset of polymerization, the 460-480 nm transmission profile measured for the low CQ resin (Figure 5) does not differ significantly from that obtained with the unactivated control (both differ from that of the direct light output). The transmitted light intensity through an empty mold did not change significantly during the 60 s curing cycle. In contrast, the calculated initial 470 nm transmission efficiency for a 1.6 mm thick unfilled high CQ resin is only 56.5 % at the back surface and here the experimental result does show measurable absorbance due to CQ. Due to thermal effects, the polymerization kinetics as a function of depth are complex even when uniform exposure is achieved.[17]
Figure 5.
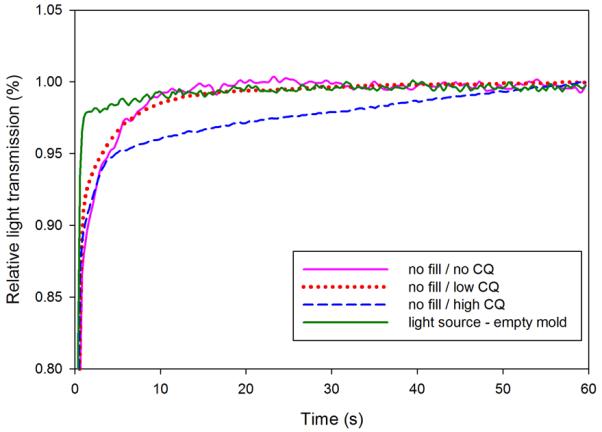
Light transmission increase through the sample relative to the initial state as a function of CQ concentration.
The photo-initiated composite materials produced visible light transmission profiles that varied considerably according to the material composition and curing conditions used (Figure 6). The optics data for high and low intensity is compiled in Table 1 where the designations for P1, P2 and P3 represent the normalized visible light signal intensities at the break point from the initial vertical rise, the maximum and the endpoint, respectively. Figure 6-A shows that, at low filler content, the use of high irradiance results in an a transmission profile with a near-linear rise that reaches a maximum at approximately 10 or 15 s for the high or low CQ concentrations, respectively, and then gradually declines to a constant value prior to the end of the 60 s curing cycle. This corroborates the fact that the light transmission profile correlates well with the conversion development. The maximum in light transmission is reached at an earlier time, although at a later stage of conversion, for the more reactive system (higher CQ concentration). The use of low light intensity intended to highlight the influence of CQ concentration on reaction kinetics and the data in Figure 6-B adds evidence to the correlation between light transmission and conversion development. The rapid rise segment to the light transmission profile, with a broad maximum at approximately 25 s, is only observed for the high CQ concentration. The low CQ/low filler composite results in the elimination of the initial vertical rise component as well as the presence of a maximum in the transmission profile. Instead, there is a steep rise in intensity over the first second of exposure that transitions into an extensive but gradual signal increase that reaches a plateau at approximately 50 s. The photopolymerization of high fill composites produce similar visible light transmission profiles as those described above except that the maxima, while occurring at approximately the same time points as in the low fill analogs, are less pronounced. This shows that, in the filled cases, where the organic matrix participation is obviously smaller, the refractive index matching between filler and resin is a more important factor than CQ consumption and reaction kinetics on light transmission profiles.
Figure 6.
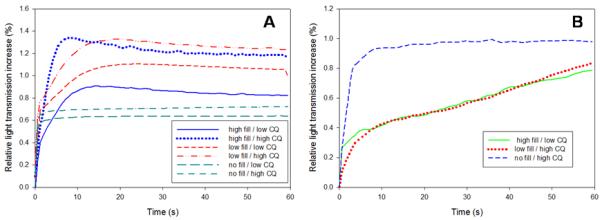
Light transmission increase through the sample relative to the initial state as a function of CQ concentration and filler loading. (A) samples irradiated at HIGH INTENSITY; (B) samples irradiated at LOW INTENSITY.
While the non-uniform visible light transmission profiles during the dynamic photopolymerization of composites are of interest in their own right, the significant benefit of simultaneous optical, thermal and conversion data collection in real time is obtained when the individual data sets are overlaid. As shown in Figure 7, for a representative example (high light intensity, low fill, high CQ), most of the conversion takes place during the irradiation period (60 seconds in this case), with very little dark cure, as previously demonstrated for these dimethacrylates.[18] As expected, the peak exotherm also coincides with the rate maximum for these materials, and that happens at approximately 5 seconds of light exposure. For the filled materials, the point in conversion where maximum light transmission is achieved (Figure 8) varied both with filler and CQ content. It is noteworthy that the data in this figure (as well as in Figure 6) represents the increase in light transmission relative to the initial state (P1) of each material and, therefore, the absolute values should not be compared for different groups (direct associations are shown in Figure 4). That said, the percentage increase in light transmission was greater for increasing filler levels. Moreover, within a given filler concentration, higher CQ content led to maximum light transmission at slightly higher levels of conversion, as expected. In turn, higher filler contents led to maximum light transmission (P2) at lower points in conversion, around 50-55 %, as compared to 60-65 % for the less filled materials. This is due to the fact that the absolute light transmission is reduced (Figure 4) at higher filler loadings, impairing conversion which, in turn, jeopardizes the optimum match of refractive index between the organic and inorganic phase. This confirms the predictions drawn from the separate static studies of conversion and thermal effects on refractive index, discussed earlier (Figure 2-A), in which the optimum match of refractive index between the two phases is achieved above 50 % conversion.
Figure 7.
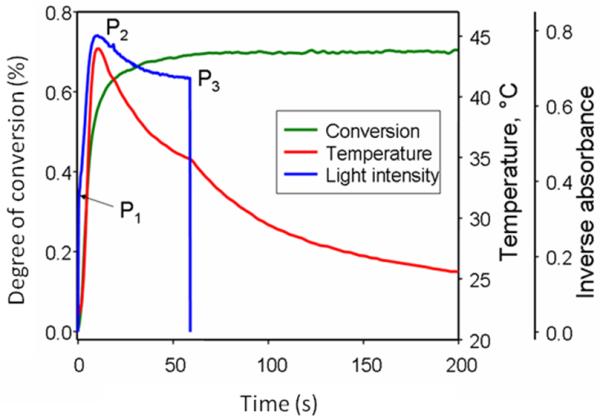
Coupled optical, thermal and conversion data for one representative example (high light / low fill / high CQ).
Figure 8.
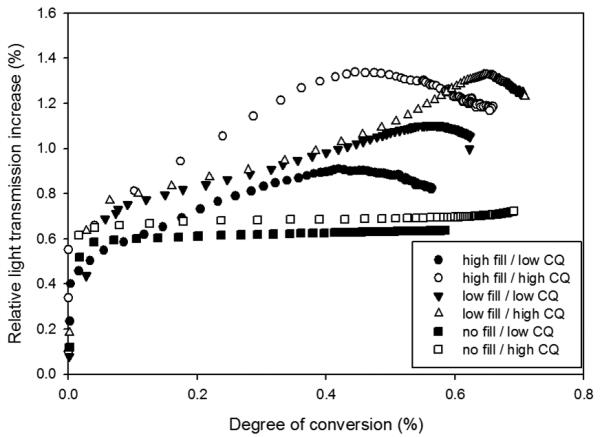
Light transmission increase through the sample relative to the initial state as a function of conversion, as determined by CQ concentration and filler loading. Samples irradiated at HIGH INTENSITY.
The compatibility with regard to optical properties between resin and filler affects not only composite esthetics but also its polymerization behavior. By evaluating light transmission and conversion simultaneously, it is possible to accurately measure and predict the effects of a number of parameters (e.g., filler loading and photosensitizer concentration) on optical properties development as a function of polymerization. These results obtained with the well defined materials analyzed here cannot necessarily be directly extrapolated to commercial materials; however, this fundamental study allows for the clinically relevant generalization that highly filled composites may jeopardize light transmission (and therefore conversion). Moreover, the knowledge that light transmission is maximized at particular stages in conversion may be useful in designing optical parameters both in the light sources and in the composite materials.
Acknowledgements
The authors thank ESSTECH for the donation of monomers used in this study and NIH/NIDCR (2R01DE14227) for financial support.
Footnotes
Publisher's Disclaimer: This is a PDF file of an unedited manuscript that has been accepted for publication. As a service to our customers we are providing this early version of the manuscript. The manuscript will undergo copyediting, typesetting, and review of the resulting proof before it is published in its final citable form. Please note that during the production process errors may be discovered which could affect the content, and all legal disclaimers that apply to the journal pertain.
Contributor Information
Benjamin Howard, University of Colorado Denver, School of Dental Medicine, 12800 E 19 Ave, 80045, Aurora, Colorado behoward@lumc.edu.
Nicholas D. Wilson, University of Colorado Denver, School of Dental Medicine, 12800 E 19 Ave, 80045, Aurora, Colorado Nicholas.wilson@ucdenver.edu.
Sheldon M. Newman, Department of Restorative Dentistry, University of Colorado Denver, School of Dental Medicine, 12800 E 19 Ave, 80045, Aurora, Colorado Sheldon.newman@ucdenver.edu.
Carmem S. Pfeifer, Department of Craniofacial Biology, University of Colorado Denver, School of Dental Medicine, 12800 E 19 Ave, 80045, Aurora, Colorado pfeifercs@gmail.com.
Jeffrey W. Stansbury, Department of Craniofacial Biology, University of Colorado Denver, School of Dental Medicine, 12800 E 19 Ave, 80045, Aurora, Colorado Jeffrey.stansbury@ucdenver.edu.
References
- 1.Cook WD, Beech DR, Tyas MJ. Structure and properties of methaerylate based dental restorative materials. Biomaterials. 1985;6:362–368. doi: 10.1016/0142-9612(85)90094-8. [DOI] [PubMed] [Google Scholar]
- 2.Kawaguchi M, Fukushima T, Miyazaki K. The relationship between cure depth and transmission coefficient of visible light-activated resin composites. J Dent Res. 1994;73:516–521. doi: 10.1177/00220345940730020601. [DOI] [PubMed] [Google Scholar]
- 3.Watts DC, Cash AJ. Analysis of optical transmission by 400-500 nm visible light into aesthetic dental biomaterials. J Dent. 1994;22:112–117. doi: 10.1016/0300-5712(94)90014-0. [DOI] [PubMed] [Google Scholar]
- 4.McCabe JF, Carrick TE. Output from visible-light activation units and depth of cure of light-activated composites. J Dent Res. 1989;68:1534–1539. doi: 10.1177/00220345890680111301. [DOI] [PubMed] [Google Scholar]
- 5.Fujita K, Nishiyama N, Nemoto K, Okada T, Ikemi T. Effect of base monomer's refractive index on curing depth and polymerization conversion of photo-cured resin composites. Dent Mater J. 2005;24:403–408. doi: 10.4012/dmj.24.403. [DOI] [PubMed] [Google Scholar]
- 6.Musanje L, Darvell BW. Curing-light attenuation in filled-resin restorative materials. Dent Mater. 2006;22:804–817. doi: 10.1016/j.dental.2005.11.009. [DOI] [PubMed] [Google Scholar]
- 7.Taira M, Okazaki M, Takahashi J. Studies on optical properties of two commercial visible-light-cured composite resins by diffuse reflectance measurements. J Oral Rehab. 1999;26:329–337. doi: 10.1046/j.1365-2842.1999.00378.x. [DOI] [PubMed] [Google Scholar]
- 8.Shortall AC, Palin WM, Burtscher P. Refractive index mismatch and monomer reactivity influence composite curing depth. J Dent Res. 2008;87:84–88. doi: 10.1177/154405910808700115. [DOI] [PubMed] [Google Scholar]
- 9.Arikawa H, Kanie T, Fujii K, Takahashi H, Ban S. Effect of filler properties in composite resins on light transmittance characteristics and color. Dent Mater J. 2007;26:38–44. doi: 10.4012/dmj.26.38. [DOI] [PubMed] [Google Scholar]
- 10.Odian G. Principles of polymerization. 4th ed. John Wiley & Sons; New York: 2004. [Google Scholar]
- 11.Shibayama M, Ozeki S, Norisuye T. Real-time dynamic light scattering on gelation and vitrification. Polymer. 2005;46:2381–2388. [Google Scholar]
- 12.Nunes TG, Pereira SG, Kalachandra S. Effect of treated filler loading on the photopolymerization inhibition and shrinkage of a dimethacrylate matrix. J Mater Scie: Mater Med. 2008;19:1881–1889. doi: 10.1007/s10856-007-3247-7. [DOI] [PubMed] [Google Scholar]
- 13.Stansbury J, Dickens S. Determination of double bond conversion in dental resins by near infrared spectroscopy. Dent Mater. 2001;17:71–79. doi: 10.1016/s0109-5641(00)00062-2. [DOI] [PubMed] [Google Scholar]
- 14.Suzuki H, Taira M, Wakasa K, Yamaki M. Refractive-Index-Adjustable Fillers for Visible-Light-Cured Dental Resin Composites - Preparation of Tio2-Sio2 Glass Powder by the Sol-Gel Process. J Dent Res. 1991;70:883–888. doi: 10.1177/00220345910700050401. [DOI] [PubMed] [Google Scholar]
- 15.Mucci V, Arenas G, Duchowicz R, Cook WD, Vallo C. Influence of thermal expansion on shrinkage during photopolymerization of dental resins based on bis-GMA/TEGDMA. Dent Mater. 2009;25:103–114. doi: 10.1016/j.dental.2008.04.014. [DOI] [PubMed] [Google Scholar]
- 16.Chen YC, Ferracane JL, Prahl SA. Quantum yield of conversion of the photoinitiator camphorquinone. Dent Mater. 2007;23:655–664. doi: 10.1016/j.dental.2006.06.005. [DOI] [PubMed] [Google Scholar]
- 17.Lovestead TM, O'Brien AK, Bowman CN. Models of multivinyl free radical photopolymerization kinetics. J Photochem Photobio A-Chem. 2003;159:135–143. [Google Scholar]
- 18.Bagis YH, Rueggeberg FA. Effect of post-cure temperature and heat duration on monomer conversion of photo-activated dental resin composite. Dent Mater. 1997;13:228–232. doi: 10.1016/S0109-5641(97)80033-4. [DOI] [PubMed] [Google Scholar]


