

Abstract
Local aromatization of testosterone into 17β-estradiol (E2) is often required for the physiological and behavioral actions of testosterone. In most vertebrates, aromatase is expressed in a few discrete brain regions. While many studies have measured brain aromatase mRNA or activity, very few studies have measured brain E2 levels, particularly in discrete brain regions, because of technical challenges. Here, we used the Palkovits punch technique to isolate 13 discrete brain nuclei from adult male zebra finches. Steroids were extracted via solid phase extraction. E2 was then measured with an ultrasensitive, specific and precise radioimmunoassay. Our protocol leads to high recovery of E2 (84%) and effectively removes interfering brain lipids. E2 levels were high in aromatase-rich regions such as caudal medial nidopallium and hippocampus. E2 levels were intermediate in the medial preoptic area, ventromedial nucleus of the hypothalamus, lateral and medial magnocellular nuclei of anterior nidopallium, nucleus taeniae of the amygdala, and Area X. E2 levels were largely non-detectable in the cerebellum, HVC, lateral nidopallium and optic lobes. Importantly, E2 levels were significantly lower in plasma than in the caudal medial nidopallium. This protocol allows one to measure E2 in discrete brain regions and potentially relate local E2 concentrations to aromatase activity and behavior.
Keywords: steroid, estrogens, songbird, aromatase, solid phase extraction, neurosteroid, testosterone, NCM, fadrozole, song, hippocampus
INTRODUCTION
Aromatization of testosterone into 17β–estradiol (E2) within the brain is critical for many behavioral actions of testosterone, such as regulation of aggressive and reproductive behavior (Naftolin et al., 1975; Schlinger and Callard, 1990; Balthazart and Foidart, 1993; Soma et al., 2003; Soma et al., 2008) as well as cognition and learning (Oberlander et al., 2004; Garcia-Segura, 2008; Roselli et al., 2009). Classically, E2 has been thought to act via specific interactions with its cognate nuclear receptors. The binding of E2 to nuclear receptors regulates transcription of target genes, and this process usually takes hours to days (Mangelsdorf et al., 1995). Recent evidence suggests that E2, as well as other steroids, also affects brain and behavior very rapidly. For example, E2 can within a few seconds or minutes modulate neuronal firing rate or activate a variety of intracellular signaling pathways (Kelly and Ronnekleiv, 2008; Micevych and Mermelstein, 2008) and can rapidly modulate sexual behavior (Cornil et al., 2003) and agonistic behavior (Remage-Healey and Bass, 2004; Trainor et al., 2008).
E2 concentrations are unlikely to be homogenous throughout the brain but rather vary across regions. Indeed, the enzyme responsible for the transformation of testosterone into E2, P450 aromatase, is present only in discrete brain regions, such as the preoptic area and hippocampus, in many vertebrates (Selmanoff et al., 1977; Schumacher et al., 1983; Roselli et al., 1985; Shen et al., 1995). In songbirds, there is more widespread expression of aromatase in the telencephalon (Balthazart et al., 1996; Silverin et al., 2000; Saldanha et al., 2000). While certain songbird brain regions such as the medial preoptic nucleus and caudal medial nidopallium (NCM) contain aromatase-immunoreactive cell bodies and fibers (Balthazart et al., 1996; Saldanha et al., 2000), other regions such as HVC (abbreviation used as proper name) and the shell of the robust nucleus of the arcopallium (RA) contain only aromatase-immunoreactive fibers and terminals (Saldanha et al., 2000; Peterson et al., 2005). The localized presence of aromatase suggests that the transformation of testosterone into E2 occurs in discrete brain regions and could lead to high local concentrations of E2 without affecting the periphery (Schmidt et al., 2008) Aromatase activity shows long-term, region-specific changes induced by chronic testosterone treatment and season (Schumacher and Balthazart, 1986; Soma et al., 2003). In parallel, more rapid changes in aromatase activity are also observed in certain brain regions (Cornil et al., 2005; Remage-Healey et al., 2009). These data on aromatase suggest that regional E2 levels also vary, but the quantification of E2 in discrete brain regions remains a challenge. A few studies have measured E2 in relatively large pieces of brain following manual dissection (Amateau et al., 2004; Newman et al., 2008; Barker and Galea, 2009).
Here, we describe a method to quantify E2 in microdissected brain regions from the zebra finch (Taeniopygia guttata). We used the Palkovits punch technique to collect 13 discrete regions from adult male zebra finch brain. We then developed an ultrasensitive and highly specific radioimmunoassay to measure E2. The first major challenge is the presence in the brain of high concentrations of lipids, which interfere with immunoassays (Rash et al., 1980; Jawad et al., 1981). Although organic solvents have been traditionally used to extract steroids, solid phase extraction offers higher and more consistent analyte recoveries and a more complete removal of interfering substances. The second major challenge is the very small amount of tissue obtained from the microdissection technique, which reduces the probability of obtaining a detectable amount of E2. We show here that the combination of Palkovits punch technique, solid phase extraction, and ultrasensitive radioimmunoassay allows for the measurement of E2 in discrete brain regions.
MATERIALS AND METHODS
Experimental animals
Animal use protocols were approved by the Animal Care Committee at the University of British Columbia and conform to the guidelines of the Canadian Council on Animal Care. Adult sexually-naïve male zebra finches (Taeniopygia guttata) were single-sex, group-housed and given millet seeds, water, grit, and cuttlefish bone ad libitum. The very high level of brain aromatase in zebra finch (Silverin at al. 2000) suggests that E2 will be important and more readily detectable to develop our protocol. The light cycle provided 14 h of light and 10 h of dark (lights on at 8:00 A.M.). Temperature was held constant at ~23°C and relative humidity at ~50%. Animals were killed between 8:30 and 10:00 AM within 3 min of disturbance to avoid potential effects of time of day or stress on steroid concentrations.
Palkovits punch technique
The technique originally developed by Palkovits in rats (Palkovits, 1973) was previously validated in quail (Schumacher and Balthazart, 1987) and zebra finch brain (Vockel et al., 1990) and was used here with only minor modifications. After rapid decapitation, brains were quickly removed out of the skull, frozen on dry ice, and stored at −80°C. Brains were embedded in Shandon Cryomatrix (ThermoFisher), with the forebrain facing the specimen holder of the cryostat (Microm HM505E). Coronal sections (300 micrometers) were made in the cryostat at −12°C and were collected starting from the caudal part of the brain. The plane of the sections was adjusted to match as closely as possible the plane of the zebra finch brain atlas (Nixdorf-bergweiler and Bischof, 2007). From these sections, individual nuclei were isolated from 2 to 5 adjacent sections, depending on the region of interest, by punching them out with stainless steel cannula (Brain Punch Set, #57401, Stoelting Co, IL). The diameter of cannula was adapted to the nucleus of interest: 0.74mm-diameter punches were obtained from RA, nucleus taeniae of the amygdala (TnA), and HVC; and 0.94 mm-diameter punches were obtained from lateral nidopallium (LatNP), hippocampus (Hp), caudal medial nidopallium (NCM), optic lobes (OL), ventromedial nucleus of the hypothalamus (VMN), medial preoptic area (mPOA), lateral magnocellular nucleus of anterior nidopallium (LMAN), medial magnocellular nucleus of anterior nidopallium (MMAN), and Area X (see Figure 1 for the location and Table 1 for the number of punches and mass of tissue obtained). It should be noted that some of the punches were only partial due to the proximity of ventricles (e.g. HVC and TnA) Punches were collected into pre-weighed “Pellet Pestle” microcentrifuge tubes (0.5 ml volume; #749510-0501, Kimble/Kontes, NJ, USA) and weighed as quickly as possible. The mass of tissue (to the nearest 0.1 mg) was obtained by subtracting the mass of the empty microcentrifuge tube from the mass of the microcentrifuge tube containing the tissue. The samples were stored at −80°C. Trunk blood was collected at sacrifice and centrifuged for 10 min at 10,000g. Plasma was stored at −80°C.
Figure 1.

Schematic representation of the location of the punches, as identified by circles in the transversal sections. (A–H) Sections arranged in a rostral to caudal order. Abbreviations: Cb, cerebellum; CoA, anterior commissure; CP, posterior commissure; FA, fronto-arcopallial tract; FLM, fasciculus longitudinalis medialis (medial longitudinal bundle); GCt, mesencephalic central gray (periaqueductal gray); HA, accessory part of the hyperpallium; Hp, hippocampus; ICo, intercollicular nucleus; IPc, parvocellular part of the isthmi nucleus; LaM, mesopallial lamina; LatNP, lateral nidopallium; LMAN, lateral magnocellular nucleus of the anterior nidopallium; LoC, locus ceruleus; LPS, pallial-subpallial lamina; LSt, lateral striatum; M, mesopallium; MFL, supreme frontal lamina; MLd, lateral mesencephalic nucleus; MMAN, medial magnocellular nucleus of the anterior nidopallium; mPOA, median preoptic area; MSt, medial striatum; N, nidopallium; NC, caudal nidopallium; NCM, caudal medial nidopallium; NIf, nucleus interface of the nidopallium; NIII, oculomotor nerve; OL, optic lobe; OM, occipito-mesencephalic tract; RA, robust nucleus of arcopallium; Rt, nucleus rotundus; Ru, red nucleus; SCd, dorsal subceruleus nucleus; SFL, superior frontal lamina; SL, lateral septal nucleus; SNc, substantia nigra, pars compacta; TnA, nucleus taeniae of the amygdala; UVA, nucleus uveaformis; V, ventricle; VMN, ventromedial nucleus of the hypothalamus; VTA, ventral tegmental area; X, Area X
Table 1.
Number (range) and weight (mean ± standard error of the mean) of punches from the 13 different brain regions.
| Number of punches (range) | Weight (mg) mean ± SEM | Aromatase expression | |
|---|---|---|---|
| X | 2 – 6 | 5.42 ± 0.13 | 0 |
| LMAN | 2 – 6 | 5.53 ± 0.21 | 0 |
| MMAN | 2 – 6 | 4.78 ± 0.11 | + |
| mPOA | 4 – 6 | 4.74 ± 0.07 | ++ |
| VMN | 4 – 6 | 4.61 ± 0.11 | ++ |
| HP | 8 | 4.41 ± 0.08 | +++ |
| LatNP | 6 | 5.05 ± 0.11 | 0 |
| OL | 8 – 10 | 5.86 ± 0.10 | 0 |
| NCM | 8 | 5.21 ± 0.17 | +++ |
| HVC | 4 – 8 | 4.18 ± 0.07 | F |
| TnA | 6 | 3.75 ± 0.11 | ++ |
| RA | 6 – 8 | 3.70 ± 0.08 | F |
| Cb | 8 – 10 | 5.06 ± 0.08 | + |
Note: We indicated the level of aromatase expression in the different brain regions (Saldanha et al., 2000), from no aromatase-immunoreactive cells (0) to high level of immunopositive cells (+++). While aromatase cell bodies are not observed in some regions, these regions present aromatase-immunoreactive fibers (F; Peteron et al., 2005)
Solid phase extraction
Brain punches were homogenized in the microcentrifuge tubes with a CTFE/stainless steel “Pellet Pestle” (#749516-0500, Kimble/Kontes) with 50 μl ice-cold deionized water, and then 250 μl ice-cold methanol (HPLC-grade) was quickly added. Samples were left overnight at 4°C. Steroids were then extracted with solid phase extraction (Newman et al., 2008). We used a 24-place vacuum manifold and non-endcapped C18 columns (500 mg C18 material, 6 ml column volume, United Chemical Technologies). Columns were primed with absolute ethanol (3 ml) and equilibrated with deionized water (2 × 5 ml). 10 ml of deionized water was added to the brain samples and to plasma samples (52 μl), before loading onto the C18 columns. After sample loading, the C18 columns were washed with deionized water (2 × 5 ml), and the steroids were slowly eluted with 90% HPLC-grade methanol (5 ml). The eluates were then dried (Speedvac) prior to resuspension.
Several resuspension conditions were tested to maximize E2 recovery. We analyzed the effect of the volume of resuspension buffer (400 or 800 μl) as well as sonication (0, 5, 30 or 60 min) on the recovery of a known amount of tritiated E2 (Perkin Elmer). In addition, we previously showed that adding a small amount of ethanol increases the recovery of steroids (Newman et al., 2008). However, ethanol can affect immunoassays, and therefore we determined whether increasing concentrations of ethanol (0, 0.5, 1, 1.5, 3 and 5%) had an effect on known concentrations of E2 (0.7125 and 1.425 pg per tube). Absolute ethanol was added directly to the bottom of the glass scintillation vials containing the dried eluates, the vials were vortexed for 2 min, and 0.1M phosphate-buffered saline containing 0.1% gelatin (PBSG) was then added. Based on initial results, we resuspended our samples in 650 μl PBSG and 0.7% ethanol (see details in the “Results” section below).
Estradiol radioimmunoassay
Resuspended samples were then run in duplicate using a commercially available double-antibody 125I-E2 radioimmunoassay (DSL-4800, Ultra-sensitive Estradiol RIA, Diagnostic System Laboratories, Webster, TX) that we modified and validated, similar to our previous studies with a different E2 assay (DSL-39100) (Newman et al., 2008; Shirtcliff et al., 2000). The DSL-39100 assay is no longer available, and thus we validated the DSL-4800 E2 assay. We tested different dilutions of the tracer and the antibody to increase the sensitivity of the assay. The protocol presented below offered the most sensitive and precise assay. Briefly, 100 μl of diluted anti-estradiol antiserum (dilution: 1 ml stock antibody + 2.5 ml PBSG) was added to 300 μl of sample, the tubes were quickly vortexed and incubated at room temperature for 4 hr. Then 100 μl of diluted 125I-E2 (dilution: 1 ml stock tracer + 2 ml PBSG) was added, and the tubes were vortexed and incubated for 24 hr at 4°C. Then 500 μl of precipitating reagent was added, and tubes were vortexed and incubated for 20 min at room temperature. The tubes were centrifuged at 1500g for 15 min at 4°C, the supernatant was decanted, and tubes were counted. The E2 antibody has a low cross-reactivity with estrone (2.4%), estriol (0.64%), 17β-estradiol (0.21%), 17β-estradiol-3-glucuronide (2.56%), 17β-estradiol-17-glucuronide (<0.01%), estradiol-3-SO4 (0.17%), testosterone (<0.01%) and DHEA (<0.01%), as per the manufacturer.
We also examined the recovery of a known quantity of radioinert E2 (0.9 pg per assay tube) added to brain tissue (1.59 mg of dorsal telencephalon containing NCM per assay tube) before solid phase extraction. We calculated the recovery by comparing the quantity of E2 in spiked (n=7) and unspiked samples (n=6).
Moreover, to further evaluate whether solid phase extraction effectively removed interfering substances, we serially diluted brain samples (from 11.8 to 0.18 mg per tube). If the substances that interfere with the RIA are effectively removed, the percentage of tracer bound from serially diluted samples should be parallel to the standard curve.
Testosterone radioimmunoassay
Total testosterone levels in plasma were measured using radioimmunoassay. Testosterone was extracted from plasma with HPLC-grade dichloromethane prior to radioimmunoassay. Briefly, steroids from 11.5 μl of plasma were extracted twice with 3 ml dichloromethane. Dichloromethane was then evaporated under nitrogen at 37°C. Steroids were resuspended in 900 μl PBSG.
Resuspended samples were then run in duplicate using a commercially available testosterone radioimmunoassay (DSL-4100) that was modified to increase sensitivity (Granger et al., 1999) and validated for songbirds (Charlier et al., 2009). Briefly, 20 μl anti-testosterone antiserum was added to 400 μl of sample, and the tubes were incubated at 37°C in a shaking water bath for 30 min. Then 50 μl of 125I-testosterone was added, and the tubes were vortexed and incubated for 3 hr at 37°C. 500 μl of precipitating reagent was then added, and tubes were vortexed and incubated for 20 min at room temperature. The tubes were then centrifuged at 1000g for 15 min at 4°C, the supernatant was decanted, and tubes were counted. The testosterone antibody has a low cross-reactivity with 5α-dihydrotestosterone (6.6%), androstenedione (0.9%), E2 (0.4%), dehydroepiandrosterone (<0.1%), corticosterone (<0.1%) and progesterone (<0.1%). The lowest point on the standard curve was 0.4 pg testosterone/tube, and the detection limit for our assays with 5 μL plasma/tube was 80 pg/ml. Intra-assay variation was 6.2%, and inter-assay variation was 4.3%.
Fadrozole treatment
We tested the effects of fadrozole, a potent and specific non-steroidal inhibitor of aromatase, on E2 levels in zebra finches. Fadrozole is known to reduce brain aromatase activity in this species (Wade et al., 1994). We injected adult male zebra finches intramuscularly in the breast muscle with 200 μg of fadrozole in saline (generous gift from Novartis, n=8) or saline vehicle (20 μl) (n=8). 24 hr after injection, the birds were rapidly decapitated, and we collected trunk blood to measure plasma E2 and dorsal telencephalon, containing the NCM, to measure brain E2. The mass of the dorsal telencephalon obtained from manual dissection was 14.00 ± 1.08 mg. Two values, one in each group, were over 2 standard deviations from the mean of their group and were therefore excluded.
Nissl staining
After the punch collection, sections were mounted on glass slides, dried overnight and Nissl-stained to confirm the location of the punches. Briefly, sections were allowed to return to room temperature and were postfixed in 4% paraformaldehyde for 15 min. The sections were rinsed 3 times in PBS (0.1M) and stained in 0.2% toluidine blue in Walpole solution (0.3M sodium acetate, 0.12% acetic acid) for 2 min. The sections were then quickly rinsed in deionized water, destained 2 × 15 min in Walpole solution, and the stain fixed by a 2.5 min incubation in 0.04M ammonium molybdate tetrahydrate. The sections were then dehydrated with increasing concentration of ethanol (20, 70, and 90% for 1 min), acetone (2 × 1 min) then xylene (2 min) before coverslipping with Permount® mounting medium (Fisher).
Statistical analysis
All data are presented as their mean ± SEM. Data analysis included Student’s t-test and one- and two-way ANOVAs and were performed using Statview and SuperAnova (MacIntosh version 5.0.1, Abacus Concept Inc., Berkeley, CA, USA). When appropriate, ANOVA tests were followed by post hoc Tukey’s HSD tests. To compare E2 concentrations in brain tissue and plasma, it was assumed that 1 mL of plasma weighs 1 g, as previously shown (Schmidt and Soma, 2008). To determine parallelism between serial dilution of brain tissue and standard curve, we tested equality of slopes from linear regressions of log-transformed concentration (standard curve) or tissue amount (telencephalon) and percent binding using Prism 4 (v1.0, 2002, GraphPad, CA). Differences were considered significant for p ≤ 0.05.
RESULTS
Modifications of E2 radioimmunoassay
After modifications, the lowest point on the standard curve was 0.1875 pg E2 per tube. In contrast, the lowest point on the standard curve for the unmodified assay was 1.66 pg E2 per tube, indicating an approximate 10-fold increase in sensitivity. The values for the water blanks (n=9) were below the lowest standard (0.120 ± 0.018 pg E2 per tube). Samples within 2 standard deviations of the water blanks were considered non-detectable and set to zero. Intra-assay variation was 1.81%, and inter-assay variation was 6.10% for a low control (0.375 pg E2 per tube, n=6 assays) and 4.42% for a high control (1.125 pg E2 per tube, n=6 assays).
Recovery of radiolabeled E2
We first tested different conditions for the resuspension of E2 after solid phase extraction. We added a known amount of tritiated E2 to 5 ml of 90% methanol, dried the samples, and tested the effects of the volume of resuspension and of sonication. There was no significant effect of the volume of resuspension buffer (df=8, t=1.915, p=0.10) or sonication (F3,15=1.158, p=0.35). Overall, the recovery of tritiated E2 was 78.94 ± 1.44% (n=29 samples).
Recovery of radioinert E2 after solid phase extraction
Ethanol in the resuspension buffer can improve the recovery of E2 and other steroids (Newman et al., 2008; Charlier et al., 2009). However, ethanol can potentially affect the radioimmunoassay, so we tested the effects of different concentrations of ethanol on the measurement of 2 known concentrations of E2 (0.7125 and 1.425 pg per tube; all data were expressed as percentage of controls without ethanol). The concentration of ethanol significantly affected the measured E2 values (2-way ANOVA: F4,50=133.5, p=0.0001, Figure 2A), but there was no difference between E2 concentrations (F1,50=0.88, p=0.35) and no interaction between ethanol and E2 concentration (F4,50=1.62, p=0.18). The absence of an interaction indicates that the effect of ethanol is similar across different concentrations of E2. Importantly, the magnitude of the ethanol effect is extremely small at concentrations of ethanol below 1% (i.e., less than a 5% decrease in measured E2 values). Based on these data, we used a relatively low concentration of ethanol (0.7%) in the resuspension to increase the recovery of E2, without greatly affecting the E2 radioimmunoassay.
Figure 2.

A. Bar graph representing the effect of increasing concentration of ethanol (0, 0.5, 1, 3, and 5%) on the E2 RIA. Two concentrations of E2 were used (0.712 and 1.425 pg per tube). *p<0.05 vs 0% ethanol (control). B. Bar graph representing the recovery of a known amount of E2 (0.9 pg per tube) that was added to telencephalon samples prior to solid phase extraction and then measured via RIA. The recovery was 84.19%. C. Comparison of serial diluted brain tissue and standard curve to confirm that solid phase extraction effectively removed interfering substances. D. Bar graph representing the effect of fadrozole treatment on E2 concentrations in the plasma and in the telencephalon and the significant difference between E2 level in telencephalon and plasma. *p<0.05 vs control; *** p<0.001 vs telencephalon
Next, we determined the recovery of a known amount of E2 (0.9 pg per tube) that was added to a pool of telencephalic tissue (n=7, 1.59 mg of tissue per tube) prior to solid phase extraction. We compared spiked and unspiked samples from the same pool of tissue, and the recovery of radioinert E2 was 84.19% (Figure 2B).
Removal of interfering substances
To test whether the solid phase extraction protocol effectively removed interfering substances such as lipids from brain samples, we compared serial diluted brain samples and the standard curve. The slope of the curve obtained from serially diluted telencephalon was not significantly different from the slope of the E2 standard curve, for samples containing between 1.48 and 11.8 mg of tissue per tube (F1,4= 1.47, p=0.29, Figure 2C). At lower quantities of tissue per tube, there was a trend for the slopes to differ (F1,10=4.57, p=0.06). Thus, we aimed for our samples to contain the appropriate amount of tissue per assay tube. Overall, the solid phase extraction protocol effectively removed interfering brain lipids.
Effect of fadrozole
Further validations of the quantification of E2 were obtained via the in vivo inhibition of E2 synthesis using fadrozole. As can be seen in Figure 2D, E2 content in the telencephalon and in the plasma was significantly reduced 24 hr after a single injection of fadrozole. A 2-way ANOVA showed a significant effect of the fadrozole treatment (F1,25= 6.283, p=0.019) as well as a significant effect of sample type (telencephalon vs plasma) (F1,25= 17.80, p<0.001) where E2 concentration in the telencephalon was higher than in plasma. There was no interaction between sample type and fadrozole treatment (F1,25= 0.89, p=0.35).
E2 concentration in brain punches
The validations described above confirm that E2 can be quantified from very small brain samples using our modified RIA after SPE. The weight of the brain samples ranged between 3.70 and 5.86 mg of tissue, obtained from 4 to 10 punches (Table 1). Several nuclei from most individuals showed detectable levels of E2. A significant regional difference in E2 concentrations was observed (F13,91= 2.457, p=0.007) and NCM showed significantly higher concentrations compared to plasma, TnA, Cb, HVC, LatNP, OL, VMN, Area X (post hoc Tukey’s tests, p<0.05, see Figure 3). It should also be noted that the heterogeneity of E2 content was reflected by the percentage of detectable samples for each region. This percentage for each brain nucleus is presented in Figure 3. The percentage of detectable samples was highest in NCM and HP, intermediate in MMAN, mPOA and VMN, and low in HVC, LatNP, OL and CB. In addition, brain levels of E2 are in general higher than plasma E2 levels, when considering that 1 ml of plasma weighs 1 g (Schmidt and Soma, 2008).
Figure 3.

Bar graph representing the E2 concentrations in the plasma and in 13 different brain regions in adult male zebra finches. Numbers indicate the percentage of detectable samples. *p<0.05 vs NCM
Circulating testosterone levels were ~100× higher than circulating levels of E2 (Wilcoxon signed rank test: p=0.008, Figure 4). The levels of plasma testosterone and plasma E2 were not correlated although there was a tendency (p=0.09). In addition, circulating levels of testosterone were not correlated with the level of E2 in any brain nuclei (data not shown, all p>0.1). It should, however, be noted that 2 subjects had very low levels of plasma testosterone compared to the other birds (< 1 ng/ml), and very interestingly had less E2 in their brain regions.
Figure 4.
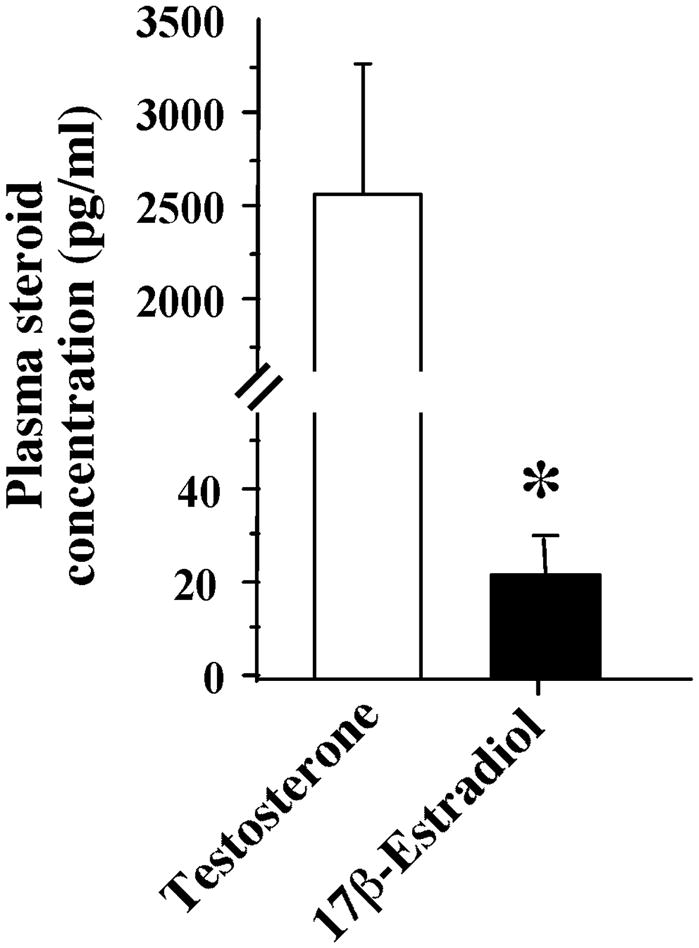
Bar graph representing the plasma concentration of testosterone and estradiol. *p<0.05 vs testosterone
DISCUSSION
We describe here the use of solid phase extraction prior to radioimmunoassay of E2 on microdissected brain samples. The solid phase extraction procedure leads to relatively high recovery of E2 and effectively removes interfering lipids. Moreover, the development of an ultrasensitive assay to measure E2 allowed us to detect small amounts of E2 in punches weighing a few milligrams. Previous studies have examined the concentration of E2 in various regions in rat brain (Bixo et al., 1986; Amateau et al., 2004; Pei et al., 2006; Barker and Galea, 2009) and human brain (Bixo et al., 1995). Recent studies have also used liquid or gas chromatography coupled to mass spectrometry to measure E2 (Shimada et al., 1999; Labombarda et al., 2006; Caruso et al., 2008; Higo et al., 2009). However, all of these studies examined E2 content in large brain regions, such as the cortex or hypothalamus. We describe here a sensitive and specific method to quantify E2 in small, discrete brain regions using the Palkovits punch technique and analyzed 13 different regions within individuals.
Estradiol radioimmunoassay
We evaluated 4 aspects of our E2 assay (Midgley et al., 1969; Abraham, 1975).
Sensitivity
While the lowest point on the standard curve of the unmodified assay was 1.66 pg E2 per tube, we modified this assay to increase the sensitivity nearly 10-fold and were able to detect as little as 0.1875 pg E2 per tube.
Precision
The precision of our assay was confirmed by the relatively low intra- and inter-assay coefficients of variability (~2 and 6%, respectively).
Accuracy
Using controls containing known amounts of E2, we confirmed the high accuracy of the assay (e.g., Fig. 2A). Moreover, when comparing spiked and unspiked brain samples, the difference was close to the expected value (i.e., the added amount of estradiol).
Specificity
The E2 antibody has very weak cross-reactivities for other steroids, including estrone, estriol, 17β-estradiol, testosterone and DHEA. In addition, the “interference elution” with deionized water in the solid phase extraction procedure should eliminate most water-soluble metabolites, such as E2 glucuronides and sulfates. Moreover, an aromatase inhibitor (fadrozole) significantly reduced both circulating and brain E2 levels. Fadrozole treatment did not reduce E2 values to non-detectable levels, and it is possible that the dose of fadrozole or the duration of treatment were not optimal. Several fadrozole doses and time points were previously tested by Wade and colleagues (1994), but aromatase activity was never fully inhibited, similar to the present results.
Solid phase extraction
The solid phase extraction protocol yielded consistent and high recovery (~80%) and removed major interfering substances (as in Newman et al., 2008). We examined recovery using radiolabeled E2, and in addition spiked brain samples with a known amount of radioinert E2. The results of these studies were highly consistent (recovery was ~80% in both cases). In addition, a serial dilution of telencephalon is parallel to the standard curve, demonstrating the effective removal of interfering lipids. The protocol might be improved even further through the use of a different washing protocol, such as 40% methanol instead of water (Belanger et al., 1990).
Regional differences in E2 concentrations
The concentration of E2 in the plasma was lower than in most brain regions, as in rats (Bixo et al., 1986; Higo et al., 2009). The high percentage of plasma samples with detectable amounts of E2 was probably due to the larger quantity of plasma than brain tissue in punches. Future work could pool brain tissue from a few individuals to increase the probability of detecting E2 in areas such as RA or HVC. Alternatively, samples could be run as singletons rather than in duplicate, given the very low intra-assay variability and close correspondence between duplicates.
The concentrations of E2 in the brain appear highest in NCM and hippocampus. High local concentrations of E2 are likely to originate from local synthesis (Schlinger and Arnold, 1992; Schlinger and Arnold, 1993). The enzyme responsible for the metabolism of testosterone into E2, aromatase or CYP19, is expressed in several nuclei of the hypothalamus and telencephalon. Not surprisingly, the highest levels of E2 were found in 2 regions expressing high levels of aromatase, NCM and hippocampus (Balthazart et al., 1996; Saldanha et al., 2000). Aromatase-immunoreactive cells are also present in MMAN, mPOA and VMN, where E2 was detectable in the majority of samples, albeit at a lower level. There is little aromatase activity in the LatNP, OL and CB, and very few samples from these regions had detectable E2. Interestingly, HVC and RA receive aromatase-immunoreactive fibers and could be expected to synthesize E2 locally (Peterson et al., 2005). However, most HVC and RA samples had non-detectable amounts of E2. Our measures are probably an underestimate of E2 concentrations at the subcellular level. Aromatase is present in pre-synaptic terminals in HVC and RA and could lead to high levels of E2 near the synapse. The high synaptic E2 concentration would however be diluted by the surrounding tissue in the punches. Perhaps E2 levels in HVC and RA might be higher in subjects that were known to be singing.
Brain E2 could result from local de novo synthesis from cholesterol. All the enzymes in the neurosteroidogenesis pathway are expressed in the songbird telencephalon (London et al., 2006), and brain slices from developing zebra finches secrete E2 in vitro (Holloway and Clayton, 2001). However, note that brain E2 was almost completely non-detectable in two subjects with low levels of circulating T, suggesting that the brain E2 results mainly from the aromatization of circulating T rather than from complete de novo synthesis. The absence of strong correlations between circulating T and brain E2 levels might be related to individual variation of aromatase activity. In regions lacking aromatase, such as Area X, some E2 might be present because of passive diffusion away from sites of synthesis or because of sequestration (specific or non-specific). The peripheral or neural origin of the substrate needed for localized E2 synthesis remains to be investigated in the distinct brain regions.
Linking local aromatase activity and E2 concentrations
Local concentrations of brain E2 are unlikely to be static but could vary according to the behavior and environment. The transcription of aromatase in several brain regions is strongly regulated by season and steroids (Balthazart et al., 1990; Soma et al., 2003; Silverin et al., 2004). These long-term changes in aromatase expression and activity very likely lead to changes in E2 concentrations. In addition, rapid modulation in aromatase activity is also described in specific brain regions after performance of male sexual behavior in quail (Cornil et al., 2005) or singing behavior in zebra finches (Remage-Healey et al., 2009). Remage-Healey and colleagues (Remage-Healey et al., 2008) elegantly used in vivo microdialysis to measure E2 concentrations in the zebra finch NCM. This exciting approach allows repeated measurement of E2 from the same animal. However, the low recovery of steroid across the dialysis membrane requires sampling to last for 30 min, making potential rapid modulations of E2 concentrations difficult to observe.
The methods described here offer several useful features. First, our procedure allows measurement of E2 in plasma and brain. This permits direct comparison of circulating and local E2 levels. Second, our method allows measurement of very rapid changes in brain E2 levels (e.g., within 5 min). Third, our procedure permits the examination of multiple brain regions. Given the spatial specificity of brain aromatase expression and also the region-specific regulation of aromatase, this is an important point. Fourth, our method avoids the effects of injury-induced aromatase. Insertion of the guide cannula for the microdialysis probe induces aromatase around the site of injury, and therefore potentially increases E2 concentrations at the site of dialysis (Garcia-Segura et al., 1999; Peterson et al., 2001; Peterson et al., 2004; Wynne and Saldanha, 2004; Wynne et al., 2008). Thus, we view the present technique and in vivo microdialysis as complementary approaches to understanding local E2 levels in the brain and their regulation and function.
CONCLUSIONS
The present technique offers a method to investigate the concentrations of E2 in small brain samples. The E2 assay is precise, sensitive, specific and accurate. While many studies have measured aromatase activity in brain, far fewer studies have measured E2 levels in brain. The present procedure will allow experiments aimed at determining whether E2 can act rapidly under specific conditions. For example, it is possible that E2 remains elevated for a substantial amount of time when acting at the genomic level, while a more rapid change of E2 may be required when E2 acts at the non-genomic level (Balthazart and Ball, 2006; Cornil et al., 2006). This present procedure will allow one to determine if E2 is rapidly produced in specific region(s) and also whether E2 can be rapidly eliminated from these areas.
Acknowledgments
We would like to thank Matt Taves for technical assistance and Dr. Joanne Weinberg for sharing equipment. We also would like to thank Pr. Jacques Balthazart for helpful discussion on the validation of RIA and statistics. This research was supported by grants from the Canadian Institutes of Health Research (CIHR), Canada Foundation for Innovation, and the Michael Smith Foundation for Health Research (MSFHR) to KKS, and from NIH (R01NS042767) to CJS and KKS. TDC was an IBRO and CIHR postdoctoral fellow and is currently a FNRS postdoctoral researcher. AEMN was a NSERC and MSFHR fellow, and KWLP was a NSERC USRA fellow.
Footnotes
Publisher's Disclaimer: This is a PDF file of an unedited manuscript that has been accepted for publication. As a service to our customers we are providing this early version of the manuscript. The manuscript will undergo copyediting, typesetting, and review of the resulting proof before it is published in its final citable form. Please note that during the production process errors may be discovered which could affect the content, and all legal disclaimers that apply to the journal pertain.
References
- Abraham GE. Reliability criteria for steroid radioimmunoassay. Pathol Biol (Paris) 1975;23:885–888. [PubMed] [Google Scholar]
- Amateau SK, Alt JJ, Stamps CL, McCarthy MM. Brain estradiol content in newborn rats: sex differences, regional heterogeneity, and possible de novo synthesis by the female telencephalon. Endocrinology. 2004;145:2906–2917. doi: 10.1210/en.2003-1363. [DOI] [PubMed] [Google Scholar]
- Balthazart J, Foidart A. Brain aromatase and the control of male sexual behavior. J Steroid Biochem Mol Biol. 1993;44:521–540. doi: 10.1016/0960-0760(93)90256-v. [DOI] [PubMed] [Google Scholar]
- Balthazart J, Ball GF. Is brain estradiol a hormone or a neurotransmitter? Trends Neurosci. 2006;29:241–249. doi: 10.1016/j.tins.2006.03.004. [DOI] [PubMed] [Google Scholar]
- Balthazart J, Foidart A, Hendrick JC. The induction by testosterone of aromatase activity in the preoptic area and activation of copulatory behavior. Physiol Behav. 1990;47:83–94. doi: 10.1016/0031-9384(90)90045-6. [DOI] [PubMed] [Google Scholar]
- Balthazart J, Absil P, Foidart A, Houbart M, Harada N, Ball GF. Distribution of aromatase-immunoreactive cells in the forebrain of zebra finches (Taeniopygia guttata): implications for the neural action of steroids and nuclear definition in the avian hypothalamus. J Neurobiol. 1996;31:129–148. doi: 10.1002/(SICI)1097-4695(199610)31:2<129::AID-NEU1>3.0.CO;2-D. [DOI] [PubMed] [Google Scholar]
- Barker JM, Galea LA. Sex and regional differences in estradiol content in the prefrontal cortex, amygdala and hippocampus of adult male and female rats. Gen Comp Endocrinol. 2009;164:77–84. doi: 10.1016/j.ygcen.2009.05.008. [DOI] [PubMed] [Google Scholar]
- Belanger A, Couture J, Caron S, Roy R. Determination of nonconjugated and conjugated steroid levels in plasma and prostate after separation on C-18 columns. Ann N Y Acad Sci. 1990;595:251–259. doi: 10.1111/j.1749-6632.1990.tb34299.x. [DOI] [PubMed] [Google Scholar]
- Bixo M, Backstrom T, Winblad B, Andersson A. Estradiol and testosterone in specific regions of the human female brain in different endocrine states. J Steroid Biochem Mol Biol. 1995;55:297–303. doi: 10.1016/0960-0760(95)00179-4. [DOI] [PubMed] [Google Scholar]
- Bixo M, Backstrom T, Winblad B, Selstam G, Andersson A. Comparison between pre- and postovulatory distributions of oestradiol and progesterone in the brain of the PMSG-treated rat. Acta Physiol Scand. 1986;128:241–246. doi: 10.1111/j.1748-1716.1986.tb07972.x. [DOI] [PubMed] [Google Scholar]
- Caruso D, Scurati S, Maschi O, De Angelis L, Roglio I, Giatti S, Garcia-Segura LM, Melcangi RC. Evaluation of neuroactive steroid levels by liquid chromatography-tandem mass spectrometry in central and peripheral nervous system: effect of diabetes. Neurochem Int. 2008;52:560–568. doi: 10.1016/j.neuint.2007.06.004. [DOI] [PubMed] [Google Scholar]
- Charlier TD, Underhill C, Hammond GL, Soma KK. Effects of aggressive encounters on plasma corticosteroid-binding globulin and its ligands in white-crowned sparrows. Horm Behav. 2009;56:339–347. doi: 10.1016/j.yhbeh.2009.06.012. [DOI] [PubMed] [Google Scholar]
- Cornil CA, Ball GF, Balthazart J. Functional significance of the rapid regulation of brain estrogen action: Where do the estrogens come from? Brain Res. 2006;1126:2–26. doi: 10.1016/j.brainres.2006.07.098. [DOI] [PMC free article] [PubMed] [Google Scholar]
- Cornil CA, Evrard HC, Ball GF, Balthazart J. Rapid effects of 17β-estradiol and vorozole, an aromatase inhibitor, on male sexual behavior in japanese quail. Abstract of Society For Neuroscience. 2003;29:725–726. [Google Scholar]
- Cornil CA, Dalla C, Papadopoulou-Daifoti Z, Baillien M, Dejace C, Ball GF, Balthazart J. Rapid decreases in preoptic aromatase activity and brain monoamine concentrations after engaging in male sexual behavior. Endocrinology. 2005;146:3809–3820. doi: 10.1210/en.2005-0441. [DOI] [PMC free article] [PubMed] [Google Scholar]
- Garcia-Segura LM. Aromatase in the brain: not just for reproduction anymore. J Neuroendocrinol. 2008;20:705–712. doi: 10.1111/j.1365-2826.2008.01713.x. [DOI] [PubMed] [Google Scholar]
- Garcia-Segura LM, Wozniak A, Azcoitia I, Rodriguez JR, Hutchison RE, Hutchison JB. Aromatase expression by astrocytes after brain injury: implications for local estrogen formation in brain repair. Neuroscience. 1999;89:567–578. doi: 10.1016/s0306-4522(98)00340-6. [DOI] [PubMed] [Google Scholar]
- Granger DA, Schwartz EB, Booth A, Arentz M. Salivary testosterone determination in studies of child health and development. Horm Behav. 1999;35:18–27. doi: 10.1006/hbeh.1998.1492. [DOI] [PubMed] [Google Scholar]
- Hojo Y, Higo S, Ishii H, Ooishi Y, Mukai H, Murakami G, Kominami T, Kimoto T, Honma S, Poirier D, Kawato S. Comparison between Hippocampus-Synthesized and Circulation-derived Sex Steroids in the Hippocampus. Endocrinology. 2009;150:5106–5112. doi: 10.1210/en.2009-0305. [DOI] [PubMed] [Google Scholar]
- Holloway CC, Clayton DE. Estrogen synthesis in the male brain triggers development of the avian song control pathway in vitro. Nat Neurosci. 2001;4:170–175. doi: 10.1038/84001. [DOI] [PubMed] [Google Scholar]
- Jawad MJ, Wilson EA, Rayburn WF. Effect of serum lipids on radioimmunoassays of unconjugated estriol in serum. Clin Chem. 1981;27:280–285. [PubMed] [Google Scholar]
- Kelly MJ, Ronnekleiv OK. Membrane-initiated estrogen signaling in hypothalamic neurons. Mol Cell Endocrinol. 2008;290:14–23. doi: 10.1016/j.mce.2008.04.014. [DOI] [PMC free article] [PubMed] [Google Scholar]
- Labombarda F, Pianos A, Liere P, Eychenne B, Gonzalez S, Cambourg A, De Nicola AF, Schumacher M, Guennoun R. Injury Elicited Increase in Spinal Cord Neurosteroid Content Analyzed by Gas Chromatography Mass Spectrometry. Endocrinology. 2006;147:1847–1859. doi: 10.1210/en.2005-0955. [DOI] [PubMed] [Google Scholar]
- London SE, Monks DA, Wade J, Schlinger BA. Widespread capacity for steroid synthesis in the avian brain and song system. Endocrinology. 2006;147:5975–5987. doi: 10.1210/en.2006-0154. [DOI] [PMC free article] [PubMed] [Google Scholar]
- Mangelsdorf DJ, Thummel C, Beato M, Herrlich P, Schütz G, Umesono K, Blumberg B, Kastner P, Mark M, Chambon P, Evans RM. The nuclear receptor superfamily: the second decade. Cell. 1995;83:835–839. doi: 10.1016/0092-8674(95)90199-x. [DOI] [PMC free article] [PubMed] [Google Scholar]
- Micevych PE, Mermelstein PG. Membrane estrogen receptors acting through metabotropic glutamate receptors: an emerging mechanism of estrogen action in the brain. Mol Neurobiol. 2008;38:66–77. doi: 10.1007/s12035-008-8034-z. [DOI] [PMC free article] [PubMed] [Google Scholar]
- Midgley AR, Jr, Niswender GD, Rebar RW. Principles for the assessment of the reliability of radioimmunoassay methods (precision, accuracy, sensitivity, specificity) Acta Endocrinol Suppl (Copenh) 1969;142:163–184. doi: 10.1530/acta.0.062s163. [DOI] [PubMed] [Google Scholar]
- Naftolin F, Ryan KJ, Davies IJ, Petro Z, Kuhn M. The formation and metabolism of estrogens in brain tissue. Adv Biosci. 1975;15:105–121. [PubMed] [Google Scholar]
- Newman AE, Chin EH, Schmidt KL, Bond L, Wynne-Edwards KE, Soma KK. Analysis of steroids in songbird plasma and brain by coupling solid phase extraction to radioimmunoassay. Gen Comp Endocrinol. 2008;155:503–510. doi: 10.1016/j.ygcen.2007.08.007. [DOI] [PubMed] [Google Scholar]
- Nixdorf-bergweiler BE, Bischof H-J. Taeniopygia guttata with special emphasis on telencephalic visual and song system nuclei in transverse and sagital sections. National Library of Medecine, NCBI; Bethesda (MD): 2007. Stereotaxic atlas of the brain of the zebra finch. [Google Scholar]
- Oberlander JG, Schlinger BA, Clayton NS, Saldanha CJ. Neural aromatization accelerates the acquisition of spatial memory via an influence on the songbird hippocampus. Horm Behav. 2004;45:250–258. doi: 10.1016/j.yhbeh.2003.12.003. [DOI] [PubMed] [Google Scholar]
- Palkovits M. Isolated removal of hypothalamic or other brain nuclei of the rat. Brain Res. 1973;59:449–450. doi: 10.1016/0006-8993(73)90290-4. [DOI] [PubMed] [Google Scholar]
- Pei M, Matsuda K, Sakamoto H, Kawata M. Intrauterine proximity to male fetuses affects the morphology of the sexually dimorphic nucleus of the preoptic area in the adult rat brain. Eur J Neurosci. 2006;23:1234–1240. doi: 10.1111/j.1460-9568.2006.04661.x. [DOI] [PubMed] [Google Scholar]
- Peterson RS, Saldanha CJ, Schlinger BA. Rapid upregulation of aromatase mRNA and protein following neural injury in the zebra finch (Taeniopygia guttata) J Neuroendocrinol. 2001;13:317–323. doi: 10.1046/j.1365-2826.2001.00647.x. [DOI] [PubMed] [Google Scholar]
- Peterson RS, Lee DW, Fernando G, Schlinger BA. Radial glia express aromatase in the injured zebra finch brain. J Comp Neurol. 2004;475:261–269. doi: 10.1002/cne.20157. [DOI] [PubMed] [Google Scholar]
- Peterson RS, Yarram L, Schlinger BA, Saldanha CJ. Aromatase is presynaptic and sexually dimorphic in the adult zebra finch brain. Proc Biol Sci. 2005;272:2089–2096. doi: 10.1098/rspb.2005.3181. [DOI] [PMC free article] [PubMed] [Google Scholar]
- Rash JM, Jerkunica I, Sgoutas DS. Lipid interference in steroid radioimmunoassay. Clin Chem. 1980;26:84–88. [PubMed] [Google Scholar]
- Remage-Healey L, Bass AH. Rapid, hierarchical modulation of vocal patterning by steroid hormones. J Neurosci. 2004;24:5892–5900. doi: 10.1523/JNEUROSCI.1220-04.2004. [DOI] [PMC free article] [PubMed] [Google Scholar]
- Remage-Healey L, Maidment NT, Schlinger BA. Forebrain steroid levels fluctuate rapidly during social interactions. Nat Neurosci. 2008;11:1327–1334. doi: 10.1038/nn.2200. [DOI] [PMC free article] [PubMed] [Google Scholar]
- Remage-Healey L, Oyama RK, Schlinger BA. Elevated aromatase activity in forebrain synaptic terminals during song. J Neuroendocrinol. 2009;21:191–199. doi: 10.1111/j.1365-2826.2009.01820.x. [DOI] [PMC free article] [PubMed] [Google Scholar]
- Roselli CE, Horton LE, Resko JA. Distribution and regulation of aromatase activity in the rat hypothalamus and limbic system. Endocrinology. 1985;117:2471–2477. doi: 10.1210/endo-117-6-2471. [DOI] [PubMed] [Google Scholar]
- Roselli CE, Liu M, Hurn PD. Brain Aromatization: classic roles and new perspectives. Sem Reprod Med. 2009;27:207–217. doi: 10.1055/s-0029-1216274. [DOI] [PMC free article] [PubMed] [Google Scholar]
- Saldanha CJ, Tuerk MJ, Kim YH, Fernandes AO, Arnold AP, Schlinger BA. Distribution and regulation of telencephalic aromatase expression in the zebra finch revealed with a specific antibody. J Comp Neurol. 2000;423:619–630. doi: 10.1002/1096-9861(20000807)423:4<619::aid-cne7>3.0.co;2-u. [DOI] [PubMed] [Google Scholar]
- Schlinger BA, Callard GV. Aggressive behavior in birds: An experimental model for studies of brain-steroid interactions. Comp Biochem Physiol A. 1990;97A:307–316. doi: 10.1016/0300-9629(90)90616-z. [DOI] [PubMed] [Google Scholar]
- Schlinger BA, Arnold AP. Circulating estrogens in a male songbird originate in the brain. Proc Natl Acad Sci USA. 1992;89:7650–7653. doi: 10.1073/pnas.89.16.7650. [DOI] [PMC free article] [PubMed] [Google Scholar]
- Schlinger BA, Arnold AP. Estrogen synthesis in vivo in the adult zebra finch: Additional evidence that circulating estrogens can originate in brain. Endocrinology. 1993;133:2610–2616. doi: 10.1210/endo.133.6.8243284. [DOI] [PubMed] [Google Scholar]
- Schmidt KL, Pradhan DS, Shah AH, Charlier TD, Chin EH, Soma KK. Neurosteroids, immunosteroids, and the Balkanization of endocrinology. Gen Comp Endocrinol. 2008;157:266–274. doi: 10.1016/j.ygcen.2008.03.025. [DOI] [PubMed] [Google Scholar]
- Schmidt KL, Soma KK. Cortisol and corticosterone in the songbird immune and nervous systems: local vs. systemic levels during development. Am J Physiol-Regul Int Comp Physiol. 2008;295:R103–R110. doi: 10.1152/ajpregu.00002.2008. [DOI] [PubMed] [Google Scholar]
- Schumacher M, Balthazart J. Testosterone-induced brain aromatase is sexually dimorphic. Brain Res. 1986;370:285–293. doi: 10.1016/0006-8993(86)90483-x. [DOI] [PubMed] [Google Scholar]
- Schumacher M, Balthazart J. Neuroanatomical distribution of testosterone-metabolizing enzymes in the Japanese quail. Brain Res. 1987;422:137–148. doi: 10.1016/0006-8993(87)90548-8. [DOI] [PubMed] [Google Scholar]
- Schumacher M, Contenti E, Balthazart J. Testosterone metabolism in discrete areas of the hypothalamus and adjacent brain regions of male and female Japanese quail. Brain Res. 1983;278:337–340. doi: 10.1016/0006-8993(83)90267-6. [DOI] [PubMed] [Google Scholar]
- Selmanoff MK, Brodkin LD, Weiner RI, Siiteri PK. Aromatization and 5β-reduction of androgens in discrete hypothalamic and limbic regions of the male and female rat. Endocrinology. 1977;101:841–848. doi: 10.1210/endo-101-3-841. [DOI] [PubMed] [Google Scholar]
- Shen P, Schlinger BA, Campagnoni AT, Arnold AP. An atlas of aromatase mRNA expression in the zebra finch brain. J Comp Neurol. 1995;360:172–184. doi: 10.1002/cne.903600113. [DOI] [PubMed] [Google Scholar]
- Shimada K, Mitamura K, Shiroyama M, Yago K. Studies on neurosteroids. IX Characterization of estrogens in rat brains using gas chromatography-tandem mass spectrometry. J Chromatogr A. 1999;847:171–178. doi: 10.1016/s0021-9673(98)01083-8. [DOI] [PubMed] [Google Scholar]
- Shirtcliff EA, Granger DA, Schwartz EB, Curran MJ, Booth A, Overman WH. Assessing estradiol in biobehavioral studies using saliva and blood spots: simple radioimmunoassay protocols, reliability, and comparative validity. Horm Behav. 2000;38:137–147. doi: 10.1006/hbeh.2000.1614. [DOI] [PubMed] [Google Scholar]
- Silverin B, Baillien M, Balthazart J. Territorial aggression, circulating levels of testosterone, and brain aromatase activity in free-living pied flycatchers. Horm Behav. 2004;45:225–234. doi: 10.1016/j.yhbeh.2003.10.002. [DOI] [PubMed] [Google Scholar]
- Silverin B, Baillien M, Foidart A, Balthazart J. Distribution of aromatase activity in the brain and peripheral tissues of passerine and nonpasserine avian species. Gen Comp Endocrinol. 2000;117:34–53. doi: 10.1006/gcen.1999.7383. [DOI] [PubMed] [Google Scholar]
- Sinclair JD. Multiple T-Tests Are Appropriate in Science. Trends Pharm Sci. 1988;9:12–13. doi: 10.1016/0165-6147(88)90234-9. [DOI] [PubMed] [Google Scholar]
- Soma KK, Schlinger BA, Wingfield JC, Saldanha CJ. Brain aromatase, 5β-reductase and 5β-reductase change seasonally in wild male song sparrows: relationship to aggressive and sexual behavior. J Neurobiol. 2003;56:209–221. doi: 10.1002/neu.10225. [DOI] [PubMed] [Google Scholar]
- Soma KK, Scotti MA, Newman AE, Charlier TD, Demas GE. Novel mechanisms for neuroendocrine regulation of aggression. Front Neuroendocrinol. 2008;29:476–489. doi: 10.1016/j.yfrne.2007.12.003. [DOI] [PubMed] [Google Scholar]
- Trainor BC, Finy MS, Nelson RJ. Rapid effects of estradiol on male aggression depend on photoperiod in reproductively non-responsive mice. Horm Behav. 2008;53:192–199. doi: 10.1016/j.yhbeh.2007.09.016. [DOI] [PMC free article] [PubMed] [Google Scholar]
- Vockel A, Prove E, Balthazart J. Sex- and age-related differences in the activity of testosterone-metabolizing enzymes in microdissected nuclei of the zebra finch brain. Brain Res. 1990;511:291–302. doi: 10.1016/0006-8993(90)90174-a. [DOI] [PubMed] [Google Scholar]
- Wade J, Schlinger BA, Hodges L, Arnold AP. Fadrozole: a potent inhibitor of aromatase in the zebra finch brain. Gen Comp Endocrinol. 1994;94:53–61. doi: 10.1006/gcen.1994.1059. [DOI] [PubMed] [Google Scholar]
- Wynne RD, Saldanha CJ. Glial aromatization decreases neural injury in the zebra finch (Taeniopygia guttata): influence on apoptosis. J Neuroendocrinol. 2004;16:676–683. doi: 10.1111/j.1365-2826.2004.01217.x. [DOI] [PubMed] [Google Scholar]
- Wynne RD, Maas S, Saldanha CJ. Molecular characterization of the injury-induced aromatase transcript in the adult zebra finch brain. J Neurochem. 2008;105:1613–1624. doi: 10.1111/j.1471-4159.2008.05256.x. [DOI] [PubMed] [Google Scholar]