A PMMA model study showed that spherical aberration induction in laser refractive surgery is due to loss of ablation efficiency in the corneal periphery. Aspheric ablation induced less spherical aberration and provided better theoretical image quality.
Abstract
Purpose.
To compare the effects of laser profile asphericity on the induction of wavefront aberrations, susceptibility to decentration, and depth of focus in a polymethylmethacrylate (PMMA) model.
Methods.
Four PMMA lenses received an excimer laser ablation of −6 D with a 6-mm optical zone and different amounts of primary spherical aberration (Z40): 0, −0.346, −1.038, and −2.076 μm. The curvature of each lens was measured by using surface profilometry, and wavefront changes were computed from curvature differences. Changes in optical quality were compared by treatment simulation of 13 real myopic eyes. The influence of pupil diameter, ablation decentration, and defocus on retinal image quality was measured by using the optical transfer function–based visual Strehl ratio (VSOTF).
Results.
Aspheric ablation profiles induced significantly less primary but higher secondary spherical aberration (Z60) than did the standard profile; however, Z40 compensation was incomplete. Simulated treatments with aspheric profiles resulted in significantly better retinal image quality and higher decentration tolerance than did the standard profile. Optical depth of focus was not affected with a 3-mm pupil, whereas with a 6-mm pupil, there was a small but statistically significant decrease in depth of focus.
Conclusions.
Aspheric laser profiles showed theoretical optical benefits over standard ablation profiles for the treatment of myopia, including terms of decentration tolerance. However, there remained profound induction and thus, undercorrection of Z40, due to loss of laser ablation efficiency in the lens periphery.
The fact that corneal refractive excimer surgery for the correction of lower order optical aberrations can induce higher order aberrations (HOAs), especially spherical aberration (SA) and coma, is well accepted.1–4 Both spherical and comalike aberrations can significantly decrease optical quality. The induction of SA could be explained by a change in the cornea from a prolate to a more oblate shape.5 This shape change has been attributed to biomechanical effects after cutting of the stromal lamellae6,7 and to a decrease in laser efficacy at the corneal periphery,8 although a recent PMMA study favored the latter hypothesis.9 The induction of SA was found to correlate with higher attempted spherical equivalent and a small fractional clearance (ratio of the diameter of the optical zone to the pupil diameter).3,10,11 Coma induction was also linked to a small fractional clearance, which could be explained by the fact that a decentered SA translates into coma.12 Therefore, the induction of SA plays a pivotal role for the change in the wavefront error (WFE) after corneal refractive excimer surgery.
Aspheric ablation profiles (AAPs), also called wavefront-optimized profiles, have been designed to minimize the inherent induction of SA either by precompensating for SA induction or by attempting to maintain the original corneal asphericity.13–15 Thus, the benefits of AAP should be a higher optical quality for larger pupils and a higher tolerance of decentration of the optical zone because of lower coma induction. On the other hand, SA can enhance the depth of focus,16 suggesting a lower depth of focus for treatments with AAP.
The present study was designed to characterize optical properties of AAP and to test the hypothesis that compared with standard spherical treatments (1) treatments with AAP yield a better optical quality due to lower induction of SA, (2) AAPs are less susceptible to decentration, and (3) treatments with AAPs lead to a lower depth of focus. Treatments with different amounts of asphericity were simulated in a (poly-)methyl methacrylate (PMMA) model, to ensure treatments effects free of biological responses (i.e., biomechanical and wound healing effects). For the determination of retinal image quality, treatment effects were simulated by convolving the WFE change measured on PMMA with that obtained from a set of real, native human myopic eyes. This method produced a more realistic estimate of change in retinal image quality because of interaction with pre-existing aberrations.
Materials and Methods
Excimer Ablation on PMMA Lenses
We ablated four biconvex PMMA lenses whose two facets possessed a radius of curvature of 8.95 mm. The ablations were performed in the center of each PMMA lens with an excimer laser (Technolas 217; Bausch & Lomb, Inc., Rochester, NY). Four ablation profiles with a treatment of −6 D, an optical zone of 6 mm and a total treatment zone of 9.1 mm were used: a standard spherical profile (Planoscan 4.1; Bausch & Lomb, Inc.) and three experimental aspheric profiles based on the standard profile containing defined amounts of negative primary SA (Z40) to precompensate for the induction of Z40. Based on previous studies from our laboratory,17 an induction of 0.346 μm Z40 was expected over a pupil diameter of 6 mm for a −6-D treatment with an optical zone of 6 mm. The aspheric profiles contained the one-, three- and sixfold negative amount of expected Z40 (Table 1).
Table 1.
Profile Characteristics
| Profile | Amount of Z40 (μm) | Treatment (D) | OZ (mm) | TTZ (mm) | Max AD (μm) | Pulses (n) |
|---|---|---|---|---|---|---|
| 0n | 0 | −6 | 6 | 9.1 | 103 | 2140 |
| 1n | −0.346 | −6 | 6 | 9.1 | 93 | 1901 |
| 3n | −1.038 | −6 | 6 | 9.1 | 93 | 2039 |
| 6n | −2.076 | −6 | 6 | 9.1 | 95 | 2254 |
OZ, programmed optical zone; TTZ, total treatment zone; max AD, maximum ablation depth.
Measurement of Treatment Effects on PMMA
The postablation radius of curvature was measured with a surface profiler (TalySurf PGI; Taylor Hobson, Leicester, UK) along two perpendicular meridians at a resolution of 0.25 μm. From raw data, the ablation-induced change in the radius of curvature was calculated in a custom program (MATLAB, ver. 7.0; The MathWorks, Natick, MA). Briefly, the difference between the measured height and a reference sphere with a radius of curvature of 8.95 mm was calculated for the two meridians, and tilt was removed by using a linear detrending function. The raw height difference (ablation depth) was multiplied with a correction factor obtained by dividing the intended central ablation depth on PMMA by the measured central ablation depth on PMMA. Height data of each meridian were then averaged and converted into a WFE difference by using a least-squares fit of the Zernike polynomials Z20, Z40, and Z60 to the height difference data. The pupil diameter for the Zernike fit was 9 mm, and an air/cornea refractive index difference of 0.376 was assumed.
Simulation of Treatment in Myopic Eyes
To investigate the optical characteristics of ablation profiles with different asphericity, we simulated treatments by adding the WFE difference obtained from PMMA to the preoperative WFE of human myopic eyes. From our database, preoperative WFEs of 13 patients (mean age 32.6 ± 10.8 years; 8 women, 5 men) with an average second-order–derived spherical equivalent of −6.10 ± 0.20 D (range, −5.68 to −6.35) were included. The mean second-order sphere was −5.97 ± 0.21 D (−5.44 to −6.22), and the mean second-order cylinder magnitude was −0.28 ± 0.14 D (−0.04 to −0.47).
Wavefront Analysis and Retinal Image Quality
All preoperative and simulated postoperative errors were described by using a Zernike decomposition from the second to sixth order, according to the Visual Science and its Application (VSIA) standards.18 Second-order aberration Zernike coefficients (lower order aberrations [LOAs]) were converted into dioptric power vectors (M, J0, and J45), where M, is the spherical equivalent, J0 is the 0°/90° and J45 is the 45°/135° astigmatic component. HOAs were broken down into coma root mean square (the RMS value of all coma terms Cn±1), SA RMS (the RMS value of all coefficients Cn0), and the RMS of the residual, noncoma, nonspherical aberrations (the RMS value of all remaining HOAs Cn≥ ±2).
Theoretical retinal image quality was expressed as the visual Strehl ratio based on the optical transfer function (VSOTF).19 The VSOTF for the best-corrected state (BCVSOTF) was calculated with commercial software (Visual Optics Laboratory [VOL]-Pro 7.14; Sarver and Associates, Carbondale, IL). This metric is obtained by modification of LOA coefficients to maximize the VSOTF, simulating the process of subjective refraction. Thus, the BCVSOTF reflects the influence of HOA on optical quality. WFEs and BCVSOTF values were reconstructed for pupil diameters over a range from 2.5 to 8 mm in 0.1-mm steps.
Simulation of Decentration and Calculation of Decentration Tolerance
The simulation of decentration has been described in detail in a previous publication.12 Briefly, a custom algorithm (MATLAB; The MathWorks) was used to calculate decentered WFE differences from PMMA data for the size of a 6-mm subaperture along Cartesian decentrations Δx and Δy. Δx and Δy were changed in steps of 100 μm, covering the entire 9-mm area of the PMMA WFE difference. This method resulted in a maximum decentration range of 3000 μm (−1500 to 1500 μm) over a circular region. Zernike polynomials for the second to sixth order were fitted to the data of each decentered wavefront, resulting in 709 WFEs: 1 centered and 708 decentered per eye. All postoperative WFEs were calculated by adding the centered or decentered WFE difference to each of the preoperative human WFEs. WFEs and corresponding VSOTF metrics were calculated over pupil diameters from 3 to 6 mm (0.5-mm steps).
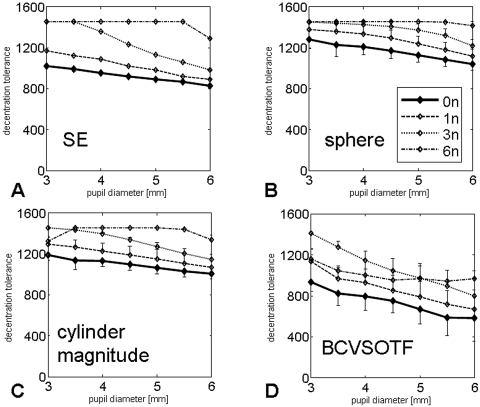
Analysis of decentration tolerance was performed by calculating the maximum permissible decentration that yielded a critical decrease of spherical equivalent, sphere and cylinder magnitude by 0.5 D, relative to the centered postoperative value. The same calculations were performed for BCVSOTF with the threshold defined as a decrease of 0.2 log units, which roughly equals a decrease of 2 logMAR steps.19 Vectors (r) between the centered position (x, y) and each outmost coordinate below the criterion (threshold coordinates x′, y′) were calculated. The mean value (r̄) reflects the average maximum permissible decentration in micrometers that allows one to remain below the threshold criterion and equals the radius of a circle around the centered position. Tolerance values (r̄) were calculated based on the entire set of 709 data points for pupil diameters between 3 and 6 mm at 0.5-mm steps.
Through-Focus Retinal Image Quality: Optical Depth of Focus
Through-focus retinal image quality curves were obtained by defocusing LOA-optimized postoperative WFEs over a range from −4 to 4 D in 0.25-D steps. For each defocused WFE, the VSOTF metric was calculated, resulting in a curve with maximum at the nondefocused WFE. Optical depth of focus was defined as the range of defocus that caused a decrease in the VSOTF of no more than 0.2 log units. Optical depth of focus was calculated for 3- and 6-mm pupil diameters.
Statistical Analysis
Differences in wave aberrations, VSOTF values, decentration tolerance, and optical depth of focus between the standard profile (0n) and the aspheric profiles were compared by paired, two-tailed Student's t-test. If data were not normally distributed according to the Kolmogorov-Smirnov-Lilliefors test, the Wilcoxon-Mann-Whitney U test was used instead. If multiple comparisons were made, P values were adjusted with the Bonferroni method (BiAS 8.2 software; Epsilon Verlag, Hochheim, Germany).
Results
Treatment Effects on PMMA and Simulation of Retinal Image Quality Change
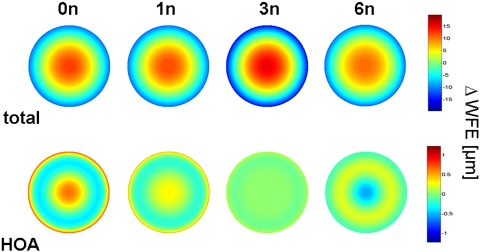
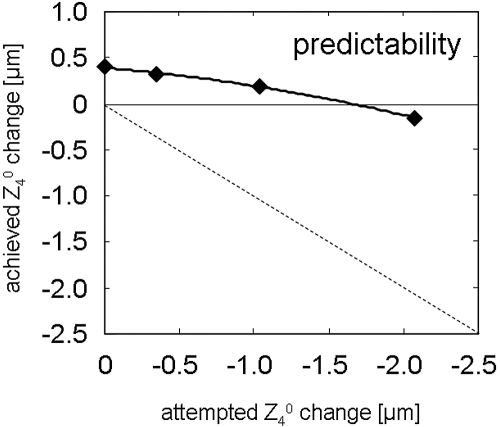
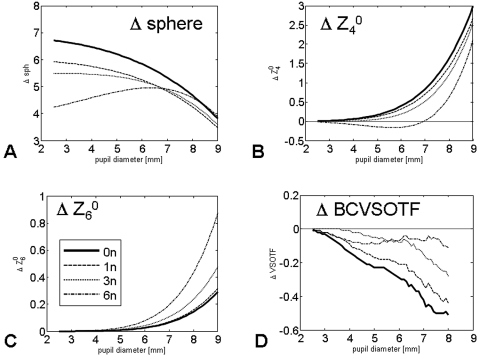
The treatment effects on PMMA are summarized in Table 2 and Figure 1. When adjusted for nominal ablation depth and the air/cornea refractive index difference, all treatments induced the expected hyperopic shift, with the shift's magnitude varying from 4.95 D (6n, 6-mm pupil) to 5.84 D (0n, 6-mm pupil). There was induction and profound undercorrection of positive primary SA (Z40) (Table 1, Fig. 2). When calculated over a 6-mm pupil diameter, the 0n profile (standard profile) induced 0.4 μm of Z40. Both the 1n and 3n profiles induced smaller but still significant amounts of positive Z40. Overcorrection (induction of negative SA) was observed only with the 6n profile. Numerical interpolation using a second-order polynomial fit (y = −0.0596x2 + 0.1376x + 0.3913, R2 = 0.98) to the data revealed that a precompensation factor of 4.79n (−1.656 μm of Z40) resulted in a treatment without induction of primary SA (Fig. 2). Figures 3A–C show the change in sphere and primary and secondary SA as a function of pupil diameter. Whereas the 0n, 1n, and 3n ablations had similar curve characteristics, with a steep increase at pupil diameters beyond 6 mm, the 6n profile showed induction of negative Z40 at pupil diameters <7 mm and a steep Z40 increase beyond 7.5-mm diameters (Fig. 3B). A higher precompensation factor resulted in higher induction of secondary SA (Z60; Table 2, Fig. 3C).
Table 2.
Principal Changes in Wavefront Aberrations for PMMA Ablations
| Profile | ΔM (D) |
ΔSA RMS (μm) |
ΔZ40 (μm) |
ΔZ60 (μm) |
||||
|---|---|---|---|---|---|---|---|---|
| 3 mm | 6 mm | 3 mm | 6 mm | 3 mm | 6 mm | 3 mm | 6 mm | |
| 0n | 6.65 | 5.84 | 0.018 | 0.401 | 0.018 | 0.400 | 0.000 | 0.026 |
| 1n | 5.88 | 5.26 | 0.012 | 0.323 | 0.012 | 0.321 | 0.000 | 0.028 |
| 3n | 5.49 | 5.20 | 0.001 | 0.197 | 0.000 | 0.193 | 0.001 | 0.042 |
| 6n | 4.35 | 4.95 | 0.031 | 0.171 | −0.031 | −0.153 | 0.001 | 0.077 |
M, spherical equivalent; SA RMS, root mean square value from Z40 (primary SA) and Z60 (secondary spherical aberration).
Figure 1.
WFE changes in the different profiles, displayed as WFE maps. 0n, 1n, 3n, and 6n denote the correction factor (multiples of the amount of expected Z40 induction).
Figure 2.
Predictability of Z40 correction on PMMA. The graph shows the attempted versus the achieved change of primary SA (Z40) on PMMA. Solid curve: second-order polynomial fit to the data; dashed line: ideal predictability.
Figure 3.
Difference of sphere (A), primary SA (Z40, B), secondary SA (Z60, C) and theoretical retinal image quality (BCVSOTF, D) as a function of pupil diameter. BCVSOTF: Visual Strehl ratio, based on the optical transfer function, calculated for the optimum LOA correction.
The present treatment simulation allowed us to calculate changes in retinal image quality, expressed as the visual Strehl ratio based on the optical transfer function for the best-corrected eye (BCVSOTF). With the 6-mm pupil diameter, there were statistically significant differences in VSOTF change between the standard treatment (0n) and treatment with an aspheric profile (Table 3, Fig. 3D). Treatment simulations with the 3n profile showed the least decrease of VSOTF throughout a large range of pupil diameters with a mean difference of 0.22 ± 0.06 log units (minimum, 0.14; maximum, 0.33 log units) compared with the standard profile over a 6-mm pupil diameter (Table 3).
Table 3.
Change in Retinal Image Quality for Different Aspheric Profiles, Calculated over 3- and 6-mm Pupil Diameter (PD)
| Profile | ΔLog BCVSOTF |
|
|---|---|---|
| 3-mm PD | 6-mm PD | |
| 0n | −0.03 ± 0.02 (−0.06 to −0.01) | −0.29 ± 0.07 (−0.36 to −0.14) |
| 1n | −0.02 ± 0.01 (−0.04 to 0) | −0.21 ± 0.07* (−0.29 to −0.04) |
| 3n | 0 ± 0† | −0.08 ± 0.05† (−0.14 to 0.03) |
| 6n | −0.02 ± 0.03 (−0.07 to 0.03) | −0.21 ± 0.02‡ (−0.35 to 0.20) |
All data are expressed as the mean ± SD (minima and maxima in parentheses).
P < 0.05,
P < 0.001,
P < 0.01; comparison against standard profile (Student's t-test or Wilcoxon-Mann-Whitney U test with Bonferroni correction).
Decentration Tolerance for Profiles with Differing Asphericities
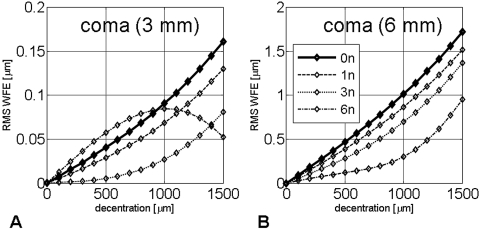
Horizontal decentration of all profiles resulted in induction of coma (Figs. 4A, 4B). In general, the higher the asphericity of the profile, the less coma induced. There was one exception: If measured over a 3-mm pupil diameter, the 6n profile induced larger amounts of coma when decentered up to 1000 μm (Fig. 4A). However, this pattern was reversed when coma induction was examined over a 6-mm pupil diameter (Fig. 4B).
Figure 4.
Coma induction as a function of horizontal decentration, calculated for a 3-mm (A) and a 6-mm (B) pupil. RMS WFE: root mean square value of all coma terms.
For all the other parameters examined (SE, sphere, cylinder magnitude, and BCVSOTF), decentration tolerance was significantly higher for aspheric profiles than for the standard profile (0n). Generally, decentration tolerance decreased at larger pupil diameters (Fig. 5, Table 4) and BCVSOTF showed the smallest decentration tolerance of all parameters tested (0n: 581 ± 124 μm, 6n: 967 ± 228 μm; P < 0.01).
Figure 5.
Decentration tolerance as a function of pupil diameter. (A) Spherical equivalent (SE); (B) sphere; (C) cylinder magnitude; and (D) visual Strehl ratio, based on the optical transfer function, calculated for the optimal LOA correction (BCVSOTF).
Table 4.
Decentration Tolerance (Maximum Permissible Decentration to Maintain a Threshold Value) Calculated over Pupil Diameters of 3 and 6 mm
| Profile | Spherical Equivalent (Threshold −0.5 D) |
Sphere (Threshold −0.5 D) |
Cylinder Magnitude (Threshold −0.5 D) |
BCVSOTF (Threshold −0.2 log units) |
||||
|---|---|---|---|---|---|---|---|---|
| 3 mm | 6 mm | 3 mm | 6 mm | 3 mm | 6 mm | 3 mm | 6 mm | |
| 0n | 1020 ± 0 | 829 ± 0 (821–830) | 1281 ± 90 (1183–1405) | 1043 ± 66 (969–1161) | 1193 ± 65 (1071–1293) | 1007 ± 89 (853–1122) | 936 ± 88 (814–1070) | 581 ± 124 (266–941) |
| 1n | 1171 ± 0‡ | 894 ± 0* (894–895) | 1378 ± 70 (1300–1455) | 1121 ± 67 (1056–1247) | 1298 ± 62† (1208 to 1367) | 1073 ± 90 (914 to 1190) | 869 ± 62* (1017–1454) | 668 ± 189 (414–1009) |
| 3n | 1455 ± 0* | 985 ± 0* | 1451 ± 4* (1444 to 1455) | 1222 ± 74* (1147–1353) | 1455 ± 0* | 1146 ± 86‡ (994 to 1246) | 1416 ± 15* (1387–1439) | 799 ± 174 (495–1147) |
| 6n | 1455 ± 0* | 1294 ± 0* | 1455 ± 0* | 1421 ± 35* (1347–1455) | 1329 ± 44* (1251–1372) | 1340 ± 45* (1247–1384) | 1161 ± 122* (975–1455) | 967 ± 228‡ (588–1323) |
All data are expressed as mean micrometers ± SD (minima and maxima in parentheses).
P < 0.001, †P < 0.05, ‡P < 0.01; comparison against standard profile (Student's t-test or Wilcoxon-Mann-Whitney U test with Bonferroni correction).
Through Focus Retinal Image Quality: Optical Depth of Focus
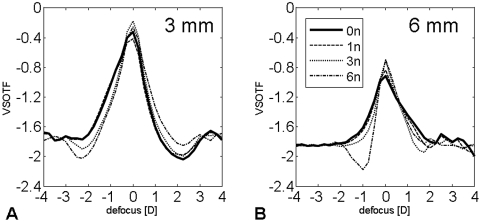
Except for the 6n profile, defocus curves had a similar appearance without multifocality (Figs. 6A, 6B). At a 3-mm pupil diameter, depth of focus of all profiles was comparable. Over a 6-mm pupil diameter, the 3n and 6n aspheric profiles had a significantly lower depth of focus (Table 5), with the greatest difference occurring between 0n and 3n (mean difference 0.24 ± 0.07 D, minimum 0.17 D, maximum 0.42 D).
Figure 6.
Defocus curves computed for a (A) 3- and (B) 6-mm pupil diameter. VSOTF: visual Strehl ratio, based on the optical transfer function.
Table 5.
Simulated Postoperative Optical Depth of Focus Calculated over the Two Pupil Diameters
| Profile | 3-mm PD | 6-mm PD |
|---|---|---|
| 0n | 0.52 ± 0.04 (0.47–0.59) | 0.67 ± 0.14 (0.31–0.99) |
| 1n | 0.50 ± 0.04 (0.46–0.56) | 0.58 ± 0.13 (0.44–0.86) |
| 3n | 0.49 ± 0.03 (0.45–0.54) | 0.43 ± 0.11† (0.24–0.74) |
| 6n | 0.51 ± 0.02 (0.48–0.56) | 0.52 ± 0.23‡ (0.32–1.11) |
All data are expressed as the mean ± SD (minima and maxima in parentheses).
P < 0.01,
P < 0.001; comparison against standard profile (Student's t-test or Wilcoxon Mann-Whitney U test with Bonferroni correction).
Discussion
In the present study, we examined the optical properties of aspheric excimer laser profiles for the treatment of myopia. The PMMA model ensured an investigation of treatment effects free of noise introduced by microdecentrations20,21 and biological effects, such as biomechanics and wound-healing reactions.22–24 The simulation experiment allowed direct comparison of retinal image quality of the different profiles in the same subjects. Three major findings emerged from the study: (1) in a PMMA model, the myopic ablation induced positive primary SA, overriding the SA correction of aspheric profiles and consecutively causing undercorrection of SA; (2) a perfectly centered ablation with an aspheric profile has optical benefits over treatment with a standard profile without significant compromise of depth of focus; (3) aspheric ablation profiles were less susceptible to decentration-induced image quality deterioration.
Induction of Spherical Aberration
In the past, the induction of positive SA in myopic laser refractive surgery has been attributed primarily to biomechanical effects6,7,23,25 and secondarily to the variability of laser energy across the cornea.8 This popular biomechanics hypothesis has been questioned recently in a study that applied a PMMA model.9 A well-centered myopic ablation for −6 D with a 6-mm optical zone and a standard profile induced an amount of positive primary SA on PMMA comparable to that observed after LASIK in human eyes.3,11 The results of the present study and comparison of SA induction on PMMA and feline eyes using our cat PRK model (Bühren J, et al. IOVS 2008 49:ARVO E-Abstract 2922) strongly suggest that the main source of SAs in laser refractive surgery are of physical (i.e., laser fluence loss toward the corneal periphery) rather than biological (i.e., biomechanical effects and wound healing) origins. This hypothesis is supported by the present finding that the correction of SA with an aspheric profile is insufficient if the expected amount obtained from a standard correction is used (1n approach). Interpolation showed that a 4.79n-fold amount of the expected Z40 induction would be necessary to obtain an ablation free of Z40 induction. Significant Z40 undercorrection with induction overriding the correction, as found on PMMA (Fig. 2), has also been observed in human eyes after wavefront-guided LASIK.11 With increasing amounts of attempted primary SA (Z40) correction, increasing amounts of secondary SA (Z60) were induced. Thus, a Z40-neutral ablation is not SA neutral, although the Z60-related wavefront distortion is quantitatively lower than that related to Z40 (Figs. 3B, 3C) and is probably caused by ablation efficiency changes across the cornea.
Of potential concern in the present study was that the radius of curvature of the PMMA spheres (8.95 mm) was relatively large in human terms. In fact, it was chosen to match that of the feline corneas used in our cat model.17,26 It should be considered whether ablations on relatively flat PMMA spheres are less affected by peripheral fluence loss than similar ablations on steeper human corneas. In addition, a potential influence of preoperative toricity and asphericity on SA induction must be determined in future model studies. Another caveat is the assumption that the ablation rate on corneal tissue is as uniform as on PMMA. There may be variation of ablation rate with ablation depth leading to different amounts of SA induction in living tissue. However, since our results on PMMA are comparable to results obtained from human3,11 and feline17 eyes, we assume that the PMMA model used in the present study yields valid results, at least for the −6-D treatment.
Change of Retinal Image Quality
The simulation model allowed experimental calculation and comparison of retinal image quality of the different ablation profiles, based on the same patient collective. Table 3 and Figure 3D showed that the reduction of induced Z40 using aspheric ablation profiles led to an improved retinal image quality (BCVSOTF) compared with the standard treatment (0n). Although the differences were marginal at smaller pupil diameters, they were statistically significant at a 6-mm pupil diameter, where the greatest BCVSOTF difference (ΔBCVSOTF) could be found between the 0n and the 3n profile. This difference (0.22 log units) roughly equals two high-contrast logMAR steps and therefore can be considered clinically relevant.19 Because of induction of negative Z40 (overcorrection) and the relative high Z60 induction, the 6n profile contained steeper slopes and thus showed a behavior different from that of the 0n, 1n, and 3n profiles. Compared with the 3n profile, the 6n profile decreased BCVSOTF more at smaller pupil diameters. This effect, which could also be explained by the Z40 overcorrection and higher induction of Z60, was reduced for diameters larger than 6 mm (Fig. 3D). Because SA can enhance depth of focus16,27 and there is evidence that the reduction of SA by aspheric intraocular lenses (IOLs) can compromise depth of focus,28 it seemed necessary to investigate depth of focus of the different profiles. We calculated depth of focus by defocusing the LOA-optimized simulated postoperative WFE and used the metric VSOTF as the criterion of optical quality (optical depth of focus). The cutoff from the maximum VSOTF (in-focus) was set to −0.2 log VSOTF units. Depth of focus simulation showed that there were no differences between spherical and aspheric profiles for a 3-mm pupil diameter and only marginal differences for a 6-mm pupil diameter (Table 5, Fig. 6). This could be explained by the fact that the treatment left residual primary and secondary SA in postoperative eyes that still affected depth of focus. Like the curves of WFE and VSOTF as a function of pupil diameter, the defocus curves of the 6n profile were of different shape with a sharp dip around −2.25 D (3-mm pupil diameter) and −1 D (6-mm pupil diameter), most likely due to induction of negative Z40 and positive Z60. Even though they were statistically significant, we believe the differences in depth of focus to be negligible because they were not noticeable for the near-vision–important 3-mm pupil diameter and they were small over a 6-mm diameter.
Finally, although the present results suggest superiority of aspheric profiles, they should be interpreted with some caution. First, the simulation probably over- or underestimates the real retinal image quality, since in the model, a perfectly centered ablation without induction of astigmatism, coma, and trefoil is assumed. Real BCVSOTF differences may be smaller if nonrotationally symmetric aberrations are induced.3,10,11 Second, although the BCVSOTF metric was the most predictive in a recent study of post-LASIK patients,29 some patients may not notice an enhanced retinal image quality or do not show functional improvements15,30–32 as reported psychophysically for aspheric IOLs.33
Decentration Tolerance
Our previous study suggested that treatments with high induction of SA were more susceptible to image deterioration induced by decentration.12 This hypothesis was confirmed by the present study. When decentered, aspheric profiles induced less coma than the standard profile (0n, Fig. 4), leading to a higher decentration tolerance (Table 4, Fig. 5) with all pupil diameters. Most likely because of Z40 overcorrection and higher Z60 induction, decentration tolerance of BCVSOTF at smaller pupil diameters was lower for the 6n than for the 3n profile (Fig. 5D). For BCVSOTF obtained over a 6-mm pupil diameter, minimum values of decentration tolerance were below 500 μm for the 0n, 1n, and 3n profiles. Given the frequency of random microdecentrations of (≤500 μm)20,21 in uneventful LASIK, some eyes from our collective were at risk of experiencing a decrease of >0.2 log BCVSOTF units, even if no obvious complication occurred. Our results suggest that because of lower coma induction, aspheric profiles are likely to cause less image quality decline in cases of microdecentration, especially at larger pupil diameters.
Implications for Clinical Practice
The present study showed aspheric shaped excimer laser profiles to exhibit significant advantages over a standard profile. Less SA induction and, in the case of decentration, less coma induction provided a higher retinal image quality without significantly compromising depth of focus. By using PMMA spheres with identical radii of curvature, attempted SE, programmed optical zone diameter and by using the same group of myopic eyes for simulation purposes, most variables were kept constant. This allowed for comparison under experimental conditions, but left questions about how a different radius of curvature, a different optical zone, different amounts of attempted SA, and variable ablation rates could influence the outcome. It is likely that each parameter combination requires a different compensation factor—for example, treatments for higher myopia (−8 D and greater), which require higher compensation factors resulting in an induction of optically significant amounts of secondary SA. Therefore, the introduction of individual compensation factors based on corneal curvature, asphericity, attempted SE, programmed optical zone diameter could enhance a personalized “wavefront-optimized” ablation. However, biomechanical effects and wound-healing reactions should not be neglected totally. We are currently using our cat model to address the role of biological variation and its pharmacologic modulation in an ongoing study.17,24,26
In conclusion, from a theoretical standpoint, aspheric ablation profiles appear to be preferable over standard profiles. However, a small difference in asphericity can tip the balance between optimal correction and loss of benefit. Thus, thorough psychophysical and psychometric evaluations are necessary to conclusively prove the superiority of aspheric ablations in daily clinical practice.
Acknowledgments
The authors thank Gerhard Yousefi (Technolas, Munich, Germany) for programming the experimental aspheric profiles.
Footnotes
Supported by National Institutes of Health Grant R01 EY015836 (KRH) and Core Grant P0EY01319F to the Center for Visual Science, grants from Bausch & Lomb Inc., the University of Rochester's Center for Electronic Imaging Systems, a NYSTAR-designated Center for Advanced Technology, a Grant Bu 2163/1-1 Deutsche Forschungsgemeinschaft (DFG) (JB) and an unrestricted grant to the University of Rochester's Department of Ophthalmology from the Research to Prevent Blindness Foundation, Inc.
Disclosure: J. Bühren, None; L. Nagy, None; G. Yoon, Bausch & Lomb, Inc. (C); S. MacRae, Bausch & Lomb, Inc. (C); T. Kohnen, Bausch & Lomb, Inc. (C); K.R. Huxlin, Bausch & Lomb, Inc. (F, C)
References
- 1.Applegate RA, Howland HC. Refractive surgery, optical aberrations, and visual performance. J Refract Surg 1997;13:295–299 [DOI] [PubMed] [Google Scholar]
- 2.Seiler T, Kaemmerer M, Mierdel P, Krinke HE. Ocular optical aberrations after photorefractive keratectomy for myopia and myopic astigmatism. Arch Ophthalmol 2000;118:17–21 [DOI] [PubMed] [Google Scholar]
- 3.Moreno-Barriuso E, Lloves JM, Marcos S, et al. Ocular aberrations before and after myopic corneal refractive surgery: LASIK-induced changes measured with laser ray tracing. Invest Ophthalmol Vis Sci 2001;42:1396–1403 [PubMed] [Google Scholar]
- 4.Kohnen T, Bühren J. Corneal first-surface aberration analysis of the biomechanical effects of astigmatic keratotomy and a microkeratome cut after penetrating keratoplasty. J Cataract Refract Surg 2005;31:185–189 [DOI] [PubMed] [Google Scholar]
- 5.Holladay JT, Janes JA. Topographic changes in corneal asphericity and effective optical zone after laser in situ keratomileusis. J Cataract Refract Surg 2002;28:942–947 [DOI] [PubMed] [Google Scholar]
- 6.Roberts C. Biomechanics of the cornea and wavefront-guided laser refractive surgery. J Refract Surg 2002;18:S589–S592 [DOI] [PubMed] [Google Scholar]
- 7.Yoon G, MacRae S, Williams DR, Cox IG. Causes of spherical aberration induced by laser refractive surgery. J Cataract Refract Surg 2005;31:127–135 [DOI] [PubMed] [Google Scholar]
- 8.Freedman KA, Brown SA, Mathews SM, Young RSL. Pupil size and the ablation zone in laser refractive surgery: considerations based on geometric optics. J Cataract Refract Surg 2003;19:1924–1931 [DOI] [PubMed] [Google Scholar]
- 9.Dorronsoro C, Cano D, Merayo-Lloves J, Marcos S. Experiments on PMMA models to predict the impact of corneal refractive surgery on corneal shape. Optics Express 2006;14:6142–6156 [DOI] [PubMed] [Google Scholar]
- 10.Bühren J, Kühne C, Kohnen T. Influence of pupil and optical zone diameter on higher-order aberrations after wavefront-guided myopic LASIK. J Cataract Refract Surg 2005;31:2272–2280 [DOI] [PubMed] [Google Scholar]
- 11.Bühren J, Kohnen T. Factors affecting the change in lower-order and higher-order aberrations after wavefront-guided laser in situ keratomileusis for myopia with the Zyoptix 3.1 system. J Cataract Refract Surg 2006;32:1166–1174 [DOI] [PubMed] [Google Scholar]
- 12.Bühren J, Yoon G, Kenner S, MacRae S, Huxlin K. The effect of optical zone decentration on lower- and higher-order aberrations after photorefractive keratectomy in a cat model. Invest Ophthalmol Vis Sci 2007;48:5806–5814 [DOI] [PMC free article] [PubMed] [Google Scholar]
- 13.Manns F, Ho A, Parel JM, Culbertson W. Ablation profiles for wavefront-guided correction of myopia and primary spherical aberration. J Cataract Refract Surg 2002;28:766–774 [DOI] [PubMed] [Google Scholar]
- 14.Mrochen M, Donitzky C, Wüllner C, Löffler J. Wavefront-optimized ablation profiles: theoretical background. J Cataract Refract Surg 2004;30:775–785 [DOI] [PubMed] [Google Scholar]
- 15.Koller T, Iseli HP, Hafezi F, Mrochen M, Seiler T. Q-factor customized ablation profile for the correction of myopic astigmatism. J Cataract Refract Surg 2006;32:584–589 [DOI] [PubMed] [Google Scholar]
- 16.Nio YK, Jansonius NM, Fidler V, et al. Spherical and irregular aberrations are important for the optimal performance of the human eye. Ophthalmic Physiol Opt 2002;22:103–112 [DOI] [PubMed] [Google Scholar]
- 17.Nagy LJ, MacRae S, Yoon G, et al. Photorefractive keratectomy in the cat eye: biological and optical outcomes. J Cataract Refract Surg 2007;33:1051–1064 [DOI] [PMC free article] [PubMed] [Google Scholar]
- 18.Thibos LN, Applegate RA, Schwiegerling JT, Webb R. Standards for reporting the optical aberrations of eyes. J Refract Surg 2002;18:S652–S660 [DOI] [PubMed] [Google Scholar]
- 19.Cheng X, Bradley A, Thibos LN. Predicting subjective judgment of best focus with objective image quality metrics. J Vision 2004;4:310–321 [DOI] [PubMed] [Google Scholar]
- 20.Porter J, Yoon G, MacRae S, et al. Surgeon offsets and dynamic eye movements in laser refractive surgery. J Cataract Refract Surg 2005;31:2058–2066 [DOI] [PubMed] [Google Scholar]
- 21.Porter J, Yoon G, Lozano D, et al. Aberrations induced in wavefront-guided laser refractive surgery due to shifts between natural and dilated pupil center locations. J Cataract Refract Surg 2006;32:21–32 [DOI] [PubMed] [Google Scholar]
- 22.Netto MV, Mohan RR, Ambrosio R, Jr, et al. Wound healing in the cornea: a review of refractive surgery complications and new prospects for therapy. Cornea 2005;24:509–522 [DOI] [PubMed] [Google Scholar]
- 23.Dupps WJ, Jr, Wilson SE. Biomechanics and wound healing in the cornea. Exp Eye Res 2006;83:709–720 [DOI] [PMC free article] [PubMed] [Google Scholar]
- 24.Bühren J, Nagy L, Swanton JN, et al. Optical effects of anti-TGFbeta treatment after photorefractive keratectomy in a cat model. Invest Ophthalmol Vis Sci 2009;50:634–643 [DOI] [PMC free article] [PubMed] [Google Scholar]
- 25.Roberts C. The cornea is not a piece of plastic. J Refract Surg 2000;16:407–413 [DOI] [PubMed] [Google Scholar]
- 26.Huxlin KR, Yoon G, Nagy L, Porter J, Williams D. Monochromatic ocular wavefront aberrations in the awake-behaving cat. Vision Res 2004;44:2159–2169 [DOI] [PubMed] [Google Scholar]
- 27.Nio YK, Jansonius NM, Geraghty E, Norrby S, Kooijman AC. Effect of intraocular lens implantation on visual acuity, contrast sensitivity, and depth of focus. J Cataract Refract Surg 2003;29:2073–2081 [DOI] [PubMed] [Google Scholar]
- 28.Rocha KM, Soriano ES, Chalita MR, et al. Wavefront analysis and contrast sensitivity of aspheric and spherical intraocular lenses: a randomized prospective study. Am J Ophthalmol 2006;142:750–756 [DOI] [PubMed] [Google Scholar]
- 29.Bühren J, Pesudovs K, Martin T, et al. Comparison of optical quality metrics to predict subjective quality of vision after laser in situ keratomileusis. J Cataract Refract Surg 2009;35:846–855 [DOI] [PubMed] [Google Scholar]
- 30.Mearza AA, Muhtaseb M, Aslanides IM. Visual and refractive outcomes of LASIK with the SCHWIND ESIRIS and WaveLight ALLEGRETTO WAVE Eye-q excimer lasers: a prospective, contralateral study. J Refract Surg 2008;24:885–890 [DOI] [PubMed] [Google Scholar]
- 31.Yu J, Chen H, Wang F. Patient satisfaction and visual symptoms after wavefront-guided and wavefront-optimized LASIK with the WaveLight platform. J Refract Surg 2008;24:477–486 [DOI] [PubMed] [Google Scholar]
- 32.de Ortueta D, Mosquera SA, Baatz H. Comparison of standard and aberration-neutral profiles for myopic LASIK with the SCHWIND ESIRIS platform. J Refract Surg 2009;25:339–349 [DOI] [PubMed] [Google Scholar]
- 33.Kasper T, Bühren J, Kohnen T. Visual performance of aspherical and spherical intraocular lenses: intraindividual comparison of visual acuity, contrast sensitivity, and higher-order aberrations. J Cataract Refract Surg 2006;32:2022–2029 [DOI] [PubMed] [Google Scholar]


