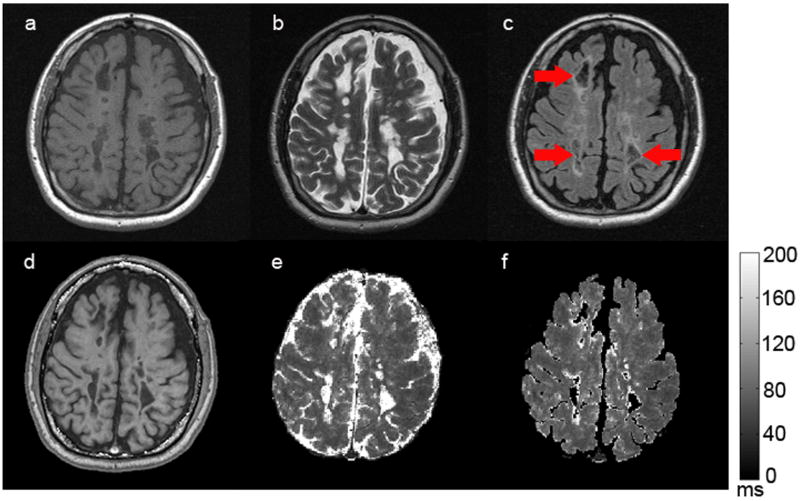
Figure 4.
A representative set of images obtained from a subject (MS #5) with SPMS. The upper row represents SE images: a) T1W-SE, b) T2W-SE, c) T2W-FLAIR; The bottom row represents corresponding images obtained with the GEPCI approach: d) T1W-GEPCI, e) GEPCI-T2* map, f) GEPCI-FLAIR image. The scale bar shows the T2* relaxation time constant in milliseconds. Cystic lesions suppressed on FLAIR images are indicated by red arrows.

