Abstract
Electrical Impedance Tomography (EIT) is an imaging modality which currently shows promise for the detection and characterization of breast cancer. A very significant problem in EIT imaging is the proper modeling of the interface between the body and the electrodes. We have found empirically that it is very difficult, in a clinical setting, to assure that all electrodes make satisfactory contact with the body. In addition, we have observed a capacitive effect at the skin/electrode boundary that is spatially heterogeneous. To compensate for these problems, we have developed a hybrid nonlinear-linear reconstruction algorithm using the complete electrode model in which we first estimate electrode surface impedances, by means of a Levenberg-Marquardt iterative optimization procedure with an analytically computed Jacobian matrix. We subsequently use a linearized algorithm to perform a three-dimensional reconstruction of perturbations in both contact impedances and in the spatial distributions of conductivity and permittivity. Results show that, with this procedure, artifacts due to electrodes making poor contact can be greatly reduced. If the experimental apparatus physically applies voltages and measures currents, we show that it is preferable to compute the reconstruction with respect to the Dirichlet-to-Neumann map rather than the Neumann-to-Dirichlet map if there is a significant possibility that electrodes will be fully disconnected. Finally, we test our electrode compensation algorithms for a set of clinical data, showing that we can significantly improve the fit of our model to the measurements by allowing the electrode surface impedances to vary.
I. Introduction
Electrical impedance tomography (EIT) applies patterns of electrical voltages or currents to the exterior of the body at one or more temporal frequencies to noninvasively image the electrical conductivity and permittivity within the body [1]. EIT has shown promise for a number of biomedical applications, including functional brain imaging [2], monitoring of pulmonary ventilation [3], [4], and breast cancer screening [5], [6], [7], [8], the latter of which will be our focus.
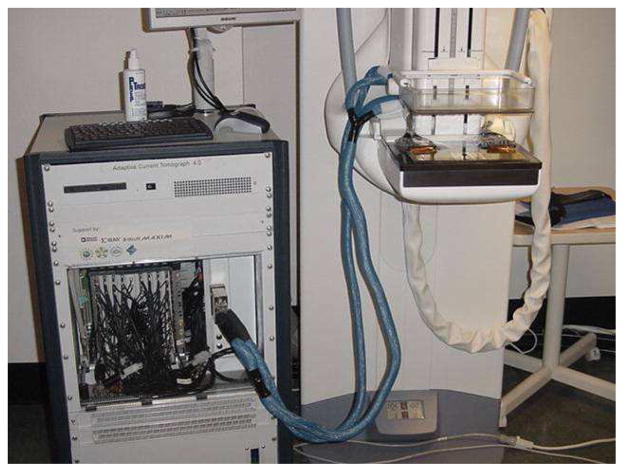
Reports have shown that the conductivity of tumors differs from that of normal tissue [9] and that the impedance spectra of carcinomas differ in a statistically significant way from those of adipose tissue, normal glandular tissue and benign lesions [10]. At Rensselaer, we have developed an EIT breast scanning system, the Adaptive Current Tomograph (ACT) 4 [11], [12], used in conjuction with a three-dimensional digital tomosynthesis system [13], which produces 3-D X-ray reconstructions of the breast’s structure. A radiolucent electrode array [14] makes possible the simultaneous employment of these imaging modalities and the presence of the fiducial markers at the edge of the array enables the near-perfect co-registration of the X-ray and electrical impedance reconstructions. The ACT 4 system, as used with a digital tomosynthesis instrument, can be seen in Fig. 1.
Fig. 1.
Illustration of the ACT 4 as used with a digital tomosynthesis mammography instrument. The radiolucent electrode arrays can be seen affixed to the compression plates.
The problem addressed in this paper is that in a clinical setting, despite our best efforts, it is frequently the case that some electrodes make relatively poor contact with the body. However, as some current still flows into the medium through these electrodes, it would be inappropriate to completely ignore the existence of these electrodes in our modeling. The complete electrode model (CEM) [15], [16], [17] gives us a formulation in which the surface impedance of each electrode can be varied, giving us a parameter to represent the quality of the contact of this electrode with this medium. In this paper, we propose a hybrid nonlinear-linearized method in which we first estimate the surface impedances using a nonlinear optimization approach, following which perturbations in the impedances as well as the three-dimensional distribution of the admittivity are estimated using a linearized algorithm. The problem of erroneous electode data has been previously treated in a research report by Adler [18], but our approach differs in that we explicitly model poor electrode contact using the complete electrode model, finding good agreement of our model with experimental measurements.
EIT experiments can be performed in two ways which are fundamentally equivalent. We can apply currents on the electrodes, measuring the resulting voltages, in which case we compute the reconstruction in terms of the Neumann-to-Dirichlet (NtD) map. Alternatively, we can apply voltages and measure the resulting currents, in which case we consider the Dirichlet-to-Neumann (DtN) map. Given infinite precision and a complete, linearly independent set of measurement patterns on the electrodes, we can exactly obtain the NtD map given the DtN map and vice-versa. However, although SNR for EIT instruments can be very high (100 dB or greater [11]), measurement noise is inevitable. In the best of all cases, we would prefer to acquire the NtD map on the electrodes, applying currents, since it can be shown that the inverse problem with respect to NtD data is somewhat better-conditioned than the corresponding DtN inverse problem. The practical difficulty of this approach is the design of current sources intended to operate across a wide frequency range. One particular factor that significantly complicates the current source design is that, for our radiolucent arrays as currently implemented, the capacitances measured between the instrument and the electrodes differ significantly from one-another. For these reasons, in our present implementation of our EIT breast imaging system, we apply voltages to the electrodes, measuring both voltages and currents.
In our previous work in the mammography configuration, we have physically made DtN measurements, but computed the reconstruction with respect to NtD measurements [17]. As mentioned previously, it is preferable to consider the NtD problem, which is better-posed than the DtN inverse problem. Also, the ave-gap model is very straightforward to specify in terms of Neumann boundary conditions [19], in which case we are able to obtain a relatively simple analytical solution to the forward problem. The key step in the reconstruction, then, was to synthesize the voltage patterns that we would have measured had we applied a complete, orthogonal set of current patterns. We chose to compute the reconstruction with respect to the current patterns that maximize distinguishability [20]. However, we have observed that this synthesis procedure, which involves a matrix inversion in our implementation, becomes extremely unstable if one or several electrodes is fully or partially occluded. We have noticed that a significant amount of pressure between the electrodes and the breast is necessary in order for sufficient current to flow. A number of factors likely contribute to this problem: as designed, our radiolucent electrodes are not perfectly flat, and the pressure distribution of the surface of the breast in contact with the electrode array is not uniform. Thus, even electrodes that appear to be in “contact” may be effectively disconnected if sufficient pressure is not applied.
Proper modeling of the interface between the electrodes and the body is a significant factor affecting out ability to produce accurate reconstructions of the internal conductivity and permittivity. The complete electrode model, which was introduced by [15] takes into account two important physical phenoma: (1) that the potential on the surface of each electrode is constant and (2) that there exists an electrochemical interaction at the interface between the electrode and tissue that can be modeled as a surface impedance. Somersalo [16] performed a careful analysis of the complete model from a mathematical perspective, showing the existence and uniqueness of the solution, provided that certain constraints are imposed.
We have previously described a semi-analytical implementation of the complete electrode model in a three-dimensional parallel-plate geometry [17], such as we use for breast imaging. We have shown with saline tank experiments that the complete model can considerably improve the fidelity of the model to measured data, even if a single surface impedance is postulated for all electrodes. In this work, we used a Galerkin formulation, with continuous basis functions, to solve the forward problem in the weak sense. These basis functions are the eigenfunctions of Laplace’s equation for a rectangular parallelpiped given a desired set of boundary conditions. In the case where the surface impedances on the electrodes differ from one-another, the eigenfunctions can no longer be easily specified analytically, but, provided that the impedances differ only slightly from a constant, the true eigenfunctions will be only slightly perturbed from those that we can compute analytically. In any case, the basis functions that we use form a complete, orthonormal set and are relatively easy to calculate with.
The use of the complete model in EIT image reconstruction has previously been described in a number of publications. Two papers [21], [22] introduced and demonstrated a method for simultaneous imaging and estimation of contact impedances, also implementing the method experimentally. The extension of this approach to the 3-D case has also been reported [23], in which the authors described a reconstruction algorithm based on the finite-element formulation in a cylindrical geometry. In this paper, which considered the case of real measurements, a Gauss-Newton nonlinear optimization algorithm estimated both the internal conductivities and the surface impedances simultaneously. This paper specifically considered the case where currents are applied and voltages are measured.
Using the Galerkin method, we have implemented the complete electrode model, making use of the basis functions which are the eigenfunctions of the complete model with an identical surface impedance for each electrode. We hypothesized that these basis functions could also be used in the case where the surface impedances differ, and preliminary experiments using electrodes connected to a breast-shaped saline-filled tank have confirmed this hypothesis. In our experiments and in the image reconstruction, we make use of the optimal set of current patterns, which maximize average distinguishability [20], [24].
In order to compensate for poor electrode contact, we first estimate the electrode surface impedances using a Levenberg-Marquardt nonlinear optimization procedure, assuming that the medium has a homogeneous conductivity. The Jacobian matrix of the measurements with respect to the surface impedances is computed analytically for each iteration of the algorithm. Given the estimated set of surface impedances, we compute the linearized reconstruction of perturbations in both the spatial distribution of conductivity and electrode surface impedances.
The novelty and utility of our proposed method is as follows. In this work, we show experimentally that the problems of estimating surface impedances and of image reconstruction can be largely decoupled, in certain cases. We thus replace the computationally costly approach of simultaneously estimating medium admittivity and surface impedances using nonlinear optimization. We instead use nonlinear optimization methods to estimate a relatively small number of parameters (the surface impedances), following which a linearized reconstruction of perturbations in both the medium admittivity and the surface impedances is computed. Although the computational savings is considerable, one possible risk is that there may exist images for which these two sets of parameters do not decouple and which can be only be reconstructed using simultaneous nonlinear optimization over all the parameters. We plan to address this possibility in future work.
We have validated the utility of this algorithm with an experiment conducted in a saline tank where an electrode is partially occluded and with a saline-tank experiment in which an electrode has been completely disconnected. Finally, we consider the application of our algorithms to clinical data acquired at Massachusetts General Hospital.
II. Forward Modeling
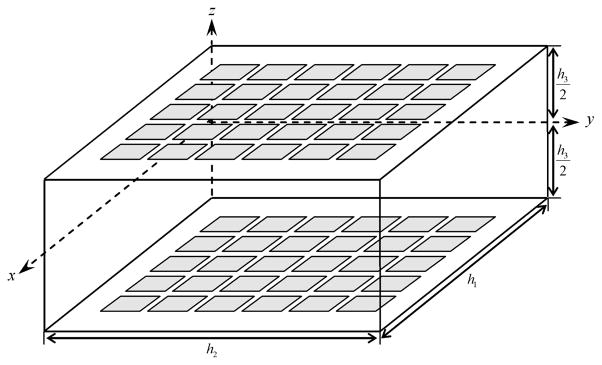
In what follows, we assume that the medium can be approximated as being cubical in shape, with homogeneous complex admittivity (γ = σ + jωε). Experiments in a breast-shaped homogeneous saline-filled tank have verified the appropriateness and utility of this approximation. The idealized geometry used in the forward modeling and image reconstruction is shown in Fig. 2.
Fig. 2.
The mammography geometry is modeled as a rectangular box with electrodes on the top and bottom planes.
The physical relationship between the internal admittivity distribution and the boundary voltages is governed by a partial differential equation with appropriate boundary conditions. Mathematically, this can be formulated as follows: If u(p) is the electric potential and γ(p) = γ is the internal admittivity distribution in the body Ω, then u(p) satisfies
| (1) |
We decompose u using the eigenfunctions of the ave-gap model [19]:
| (2) |
where:
| (3) |
N is the number of Fourier terms used in the approximation, and a0,0 is the constant potential term in the expansion.
The complete electrode model specifies a set of boundary conditions for Eq. 1 that have been experimentally shown to be accurate in modeling the interface between highly conductive electrodes and a considerably less conductive medium. First of all, we know the total current injected through each electrode, and we assume that no current flows out through regions of the surface where electrodes are not present:
| (4) |
| (5) |
where L is the number of electrodes and eℓ is the spatial extent of electrode ℓ.
We also model the interface of the electrode and the medium as being an infinitely thin layer with given surface impedance zℓ:
| (6) |
where Uℓ is the constant potential on electrode l.
Finally, we need the following conditions for the existence and uniqueness of the forward problem:
| (7) |
| (8) |
In implementing the complete model, we make use of a Galerkin approach, in which we have the condition that, for each test function, v, the following equation must be satisfied:
| (9) |
Using the divergence theorem and applying the conditions of the CEM, we then find:
| (10) |
We discretize this equation with respect to the basis functions specified by Eq. 2 and solve for the current patterns which are the eigencurrents of the ave-gap model.
In this paper, we follow closely the approach previously taken, although the equations have been slightly modified to explicitly enforce Eqs. 7 and 8. We have also included in our formulation a basis function representing a constant potential throughout the medium. The resulting equation for the voltage on the electrodes and the potential within the medium is the following:
| (11) |
where, given a set of basis functions {φ1, φ2, …, φN}:
| (12) |
| (13) |
| (14) |
| (15) |
| (16) |
| (17) |
| (18) |
The vector u represents basis function coefficients for the potential in the interior of the medium and U is an L×1 vector giving the potential on the electrodes. Also, 1 is an 1×L vector of all ones. The matrices A and B are of dimension N × N and the matrix C is of dimension N × L. The vector e specifies the applied currents. We scale our basis functions such that Q = γI, where I is the N × N identity matrix.
Alternatively, using the same approach, we can compute the currents that would result from application of a given set of voltages on the electrodes:
| (19) |
III. Surface Impedance Estimation and Reconstruction
Using the divergence theorem applied to Eq. 1, we find that, for the potentials due to two current patterns, α and β:
| (20) |
Subsituting in Eqs. 4 and 6 and incorporating the assumption that zl = z0,l + δzl, we find:
| (21) |
Eq. 21 gives us a framework for computing the reconstruction in terms of the Neumann-to-Dirichlet map. We can also consider the reconstruction with respect to DtN data:
| (22) |
In our reconstruction, we assume that the perturbation from the background conductivity value, η = γ − γ0 can be represented as a linear combination of non-overlapping mesh elements:
| (23) |
where χi is a characteristic function which equals 1 within voxel i and 0 elsewhere. The total number of voxels is denoted by Nv.
Finally, we obtain the following linearization:
| (24) |
where:
| (25) |
| (26) |
and D is the vectorized form of the first term of Eq. 21 or Eq. 22 for all possible pairs of current patterns. If we use the basis functions given in Eq. 2, we can compute the Jacobian matrices, Jz and Jη, analytically
In order to estimate the surface impedances via nonlinear optimization, we need a cost function. Thus, to be as consistent with the linearized reconstruction as possible, we have chosen the cost function:
| (27) |
where D is computed using Eq. 21 or Eq. 22, depending on whether we are using an NtD or DtN reconstruction approach, respectively.
We use the following procedure to estimate the surface impedances and compute the reconstruction:
First, we assume that the medium is homogeneous, estimating the surface impedances using a Levenberg-Marquardt nonlinear optimization procedure.
After convergence of step (i), we compute a linearized reconstruction of perturbations in the medium’s conductivity as well as the perturbations in the surface impedances.
To elaborate on step (i) above, in order to estimate the surface impedances we use the following algorithm:
Given an initial guess for the surface impedances, z0, find a value of the background conductivity, γ0, that minimizes .
-
Compute new values of the background conductivity and the surface impedances using the following update formula:
(28) where:
(29) and, here:
(30) Return to step (ii) until convergence.
Finally, we compute the linearized reconstruction using the following equation:
| (31) |
| (32) |
where λNOSER and λTikh are the NOSER [25] and Tikhonov regularization parameters, respectively. The previously estimated background admittivity and surface impedances are γest and zest, respectively.
IV. Measurement Synthesis
In general, we would like to apply orthogonal measurement patterns, in order to maximize the extent to which our measurements are uncorrelated from one-another. However, although our voltage sources are very precise, there will always be some degree of inaccuracy, meaning that the voltages patterns that are actually applied differ slightly from those that we intended to apply. In this section, we will describe a data synthesis procedure in which we are able to determine what currents would have resulted had we actually applied the voltages that we had intended to apply.
In addition, using a similar procedure, it is possible to determine the voltages that would have resulted had we applied a particular set of current patterns, in which case we are able to compute the reconstruction with respect to the NtD map. As will be shown, synthesizing Neumann data can be a very unstable procedure if our measurements are characterized by electrode contact problems.
In the case of synthesizing Dirichlet measurements, let us suppose that we express our voltages and currents with respect to a basis of patterns:
| (33) |
where is an L × 1 column vector and thus T is an L × (L − 1) matrix. We then have:
| (34) |
where e and v are L × 1 column vectors giving the currents and voltages, respectively, on the electrodes, and ja, va are basis vector coefficients of the currents and voltages with respect to basis a.
Let us suppose that we apply the patterns of voltages: { }. If we decompose the measured currents with respect to the same set of patterns, we can then express the DtN map with respect to basis a as:
| (35) |
If we wish to express the DtN map with respect to another basis, d, for example the eigen-patterns of the DtN map, we apply a straightforward change of basis:
| (36) |
where . If both a and d represent orthonormal bases, then P−1 = PH, PH being the Hermitian transpose of P. Finally, if we wish to compute the NtD map with respect to basis d, we find the matrix R such that:
| (37) |
From Eq. 36, we see that:
| (38) |
However, if one of more electrodes is poorly connected, then it is not possible to measure L − 1 linearly independent current patterns and thus Λa is singular or very nearly so.
V. Results and Discussion
To test our method, we have conducted an experiment in a saline tank, shown in Fig. 3(a) with electrode 10 partially occluded by covering a portion of its area with a thin plastic film, as shown in Fig. 3(b). This is intended to simulate the poor electrode contact which we have often observed in a clinical setting. As our system consists of 60 electrodes, we applied 59 patterns of voltages to this electrode array, measuring the actual voltage and current on each electrode. We then synthesized the voltages that we would have measured if patterns of currents had been applied, which can be found using a simple linear transformation as given by Eq. 37.
Fig. 3.
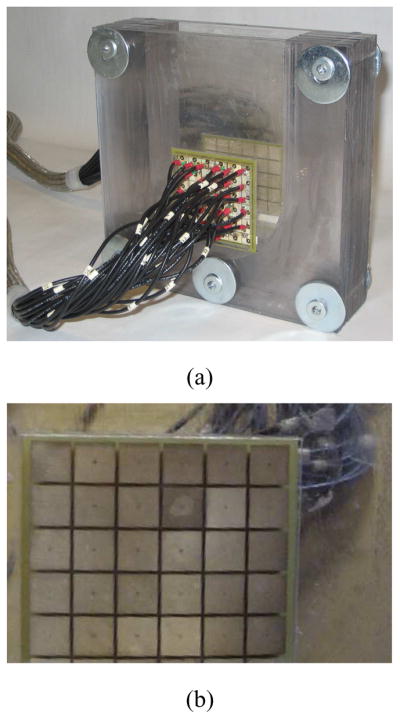
The 60-electrode test phantom for the 3-D mammography geometry used in the experiment. (a) 3-D test phantom. (b) Illustration of electrode 10 partially occluded.
We filled the tank with a saline solution having conductivity of approximately 60 mS/m and acquired an EIT image of the homogeneous tank, to provide a reference for difference imaging. We then placed a 1 cm3 conductive target near the edge of the electrode array and acquired an EIT image of the saline tank containing the target.
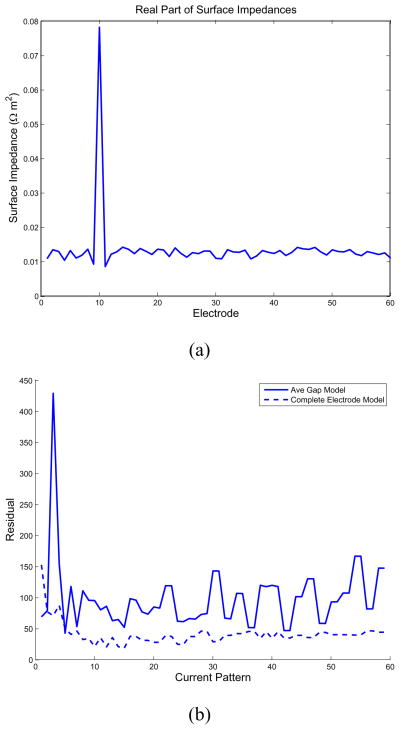
In our first test, we make use of an NtD reconstruction formulation, in order that it be possible to compare the results obtained by the complete electrode model, with estimated surface impedances, to the ave-gap model directly. Given the synthesized voltages which correspond to the application of the canonical set of current patterns, we used a Levenberg-Marquardt nonlinear optimization procedure to estimate a different surface impedance for each electrode. We see in Fig. 4(a) that the best fit of the complete electrode model to the measured data is obtained by setting the surface impedance of electrode 10 to a value much greater than that of other electrodes. This vector of surface impedances also considerably reduces the residual of the fit of the model to the data compared to that which is obtained by assuming a single surface impedance for all electrodes, as shown for all patterns in Fig. 4.
Fig. 4.
Nonlinear estimation of surface impedances. (a) Real part of the estimated surface impedances. (b) Improvement in the residual over the ave-gap model obtained by estimating the surface impedances.
The reconstruction of conductivity using an ave-gap model is shown in Fig. 5(a). A large negative artifact is evident near electrode 10. In contrast, if we compute the linearized reconstruction using the complete model with the estimated set of surface impedances, this artifact is largely eliminated, as shown in Fig. 5(b). The true position of the conductive anomaly is illustrated by the difference imaging reconstruction, using the ave-gap model, in Fig. 5(c). We note that we have added our estimate of the best homogeneous admittivity to the difference image, in order that its scale be comparable to that of the two static reconstructions.
Fig. 5.
Comparison of reconstructions of the saline tank where electrode 10 has been occluded. (a) Ave-gap reconstruction (b) Complete electrode model reconstruction with estimated surface impedances. (c) Ave-gap difference-imaging reconstruction, to show the location of the target.
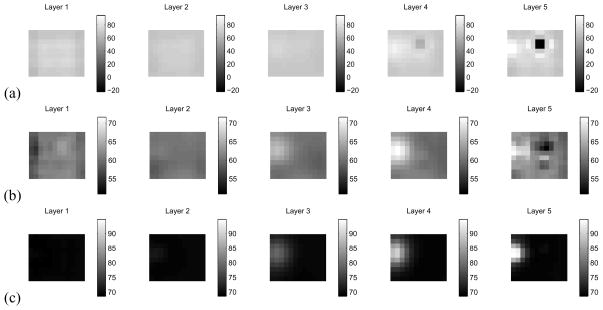
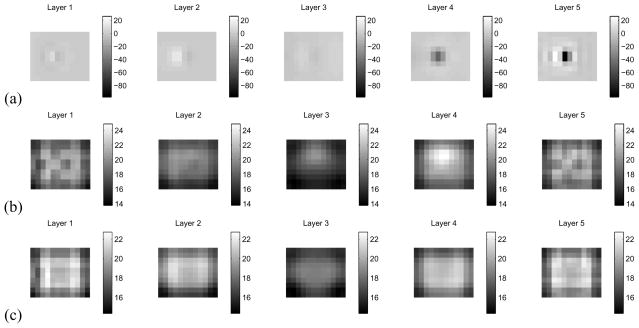
Next, we consider the case where an electrode has been completely disconnected. In this case, we make use of a DtN reconstruction formulation, as, here, synthesizing Neumann data using Eq. 37 is an extremely unstable procedure. We have disconnected electrode 15, which is approximately at the center of the electrode array, and the conducting target is at the upper left in layer 4. The reconstruction using the ave-gap model, in which we have attempted to synthesize the Neumann-to-Dirichlet map is shown in Fig. 6(a). The reconstruction using the CEM and synthesized Dirichlet-to-Neumann data is shown in Fig. 6(b), and we note that the electrode artifact at the center of layer 5 has largely been eliminated. Here the target is clearly visible in layer 4. To better illustrate the location of the target, in Fig. 6(c), we have computed a reconstruction of a homogeneous tank, using the CEM and our procedure for estimating surface impedances, where electrode 15 was not connected to the medium. Here, we note that the reconstruction does not show the target in layer 4, as expected, but that there is no artifact visible due to the non-contacting electrode in the center of the array.
Fig. 6.
Comparison of ave-gap and complete electrode model reconstructions when an electrode has been entirely disconnected. The target can be seen in the center of the upper portion of layer 4. (a) Ave-gap reconstruction, where electrode 15 has been disconnected. (b) CEM reconstruction, with estimated surface impedances, where electrode 15 has been disconnected. (c) CEM reconstruction, with estimated surface impedances, for a homogeneous medium, with electrode 15 disconnected.
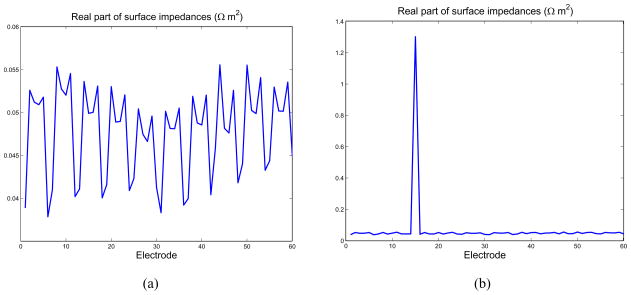
The estimated surface impedances corresponding to the measurements used in producing Fig. 6(b) are shown in Fig. 7(b). For comparison, the surface impedances estimated when all electrodes made excellent contact with the saline tank are shown in Fig. 7(a). Clearly, our algorithm is able to determine that electrode 15 has a very high effective surface impedance in the former case.
Fig. 7.
Nonlinear estimation of surface impedances. (a) Real part of the estimated surface impedances when all electrodes make contact with the medium. (b) Real part of the estimated surface impedances, with electrode 15 disconnected.
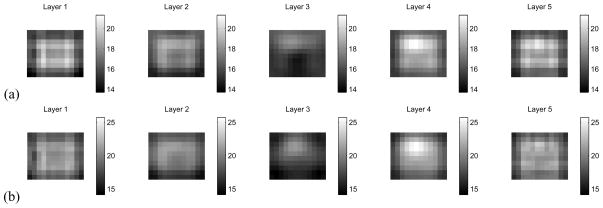
In Fig. 8, we compare the CEM with electrode impedance estimation to the ave-gap model, in the case where all electrodes are fully connected to the medium. The ave-gap reconstruction is shown in Fig. 8(a) and the CEM reconstruction, with estimated impedances is shown in Fig. 8(b). There is little visible difference between the two reconstructions, reassuring us that the information loss necessarily induced by introduction of additional unknowns in the inversion is not too severe for realistic experimental data.
Fig. 8.
Comparison of ave-gap and complete electrode model reconstructions when all electrodes are fully in contact with the medium. The target can be seen in the center of the upper portion of layer 4. (a) Ave-gap reconstruction, all electrodes connected. (b) CEM reconstruction, with estimated surface impedances, all electrodes connected.
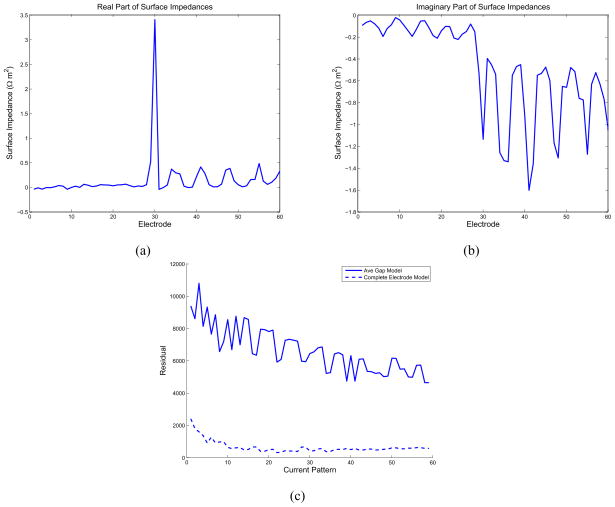
Finally, we apply the algorithms that we have developed to human subject data, collected at Massachusetts General Hospital (MGH), using radiolucent electrode arrays affixed to a pair of mammography plates. Informed consent was obtained under the supervision of the Institutional Review Board at MGH.
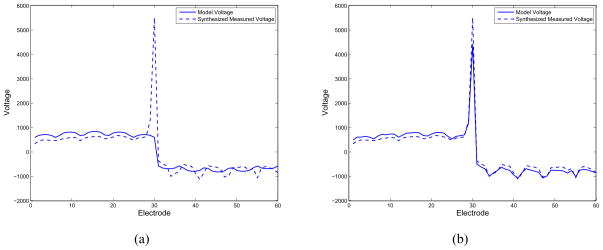
First, we synthesize the voltages corresponding to a current pattern in which we apply a a current density of 1 A/m2 to the electrodes on the bottom electrode array (electrodes 1–30), and a current density of −1 A/m2 to the electrodes on the top electrode array. The synthesized voltages (real part) at 5 kHz are shown as a dashed line in Fig. 9(a), where the corresponding voltages obtained using the ave-gap model are displayed as a solid line. We note the large voltage measured on electrode 30, indicating that it is quite likely to be occluded. We then estimated the surface impedances on all electrodes, assuming a homogeneous medium, finally obtaining the voltages for this current pattern using the complete model, shown in Fig. 9(b). We note that our model now produces a large peak in electrode 30, as expected.
Fig. 9.
Comparison of synthesized voltages (real component) for clinical patient data at 5 kHz. (a) Ave-gap model. (b) Complete electrode model with estimated impedances.
The real and imaginary parts of the surface impedances are shown in Fig. 10(a) and Fig. 10(b), respectively. The improvement in the residual over the ave-gap model for all current patterns attained by use of the CEM and estimating appropriate electrode impedances is shown in Fig. 10(c). We note that not only is a relatively large surface impedance estimated for electrode 30, but also that a significant capacitive component to the surface impedances is also observed.
Fig. 10.
Estimated surface impedances for clinical data at 5 kHz. (a) Real part of the estimated surface impedances. (b) Imaginary part of the estimated surface impedances. (c) Improvement in residual over the ave-gap model.
Although these results are promising, further investigation will be necessary to determine to what extent the image reconstruction in human subjects is improved by use of the proposed algorithms. It will be further necessary to study the effect of electrode modeling methods on sensitivity and specificity of EIT for breast cancer detection.
VI. Conclusion and Future Work
We have formulated, implemented, and experimentally demonstrated a procedure for using the complete electrode model to compensate for poor electrode contact in electrical impedance tomography. We first estimate surface impedances, assuming a spatially homogeneous medium and then compute a linearized reconstruction of perturbations in both surface impedances and in the spatial distribution of conductivity, linearizing about our estimate of the surface impedances. Saline tank experiments have demonstrated the potential of this method for significantly reducing electrode contact artifacts. We have also shown the potential of this method to compensate for poor electrode contact and capacitive coupling for human subject data. In future, we plan to analyze the statistical performance of our algorithm and we also plan to compare our approach to one in which a full nonlinear reconstruction of medium admittitivity and surface impedances is computed.
Acknowledgments
This work was supported in part by CenSSIS, the Center for Subsurface Sensing and Imaging Systems, under the Engineering Research Centers Program of the National Science Foundation (award number EEC-9986821) and NIBIB, the National Institute of Biomedical Imaging and Bioengineering under (Grant Number R01-EB000456-03). We also thank the mammography technologists at Massachusetts General Hospital as well as the subjects who have generously volunteered to participate in our study.
Footnotes
Personal use of this material is permitted. However, permission to use this material for any other purposes must be obtained from the IEEE by sending a request to pubs-permissions@ieee.org.
Contributor Information
Gregory Boverman, Email: gbover-man@isi.edu, Information Sciences Institute, University of Southern California, Arlington, VA USA.
David Isaacson, Department of Mathematical Sciences, Rensselaer Polytechnic Institute, Troy, NY USA.
Gary J Saulnier, Electrical, Computer, and Systems Engineering Department, Rensselaer Polytechnic Institute, Troy, NY USA.
Jonathan C Newell, Biomedical Engineering Department, Rensselaer Polytechnic Institute, Troy, NY USA.
References
- 1.Barber DC, Brown BH. Applied potential tomography. J Phys E: Sci Instrum. 1984;17:723–733. [Google Scholar]
- 2.Tidswell T, Gibson A, Bayford RH, Holder DS. Three-dimensional electrical impedance tomography of human brain activity. Neuroimage. 2001;13:283–294. doi: 10.1006/nimg.2000.0698. [DOI] [PubMed] [Google Scholar]
- 3.Frerichs I, Schmitz G, Pulletz S, Schadler D, Zick G, Scholz J, Weiler N. Reproducibility of regional lung ventilation distribution determined by electrical impedance tomography during mechanical ventilation. Physiological Measurement. 2007;28(7):S261–S267. doi: 10.1088/0967-3334/28/7/S19. [DOI] [PubMed] [Google Scholar]
- 4.Leathard AD, Brown BH, Campbell JH, Morice FZAH, Taylor D. A comparison of ventilatory and cardiac related changes in EIT images of normal human lungs and of lungs with pulmonary emboli. Phyisiol Meas. 1994;15(2A):A137–146. doi: 10.1088/0967-3334/15/2a/018. [DOI] [PubMed] [Google Scholar]
- 5.Kerner TE, Paulsen KD, Hartov A, Soho SK, Poplack SP. Electrical impedance spectroscopy of the breast: Clinical imaging resuls in 26 subjects. IEEE Trans Med Imag. 2005;25(5) doi: 10.1109/tmi.2002.800606. [DOI] [PubMed] [Google Scholar]
- 6.Soni N, Hartov A, Kogel C, Poplack SP, Paulsen KD. Multi-frequency electrical impedance tomography of the breast: new clinical results. Physiological Measurement. 2004;25:301–314. doi: 10.1088/0967-3334/25/1/034. [DOI] [PubMed] [Google Scholar]
- 7.Cherepenin V, Karpov A, Korjenevsky A, Kornienko V, Mazaletskaya A, Mazourov D, Meister D. A 3D electrical impedance tomography (EIT) system for breast cancer detection. Physiol Meas. 2001;22:9–18. doi: 10.1088/0967-3334/22/1/302. [DOI] [PubMed] [Google Scholar]
- 8.Malich A, Fritsch T, Anderson R, Boehm T, Freesmeyer MG, Fleck M, Kaiser WA. Electrical impedance scanning for classifying suspicious breast lesions: first results. European Radiology. 2000;10:1555–1561. doi: 10.1007/s003300000553. [DOI] [PubMed] [Google Scholar]
- 9.Jossinet J. The impedivity of freshly excised human breast tissue. Physiol Meas. 1998;19:61–75. doi: 10.1088/0967-3334/19/1/006. [DOI] [PubMed] [Google Scholar]
- 10.Jossinet J, Schmitt M. A review of parameters for the bioelectrical characterization of breast tissue. Annals of the New York Academy of Sciences. 1999;873:30–41. doi: 10.1111/j.1749-6632.1999.tb09446.x. [DOI] [PubMed] [Google Scholar]
- 11.Saulnier G, Liu N, Tamma CP, Xia H, Kao T-J, Newell J, Isaacson D. An electrical impedance spectroscopy system for breast cancer detection. Proc. IEEE EMBC; August 2007; [DOI] [PubMed] [Google Scholar]
- 12.Liu N, Saulnier GJ, Newell JC, Isaacson D, Kao T-J. ACT4: A high-precision, multi-frequency electrical impedance tomograph. Proc. 6th Conf. on Biomedical Applications of Electrical Impedance Tomography; June 2005.London, UK: University College London; [Google Scholar]
- 13.Niklason LT, Christian BT, Niklason LE, Kopans DB, Castleberry DE, Opsahl-Ong BH, Landberg CE, Slanetz PJ, Giardino AA, Moore R, Albagli D, DeJule MC, Fitzgerald PE, Fobare DF, Giambattista BW, Kwasnick RF, Liu J, Lubowski SJ, Possin GE, Wei JFRCY, Wirth RF. Digital tomosynthesis in breast imaging. Radiology. 1997;205:399–406. doi: 10.1148/radiology.205.2.9356620. [DOI] [PubMed] [Google Scholar]
- 14.Kao TJ, Saulnier GJ, Xia H, Tamma C, Newell JC, Isaacson D. A compensated radiolucent electrode array for combined EIT abd mammography. Physiological Measurement. 2007;28(7):S291–S299. doi: 10.1088/0967-3334/28/7/S22. [DOI] [PMC free article] [PubMed] [Google Scholar]
- 15.Cheng KS, Isaacson D, Newell JC, Gisser DG. Electrode models for electric current computed tomography. IEEE Trans Biomed Eng. 1989;36(9):918–924. doi: 10.1109/10.35300. [DOI] [PMC free article] [PubMed] [Google Scholar]
- 16.Somersalo E, Cheney M, Isaacson D. Existence and uniqueness for electrode models for electric current computed tomography. SIAM J Appl Math. 1992;4:1023–1040. [Google Scholar]
- 17.Kim BS, Boverman G, Newell JC, Saulnier GJ, Isaacson D. The complete electrode model for EIT in a mammography geometry. Physiological Measurement. 2007;28(7):S57–S69. doi: 10.1088/0967-3334/28/7/S05. [DOI] [PMC free article] [PubMed] [Google Scholar]
- 18.Adler A. Accounting for erroneous electrode data in electrical impedance tomography. Physiological Measurement. 2004;25:227–238. doi: 10.1088/0967-3334/25/1/028. [DOI] [PubMed] [Google Scholar]
- 19.Choi MH, Kao TJ, Isaacson D, Saulnier GJ, Newell JC. A reconstruction algorithm for breast cancer imaging with electrical impedance tomography in mammography geometry. IEEE Transactions on Biomedical Engineering. 2007;54(4):700–710. doi: 10.1109/TBME.2006.890139. [DOI] [PMC free article] [PubMed] [Google Scholar]
- 20.Isaacson D. Distinguishability of conductivities by electric current computed tomography. IEEE Trans Med Imag. 1986;5:92–95. doi: 10.1109/TMI.1986.4307752. [DOI] [PubMed] [Google Scholar]
- 21.Vilhunen T, Kaipio JP, Vauhkonen PJ, Savolainen T, Vauhkonen M. Simultaneous reconstruction of electrode contact impedances and internal electrical properties: I. Theory. Meas Sci Technol. 2002;13:1848–1854. [Google Scholar]
- 22.Heikkinen L, Vilhunen T, West RM, Vauhkonen M. Simultaneous reconstruction of electrode contact impedances and internal electrical properties: II. Laboratory experiments. Meas Sci Technol. 2002;13:1855–1861. [Google Scholar]
- 23.Vauhkonen PJ, Vauhkonen M, Savolainen T, Kaipio JP. Three-dimensional electrical impedance tomography based on the complete electrode model. IEEE Trans Biomed Eng. 1999;46(9) doi: 10.1109/10.784147. [DOI] [PubMed] [Google Scholar]
- 24.Kao TJ, Newell JC, Saulnier GJ, Isaacson D. Distinguishability of inhomogeneities using planar electrode arrays and different patterns of applied excitation. Physiol Meas. 2003;24:403–411. doi: 10.1088/0967-3334/24/2/352. [DOI] [PubMed] [Google Scholar]
- 25.Cheney M, Isaacson D, Newell JC, Simske S, Goble J. NOSER: an algorithm for solving the inverse conductivity problem. Int J Imag Syst Technol. 1990;2:66–75. doi: 10.1002/ima.1850020203. [DOI] [PMC free article] [PubMed] [Google Scholar]


