Abstract
This paper describes results from a stochastic computational neuron model that simulates the effects of rate adaptation on the responses to electrical stimulation in the form of pulse trains. We recently reported results from a single-node computational model that included a novel element that tracks external potassium ion concentration so as to modify membrane voltage and cause adaptation-like responses. Here, we report on an improved version of the model that incorporates the anatomical components of a complete feline auditory nerve fiber (ANF) so that conduction velocity and effects of manipulating the site of excitation can be evaluated. Model results demonstrate rate adaptation and changes in spike amplitude similar to those reported for feline ANFs. Changing the site of excitation from a central to a peripheral axonal site resulted in plausible changes in latency and relative spread (i.e., dynamic range). Also, increasing the distance between a modeled ANF and a stimulus electrode tended to decrease the degree of rate adaptation observed in pulse-train responses. This effect was clearly observed for high-rate (5,000 pulse/s) trains but not low-rate (250 pulse/s) trains. Finally, for relatively short electrode-to-ANF distances, increases in modeled ANF diameter increased the degree of rate adaptation. These results are compared against available feline ANF data, and possible effects of individual parameters are discussed.
Keywords: axonal model, adaptation, auditory nerve fiber, potassium ion, cat, cochlear implant, computational model
Introduction
Computational models of electrically stimulated auditory nerve fibers (ANFs) improve our understanding of electric excitation of the nerve. Most have explored temporal responses (Rubinstein et al. 1999; Bruce et al. 1999, 2000; Mino et al. 2004) while a few focus on spatial recruitment with realistic cochlear models (Finley et al. 1990; Frijns et al. 2001). Most use Hodgkin and Huxley (1952, “HH”) or Frankenhaeuser and Huxley (1964) equations to predict ionic currents, with species-specific adjustments. To mimic stochastic properties (Verveen 1961; Miller et al. 1999), nodes are modified by adding a noise term (Fox 1997; Bruce et al. 1999; Rattay et al. 2001) or Markov process (Clay and Defelice 1983; Rubinstein 1995; Chow and White 1996; Mino et al. 2002). However, models have not simulated rate adaptation.
Earlier studies noted rate adaptation using small (one to eight ANF) pools of acutely deafened ANFs (Parkins 1989; Javel and Shepherd 2000; Javel and Viemeister 2000). Quantification of rate changes, time constants, level effects, etc., was not offered. Systematic descriptions of adaptation were provided by Zhang et al. (2007) and Miller et al. (2008). Data from 88 ANFs provided descriptions of growth vs. level for different pulse rates, growth vs. level across time, rate decrements across time, time constants, threshold effects, vector strength, etc. Such systematic data sets are useful for advancing and validating computer models.
Baylor and Nicholls (1969) showed that extracellular K+ accumulates after spike production and decays exponentially. As the external K+ concentration ([K+] ext) affects resting and reversal potentials (Frankenhaeuser and Hodgkin 1956), we hypothesized it would alter excitability. Our first simulation of adaptation added dynamically changing [K+] ext to a Hodgkin–Huxley model. It used a single-node model to test the utility of the mechanisms (Woo et al. 2009a). While it produced rate adaptation within published ranges (Zhang et al. 2007), a single-node model has obvious limitations. Anatomical features related to adaptation, such as fiber diameter (Rhode and Smith 1985; Muller and Robertson 1991), require a more complete model. Other variables affecting depolarization and adaptation, such as electrode-to-fiber distance and initiation site (Frijns et al. 1996; Mino et al. 2004) require an axonal model.
The focus of this study was to evaluate the computational model using single-pulse and pulse-train stimuli and variations in level, electrode-to-fiber distance, peripheral, and central electrode placement to determine how well it simulated data obtained from feline ANFs. Changes in site of excitation and level have long been hypothesized to affect ANF responses. While our simulation accounts for anatomy of cat ANFs, it uses a homogeneous external medium that cannot realistically estimate complex intracochlear electric stimulus fields or population responses. However, by manipulating electrode position, we can force excitation to occur at particular sites so that the implications of central or peripheral excitation can be examined. By comparing responses across changes in electrode location or distance, we can evaluate general effects of each variable. This approach has been previously employed. Van den Honert and Stypulkowski (1984) ablated feline peripheral processes to examine responses attributed to central excitation. Cartee et al. (2006) placed electrodes on the nerve trunk so that central excitation was produced.
Methods and materials
Morphology of a representative cat ANF
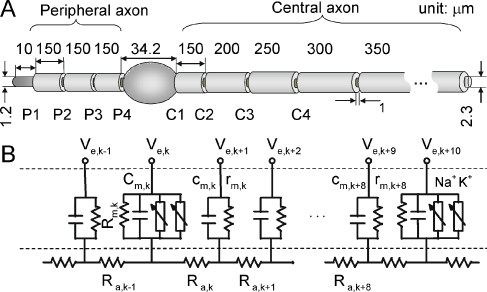
Figure 1A schematizes the typical geometry of a cat ANF based on assessments of Liberman and Oliver (1984). The neuron has four nodes on the peripheral axon and 23 nodes on the central axon. Internodal distances vary from 150 to 350 μm according to reported anatomy. The cell body has a 300-μm2 cross-sectional area and the elliptical shape of a rotationally symmetric solid with a 0.6 axis ratio. Peripheral fiber diameter, central fiber diameter, and the nodal gap width were set at 1.2, 2.3, and 1 μm, respectively. The ratio of myelin thickness of the cell body to that of the central axon was measured by examining photomicrographs of fibers and cell bodies available from our histological sections. To investigate the effect of ANF diameter on neural adaptation, the peripheral and central fiber diameters were set to either 0.7 and 1.1 μm (respectively) or 2.4 and 4.6 μm (respectively) to cover values spanning most of the range of reported diameters (Arnesen and Osen 1978). The length of the unmyelinated peripheral terminal was set at 10 μm to produce experimentally realistic strength-duration curves (Colombo and Parkins 1987). Initial details concerning the development of a feline ANF model is reported as a brief communication (Woo et al. 2009b).
FIG. 1.
Schematic summary of the computational model. A Anatomical features of a typical cat ANF, using data from Liberman and Oliver (1984). The peripheral axon has an unmyelinated terminal and smaller diameter than does the central axon. Details of the myelinated cell body are provided in the Methods. B Equivalent circuit diagram of an internode and two adjacent active nodes. Only the active nodes have Na and K stochastic channels as well as the resistances and capacitances.
Axon model
One node-to-node section of the model, developed using a compartmental cable approach (McNeal 1976; Colombo and Parkins 1987; Rattay and Aberham 1993; Matsuoka et al. 2001; Mino et al. 2004), is shown in Figure 1B. Each myelinated section is modeled by nine consecutive passive internodal compartments, followed by an active node, which exclusively includes the voltage-dependent Na and K channels. The transmembrane potential in each axon compartment is determined by solving a partial differential equation using the Crank–Nicholson method (Mino et al. 2004). The values of the voltage-independent nodal resistance, Rm, and nodal capacitance, Cm, are same as those reported in Woo et al. (2009b). Axoplasmic resistance, Ra, internodal resistance, rm, internodal capacitance, cm, and ionic electrophysiological properties (e.g., channel density, ρ, and conductance, γ) were based on Mino et al. (2004) and Woo et al. (2009b). The model parameters are summarized in Table 1. We chose densities of 80/μm2 for Na channels and 45/μm2 for K channels to produce an absolute refractory period (ARP) of 0.41 ms, comparable to feline data (Miller et al. 2001). The myelin dielectric constant, εl, was set to obtain conduction velocities similar to feline values (i.e., 10–12 m/s; Nguyen et al. 1999; Miller et al. 2004). We assumed an ion channel density of the peripheral unmyelinated terminal that is 15 times less than the nodal densities (Massacrier et al. 1990). For computational efficiency, the stochastic activity of each channel was achieved using a channel-number tracking algorithm based on a Markov jumping process (Gillespie 1977; Chow and White 1996; Mino et al. 2004). Stimulation was provided by a spherical, 0.45-mm diameter monopole to approximate the monopolar electrodes used in our group's feline studies. The extracellular potential at an arbitrary position (x) that resulted from the applied electric stimulus current Iapp(t) is given by:
 |
where zd(x) is the space between point x and electrode, and ρe is the mean resistivity of the extracellular medium.
TABLE 1.
The electrophysiological parameters of the ANF model
| Parameter | Value | Reference | ||
|---|---|---|---|---|
| Node of Ranvier | ||||
| Resistance, Rm | 166.2 kΩ mm2 | Mino et al. 2004 | ||
| Capacitance, Cm | 0.5125 nF/mm2 | Mino et al. 2004 | ||
| Internode | Tasaki 1955 | |||
| Resistance, rm |
 a a
|
Mino et al. 2004; Cartee 2006 | ||
| Capacitance, cm |  |
|||
| Na channel | Matsuoka et al. 2001 | |||
| Nernst potential, ENa | 66 mV | |||
| Density, ρNa | 80/μm2b | Mino et al. 2004 | ||
| Conductance, γNa | 22.65 pS | |||
| K channel | ||||
| Nernst potential, EK | −88 mV | |||
| Density, ρK | 45/μm2b | |||
| Conductance, γK | 50.0 pS | |||
| Na+ gating kineticsc | A | B | C | Schwarz and Eikhof 1987 |
| αm | 1.872 | 25.41 | 6.06 | |
| βm | −3.793 | 21.001 | 9.41 | Matsuoka et al. 2001 |
| αh | −0.549 | −27.74 | 9.06 | |
| βh | 22.57 | 56 | 12.5 | |
| K+ gating kineticsc | ||||
| αn | 0.129 | 35 | 10 | |
| βn | −0.324 | 35 | 10 | |
| Axoplasmic resistance, Ra | 6378 Ω mm | Mino et al. 2004 | ||
| Resting potential, Erest | −78 mV | Neumcke and Stämpfli 1982 | ||
| Extracellular resistivity, ρe | 0.3 kΩ cm | McNeal 1976 | ||
aε0 is the permittivity of free space (8.854 × 10⁻¹² F/m), εl is the myelin dielectric constant (1.27), lε is the length of compartment one of the nine sub-units of the internode, D is the outer myelinated fiber diameter, d is the unmyelinated (inner) fiber diameter, and ρm is the internodal resistivity (29.26 GΩ mm)
bModified from ρNa = 27/μm2 and ρNa = 10.6/μm2 for producing absolute refractory period = 0.41 ms
c .
.
Adaptation component
The model's adaptation component is described in Woo et al. (2009a) and includes an amplitude constant (Af) and a time constant (τdepl). However, the implementation used in this study employs a more sophisticated approach, where [K+]ext is not merely governed by spike activity, but more appropriately by a time-changing Δ[K+]ext that depends upon recent K+ current:
 |
where t is current time, nR is nth Ranvier node, IK is K+ current, and g(t) is decay function. Details of a discretized version of Eq. 2 and an approximated method to reduce calculation time are described in Woo et al. (2009b).
Simulation
Simulations were performed using MATLAB Version 7.0 R12.1 code (The Mathworks, Inc., USA) and executed on a PC with two Dual-Core 2.0 GHz processors. A 1 μs temporal resolution was used. The electric stimulus, Iapp(t), was either a single monophasic cathodic pulse (40 µs/phase) or a biphasic pulse train (40 µs/phase, cathodic polarity first) presented at a rate of 250 and 5,000 pulse/s, up to 200 ms in duration. These pulse shapes and rates were chosen to match our feline study designs. Because of the intensive computational load and memory limitations, pulse-train durations were limited to 200 ms, in contrast to the 300 ms durations used in our single-node (Woo et al. 2009a) and recent feline studies. However, our feline data indicate that rate adaptation typically reaches asymptotic values within 200 ms. Before each stimulus presentation, all variable parameters (e.g., membrane potential, concentration of external IK, numbers of opened and closed ion channels, etc.) were reset to initial values. Adaptation was primarily characterized by spike-rate decrements computed between the mean spike rate within an onset window (0–12 ms) and a final (100–200 ms) window.
The modeled stimulus electrode was set over either the 2nd peripheral node of Ranvier (P2) or 5th central node of Ranvier (C5) to investigate the effect of a cell body, peripheral-to-central changes in fiber diameter and myelination, and differences due to changing the site of excitation. Electrode-to-fiber distance was varied in four steps, 0.235, 0.245, 0.525, and 2.025 mm, with distances measured from the center of the spherical electrode to the membrane surface. In some instances within this paper, electrode-to-fiber distance is referred to by the variable zE. Membrane potentials were recorded at the 16th central node of Ranvier. The Na+ currents of all nodes were saved to investigate the spike initiation node, identified as the node at which a Na+ current response was first initiated (Spach and Kootsey 1985).
Results
Response to a single pulse
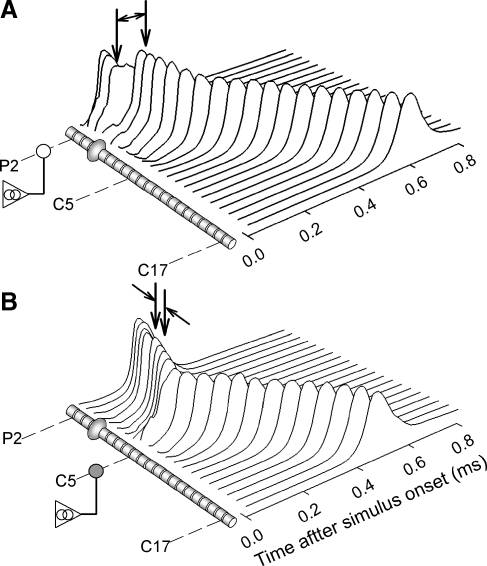
Figure 2 shows examples of spike propagation for two electrode positions: over node P2 of the peripheral axon (Fig. 2A) and node C5 of the central axon (Fig. 2B). A cathodic monophasic pulse was used. The responses at each node were plotted versus time after stimulus onset. The spike produced by excitation of the central node (Fig. 2B) clearly propagated in both directions, indicating orthodromic and antidromic action potentials. For the case of peripheral excitation (Fig. 2A), both forward and reverse propagation may occur, although the orthodromic action potential is more clearly seen in the figure. For peripheral excitation, the greatest node-to-node propagation delay occurs between nodes P3 and P4. This may seem counterintuitive, as these nodes are both peripheral to the cell body. We interpret the “peripheral” delay as being due to the forward local circuit current that must charge the large capacitance of the cell body. Thus, the delays associated with the cell body are measured using spike timing at nodes P3 and P4 and C1 and C2 (for central excitation). These delays were 85 and 20 μs, respectively. The different somatic delays for these two cases are attributed to the different currents associated with propagation along the larger-diameter central axon and the smaller-diameter peripheral process. Spike conduction velocities were measured using latency differences at nodes C18 and C20 using 400 repeated stimulus presentations to reduce random variations. Mean velocities at this central measurement site were 12.1 m/s for both excitation sites.
FIG. 2.
Example of the membrane potentials recorded from each node in response to a single monophasic current pulse. The offsets in the responses correspond to propagation delays. The stimulus electrode was positioned over a peripheral node (A) or a central node (B) to demonstrate site-of-excitation effects.
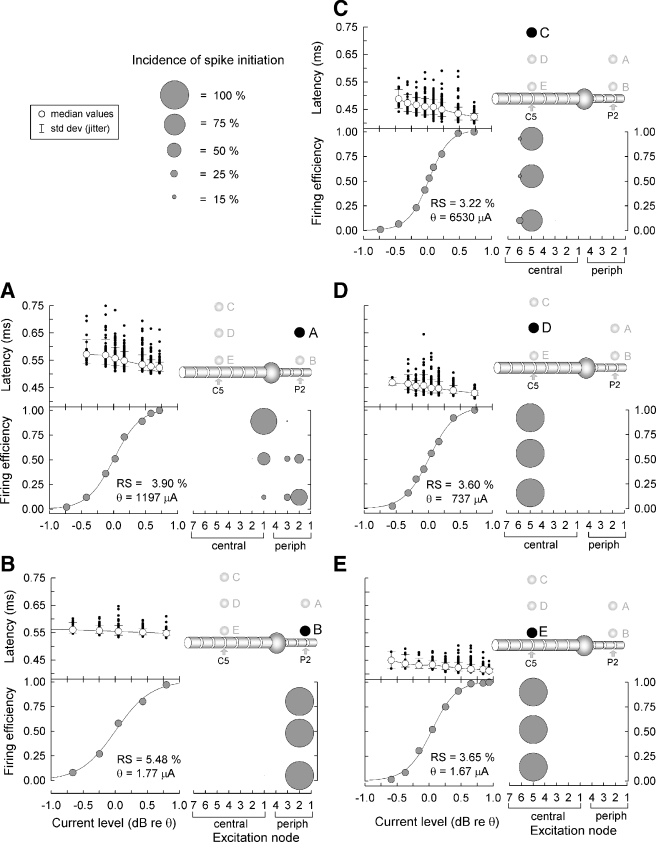
Figure 3 summarizes model responses to single monophasic cathodic pulses, with measures for each condition based on 200 repeated presentations. In each of the five cases, the stimulus electrode was positioned at a different location, two (panels A and B) at 0.925 and 0.235 mm, respectively, from the membrane of the peripheral axon at node P2 and three (panels C, D, and E) positioned 2.025, 0.925, and 0.235 mm above central node C5. For each case, individual spike latencies, mean spike latencies, and firing efficiencies are plotted versus stimulus level. The relative incidences of spike initiation at various nodes are plotted in the lower-right plot of each panel using “bubble” plots, with the area of each bubble proportional to the incidence. Each bubble plot shows the distribution of initiation sites for three firing efficiencies: 10%, 50%, and 90% so that level-dependent shifts in the site of excitation can be evaluated. When the stimulus electrode was positioned close to the peripheral axon (Fig. 3B), all spikes were initiated at the 2nd peripheral node and had relatively long latencies. Moving the electrode further away from the axon (panel A) resulted in the greatest variation in the site of excitation. Specifically, a bimodal distribution of sites-of-excitation is observed in the bubble plot of Figure 3A. Discontinuities or “jumps” in spike latency have been observed in electrically stimulated cat ANFs (Miller et al. 1999) which were attributed to shifts in initiation sites across the cell body.
FIG. 3.
Summary of model responses to single-pulse stimuli (200 repeated presentations of single monophasic 40 μs cathodic pulses). The stimulus electrode is positioned at each of five locations (panels A–E) to explore effects of distance and site of excitation. The distances between the stimulus electrode and axon are 0.235 mm (B and E), 0.925 mm (A and D), and 2.025 mm (C). Electrode positions in A and B overlie the peripheral process while the positions for C–E overlie the central axon. Individual (dots) and mean (circles) spike latencies are plotted vs. stimulus level (top graph of each set) and firing efficiency is also plotted vs. level. Relative spread (RS) and threshold (θ) are indicated for each case. The bubble plots indicate the incidence and location of spike initiation for three values of FE (10%, 50%, and 90%).
Also shown in Figure 3 is the threshold level and relative spread (RS) for each of the five cases. Threshold is defined by the stimulus level that would evoke a firing efficiency of 50%. RS is a means of expressing dynamic range and is based upon fitting the firing-efficiency curve to an integrated Gaussian curve (Verveen 1961). Thresholds for electrode positions near the central axon are lower than those for peripheral process sites. With the electrode positioned over a peripheral node as in Figure 3A, relatively higher stimulus levels resulted in the site of excitation shifting toward the central axon. While all the spikes evoked by an electrode relatively close to central node (Fig. 3D, E) were initiated at the closest node from the electrode, some “spatial jitter”, or variability in the site of excitation, is observed for the case of Fig. 3C. RS ranged from 5.48% to 3.22%., values well within those reported from cats (Miller et al. 1999). Responses initiated on the central axon generally produced lower RS, shorter mean latency, less jitter, and lower threshold than those initiated on a peripheral axon. All of these trends are consistent with those obtained from feline ANFs (Miller et al. 1999, 2003)
Responses to pulse trains
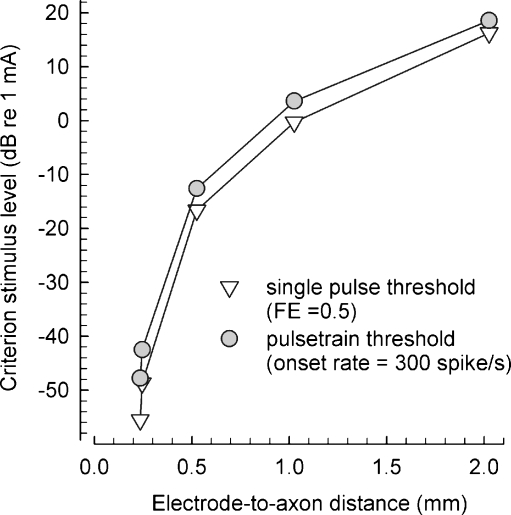
Electrode-to-fiber distance has a large effect on threshold. Figure 4 plots threshold versus electrode-to-fiber distance for single-pulse and 5,000 pulse/s pulse-train stimuli. Threshold for single-pulse stimuli was computed as defined above, while threshold for pulse trains was defined as the level that yielded an onset spike rate of 300 spike/s (with “onset” as defined above, using a 0–12-ms analysis window). With these definitions, pulse-train thresholds were consistently greater than the single-pulse thresholds. For both stimuli, threshold changed by 60 dB across the range of distances and both functions show similar sensitivity to electrode-distance changes. However, the large range of levels exceeds those typically reported in ANF studies (van den Honert and Stypulkowski 1987b; Miller et al. 1999). This difference could be attributed to the model assumption of an isotropic medium which would clearly result in different current spread compared to a real cochlea. It may also be due to difficulty in placing a real electrode surface as close as 0.01 mm from a neural membrane, which is the condition for the shortest distance plotted. Also, in the plots, the greatest threshold changes occur over the range of smallest distances.
FIG. 4.
Electrode-to-axon distance greatly affects threshold, particularly for small distances. Threshold levels for two stimuli (single pulses and 5,000 pulse/s trains) are plotted for electrode-to-axon distances ranging from 0.235 to 2.025 mm. Single-pulse thresholds were defined by the level evoking a firing efficiency of 50%, while a criterion of 300 spike/s within an onset window (i.e., 0–12 ms) was used for the pulse-train stimuli. The arbitrariness of these thresholds advises against comparisons of the two curves' absolute values. The distances are defined from the center of the 0.45 mm diameter spherical electrode and the axon surface. To obtain measures of the space between electrode and neuron, a radius (0.225 mm) should be subtracted from the x-axis values.
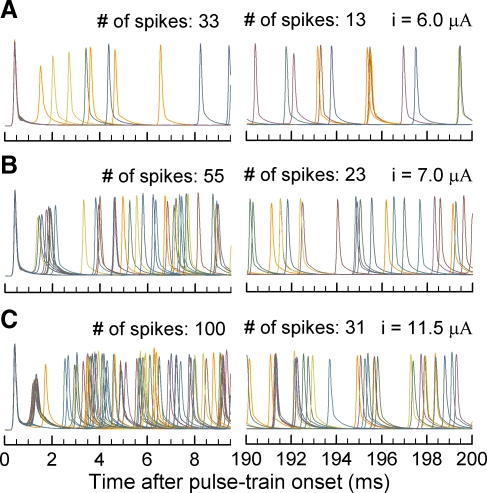
To explore spike-rate adaptation, pulses presented at rates of 250 and 5,000 pulse/s were used. Figure 5 shows action potentials evoked by 5,000 pulse/s trains presented at three levels, with interrupted abscissae to provide details of initial and final 10-ms response epochs. Stimulus levels were chosen to elicit onset rates of 150, 250, and 450 spike/s so as to examine a range of responses. As each figure depicts responses to 20 stimulus repetitions, there is significant overlap of the spikes. The total numbers of spikes for each of the six windows is indicated in the figure. Spike decrements of 20, 32, and 69 spikes (i.e., the difference in spike number between initial and final epochs) across panels A, B, and C (respectively) show that absolute decrements increased with stimulus level.
FIG. 5.
Temporal responses to modeled ANFs vary with level for 5,000 pulse/s stimuli. Transmembrane potentials in response to 20 repeated trains are shown for three stimulus current levels. Stimulus levels were chosen to elicit onset rates of 150, 250, and 450 spike/s. Each panel plots an initial interval of 0–10 ms and a late interval of 190–200 ms so that initial and “steady-state” response patterns can be readily seen.
Figure 5 also shows the irregularity of spike times as well as variations in spike amplitude. Whereas the first spike latency is relatively constant across repeated presentations, variability in spike timing is observed 2 ms after onset. The amplitudes of the second spikes were reduced up to 40% compared with that of the first spike, similar to feline ANF responses to pulse trains (Zhang et al. 2007). This reduction depends on the inter-spike interval as seen in Figure 5B; second spikes with shorter inter-spike intervals had smaller amplitudes than those with longer ones and is consistent with reported refractory properties of cat fibers (Miller et al. 2001) and modeling results (Mino and Rubinstein 2006). The spike amplitudes in the final “steady-state” (190–200 ms) interval are 90% of the initial values, indicating incomplete amplitude recovery.
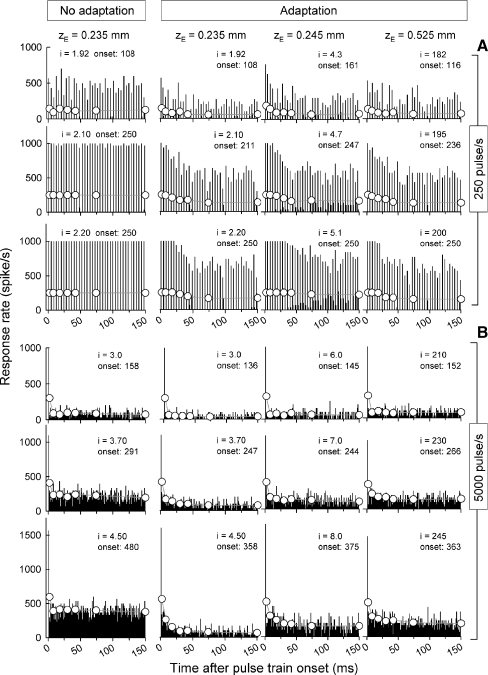
Figure 6 plots PSTHs for 250 pulse/s trains (plots of Fig. 6A) and 5,000 pulse/s trains (plots of Fig. 6B) obtained at three stimulus levels (rows) and three electrode-to-membrane distances (zE, columns). Stimulus levels were chosen to produce similar onset response rates for the different zE values of 100, 200, and 250 spikes/s for 250 pulse/s stimuli and 150, 250, and 350 spikes/s for 5,000 pulse/s trains. The left column of Figure 6 shows PSTHs obtained for the smallest zE value for the model with the adaptation component deactivated. PSTHs are shown for 1 ms bin widths (vertical bars) and wider bins (circles) used to assess across-train trends. The latter PSTHs employed variable-width bins to account for non-constant spike rates, with each symbol positioned in the midpoint of each analysis window. We subsequently refer to the data obtained in the 100–200 ms window as the “steady-state” response.
FIG. 6.
PSTHs produced by the [K+]ext model (columns 2, 3, and 4) demonstrate rate adaptation not seen using an analogous model lacking the adaptation component (column 1). Three stimulus parameters are explored over the 18 PSTHs of columns 2, 3, and 4. The effects of stimulus pulse rate are contrasted by the upper set of PSTHs (A, 250 pulse/s) and the lower set (B, 5,000 pulse/s). Three electrode-to-fiber distances are examined across the three columns and the effect of changing stimulus level is demonstrated across the PSTHs within 1 column. While the no-adaptation model results (leftmost column) demonstrate an initial decrease in spike rate, it is attributed to refractoriness and no further decrements are evident. The current level (i) for each PSTH is expressed in microampere units. Each graph has two histograms, with the vertical bars representing 1 ms bin widths and filled circles representing long intervals. Onset rates are indicated and have units of spike/s.
Inspection of each set of PSTHs across the three zE values indicates that electrode distance influences rate adaptation but, in a way, dependent on stimulation rate. For low-rate (250 pulse/s) stimuli (Fig. 6A), there are no obvious changes in steady-state spike rates as zE changes from 0.235 to 0.525 mm. However, for high-rate (5,000 pulse/s) stimuli (Fig. 6B), increases in zE result in greater steady-state responses (i.e., less adaptation). The PSTHs resulting from simulations without the novel adaptation component (Fig. 6, left column) reveal an initial rate drop associated with the model's refractory (short-term) response properties but do not indicate slower rate decreases evident with the adaptation model or from cats.
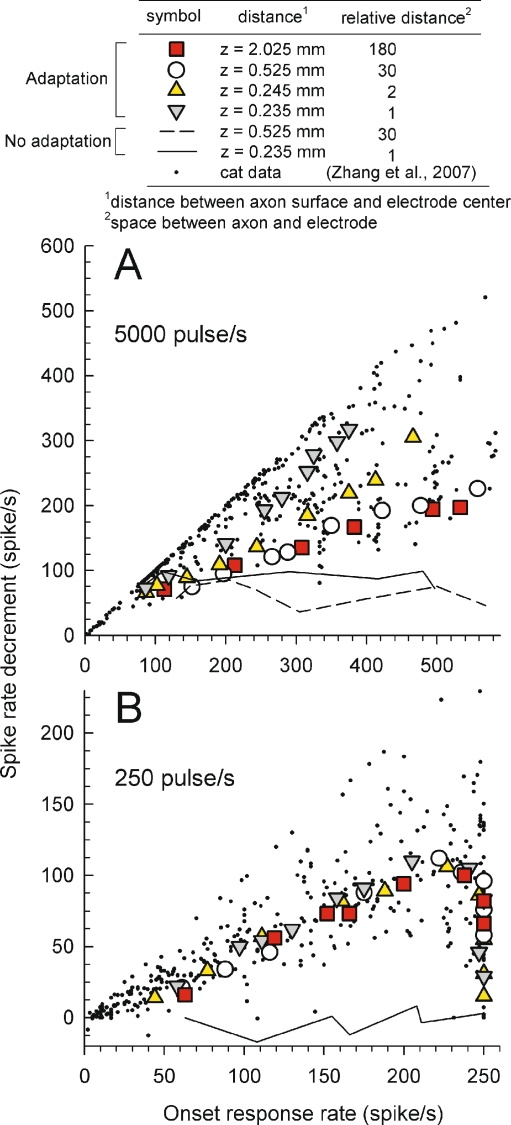
To systematically characterize adaptation, we computed across-train rate decrements, defined as the differences between the initial spike rate and the steady-state spike rate. Figure 7 plots rate decrements versus onset spike rate for four electrode distances ranging from 0.235 to 2.025 mm for both high-rate (panel A) and low-rate (panel B) pulse trains. For these data sets, the central axon diameter (Daxon) of the model was fixed at 2.3 mm. Also plotted as small dots are feline data from Zhang et al. (2007) and results obtained using the “no-adaptation” model variant (plotted using line segments). As was seen in the example PSTHs (Fig. 6, left column), the “no-adaptation” plots of Figure 7 indicate the spike-rate changes associated with short-term refractory effects, which are accounted for by HH computational models.
FIG. 7.
Characterization of rate adaptation across response rates indicates that modeled responses to 5,000 pulse/s trains (A) result in greater adaptation than do the 250 pulse/s trains (B), although axon-to-electrode distance produces an interaction. Spike-rate decrements from cat ANFs are plotted using dots and the line and dashed line plots indicate results obtained by the model with the adaptation component deactivated, essentially indicating a noise floor. Different symbols indicate data from the adaptation model for different electrode-to-fiber distances. The model axon diameter was fixed at 2.3 mm, and the electrode was positioned close to 9th active node.
Relative to the low-rate feline data (Fig. 7B), high-rate stimuli result that span a wider range, with much data indicating complete loss of responsiveness (no spikes) in the time epoch (200–300 ms) used to assess the “steady-state” condition for adaptation assessments of Zhang et al. (2007). Comparison of trends from the model for high- and low-rate pulse trains indicate that electrode-to-fiber distance influences the extent of adaptation for high-rate stimuli but not for low-rate stimuli. For modeled responses to 5,000 pulse/s trains, the “degree of adaptation” (the slope of each function of Fig. 7) increases as the electrode-to-fiber distance decreases. The distance variable may account for some of the across-fiber variability observed in cat data. As the cat auditory nerve demonstrates a range of axon diameters (Liberman and Oliver 1984) and our model shows a strong diameter effect, we conjecture that fiber diameter may account for the wide range of “real cat” rate adaptation. Another difference between the low- and high-rate data sets is seen as the onset rate is increased to its highest values. For 250 pulse/s trains, driving either real cat ANFs or the modeled fibers to high rates results in decreases in rate adaptation that are not observed for 5,000 pulse/s stimulation. Thus, the model correctly indicates that, for lower-rate stimuli, rate adaptation can be at least partially overcome by increasing the driven rate.
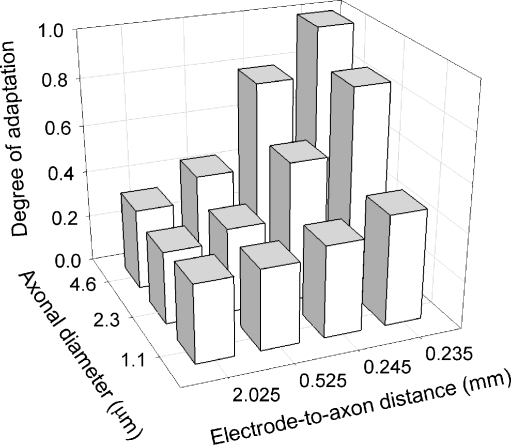
Linear regressions were performed for each Figure 7 data set produced by the model in order to quantify “degree of adaptation” (i.e., slope of each line), and additional simulations were run to determine this metric for three central-axon diameters: 1.1, 2.3, and 4.6 mm. Across all 12 conditions, the linear regressions had correlation coefficients of 0.92 or greater, with a mean r-value of 0.984. The “degree of adaptation” slopes for these axon diameters and for the four aforementioned electrode-to-axon distances are plotted in Figure 8. This data set indicates that the degree of adaptation increases as either electrode-to-axon distance decreases or axon diameter increases. The plot also indicates an interaction between the two independent variables. Note that neither independent axes of the 3-D plot uses linear scales; the greatest changes occur over relatively small changes in distance, particularly for the case of electrode-to-axon distance.
FIG. 8.
Summary of model sensitivity to rate adaptation with changes in axon diameter and electrode-to-axon distance. The degree of adaptation represents the slope of the linear regression computed for each data set of Figure 7. A “degree of adaptation” value of 1 corresponds to complete loss of spikes in the final, steady-state analysis window. Note the non-linear scale for the electrode-to-axon distance.
Effect of fiber curvature
While the model is based on an anatomically realistic cat ANF, we used a simple, homogeneous, representation of the extracellular space. It is beyond the scope of our current research program to develop a realistic model of cochlear tissues or a three-dimensional (finite-element) model of the cochlea. However, we undertook one spatial manipulation: adding curvature to a modeled ANF, to explore the effect that such a change could have on the excitability of its nodes. The motivation for this manipulation concerns the possibility that some ANFs can be excited at both peripheral and central nodes, depending upon the location of the stimulus electrode relative to the ANF, as was illustrated in Figure 3. In Figure 3A, the site of excitation could jump from peripheral (P2) to central (C1) sites with increasing stimulus level. Such level-dependent bimodality in the PSTH was observed in cat ANFs by our group (Miller et al. 1999). In that cat data, however, the inter-modal latencies (IML) ranged from 0.125 to 0.245 ms, larger values than what were produced by the model with a linear (straight) axon.
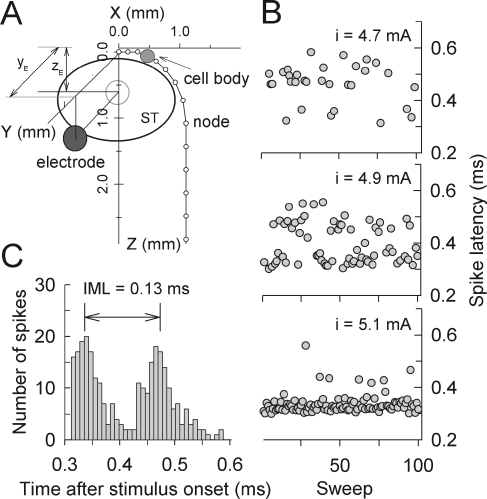
To investigate the effect of fiber curvature on latency and IML measures, we created an ANF with a curvature based on the dimensions and morphology of the basal turn of a cat cochlea (Shepherd et al. 1993). The monopolar stimulus electrode was positioned at the middle of scala tympani with the dimension of xE = 0.0, yE = 0.67, and zE = 0.85 mm. Levels were chosen to elicit FEs of 30%, 70%, and 99%. Figure 9A shows the spatial arrangement of the electrode and curved fiber while Figure 9B plots the spike latencies obtained across sweeps, which reveal a clear bimodality. Increasing stimulus level resulted in jumping of the site of excitation from the peripheral node, P2, to the central node, C6. The histogram of responses to the middle current level (i = 4.9 mA) is shown in Figure 9C. With this curved-ANF model, the IML at this level was 0.13 ms, which is greater than those obtained using the linear-axon model (Fig. 3) and within the range of animal data (Miller et al. 1999). If we assume a conduction velocity of 12 m/s and the average internodal length of 200 μm, a mean IML of 0.18 ms from cat ANFs may imply that the initiation site jumped across ten nodes. This demonstration indicates the importance of developing more sophisticated model features that include the three-dimensional properties of ANFs and the cochlea.
FIG. 9.
A Schematic representation of the curved axon-model according to Shepherd et al. (1993). A stimulus electrode is positioned at xE = 0.0, yE = 0.67, and zE = 0.85 mm in a homogeneous isotropic conducting medium (ρe = 0.3 kΩ cm). B Example of spike latency at three response levels (FE = 0.3, 0.7, and 0.99, respectively) using the conditions indicated in the diagram of panelA. The PSTH in response to 400 repeated single monophasic pulses at a level of 4.9 mA is plotted in panelC.
Discussion
Summary
We used a relatively simple mechanism based on changing external [K+] to create a model that predicts rate adaptation observed in cat ANFs under several stimulus conditions. It predicted responses to single-pulse, two-pulse, and pulse-train stimuli consistent with cat ANF data. Increases in initial driven rate could fully or partially overcome rate adaptation, and greater decrements were observed for higher pulse rates. For 5,000 pulse/s stimuli, electrode-to-membrane distance and model fiber diameter clearly affected rate adaptation, whereas distance and diameter were not critical to low-rate simulations. Real fibers (Zhang et al. 2007) also showed a relatively large range of rate adaptation for high-rate pulse trains. A parsimonious account of this pulse-rate effect could involve fiber diameter.
The model neglected the complex extra-neural spaces and assumed a homogeneous external medium; thus, it may not accurately predict population responses. However, it demonstrates proof of concept and how parameters of the stimulus and modeled fiber may alter responses. Such changes could be plausibly expected to occur with more spatially realistic conditions.
Relationships to findings from physiologic experiments
Influence of fiber diameter ANF models (Colombo and Parkins 1987; Finley et al. 1990; Frijns et al. 1996; Bruce et al. 1999) and experimental manipulations of ANFs (van den Honert and Stypulkowski 1984; Cartee et al. 2006) have shown how responses are influenced by mammalian ANF anatomy, surrounding tissues, and changes in electric stimulus fields. Our observed dependencies of ANF response patterns on level, pulse rates, fiber diameter, and electrode-to-fiber distance may occur in feline or human cochleae and influence perception of stimuli.Model results indicate that rate adaptation increases with increasing axon diameter (Fig. 8). While rate adaptation has been studied in response to acoustic (Smith 1977; Abbas 1984) and electric stimuli (Clay and Brown 2007; Miller et al. 2008), no reports describe the effect of diameter on electrically evoked responses with rate adaptation. Studies by Liberman (1982), Muller and Robertson (1991), and Gleich and Wilson (1993) indicate that larger-diameter ANFs are more susceptible to adaptation, consistent with our results. However, those data were obtained using acoustic stimuli, where additional biophysical processes could contribute to adaptation. For example, greater spontaneous activity of larger-diameter fibers could place them in “more adapted” states (Sumner et al. 2003). Mechanisms at the hair cell and synapse (Norris et al. 1977; Goutman and Glowatzki 2007) may confound the interpretation of our results, as our model only accounts for ANF membrane properties. Thus, extrapolation of results from acoustic studies is problematic, as it is not known to what degree those data are influenced by the additional mechanisms. On the other hand, as our feline and model data are dependent only on membrane mechanisms, our results could be useful for interpreting acoustically based data or refinement of acoustic-based models, which sometimes neglect membrane-induced adaptation.
Influence of electric threshold and sampling limitations Variation in the degree of adaptation was observed in cat data (Zhang et al. 2007). Zhang et al. (2007) showed that “strong adapters”, defined by normalized rate decrements of 0.9 or greater, have higher thresholds. We might conclude that greater rate adaptation is associated with smaller-diameter ANFs, particularly if we assume that diameter is dominant in determining electric threshold (van den Honert and Stypulkowski 1987a). This contrasts with our data (Fig. 8), which indicates greater adaptation for larger-diameter fibers.An explanation of this apparent discrepancy involves the limited sampling of ANF populations typical of animal-based experiments. With a computational model, we can exquisitely control electrode-to-fiber distance. With a three-dimensional cochlear model, one can examine any ANF along the cochlea's spiral. In contrast, cat experiments are severely limited by small statistical sampling of the nerve. A highly productive cat experiment focused on studying adaptation may yield data sets from 50 ANFs. This represents a sampling of about 1/1,000 of the afferent ANFs (Keithley and Schreiber 1987). Model conditions were purposefully manipulated to determine responses at “extreme conditions” so as to demonstrate response variations. For example, modeled large-diameter ANFs were excited by an electrode positioned relatively close to the fiber (e.g., Fig. 8), which revealed a relationship between adaptation and diameter. It is possible the limited sampling of feline neurons does not capture those conditions, as most cat fibers are more distant from an electrode. This sampling problem points to the value of developing a realistic three-dimensional computational model that accounts for cochlear tissues and fiber paths – something we hope to explore in future work.Computational models have emphasized different dimensions to address specific issues. For example, work from Frijns's group (Frijns et al. 1995; Frijns et al. 1996) often focuses on three-dimensional finite-element models to examine how the population is excited under various stimulus conditions. Others (Bruce et al. 1999; Mino and Rubinstein 2006) employed simple spatial models and focused on temporal or stochastic response properties. A comprehensive model using both three-dimensional cochlear representation and a sophisticated ANF simulation is still lacking. Thus, care is needed to properly interpret each model's results and place their various findings in proper perspective. Until a comprehensive model is achieved, it is difficult to assess the relative importance of each stimulus or model-parameter permutation.
Possible influences of model morphological parameters on simulated responses
Internodal length vs. myelin sheath diameter Internodal lengths were set from the mean value of moderate CF (800–3,000 Hz) neurons (Liberman and Oliver 1984). While anatomical data suggest that low- and medium-spontaneous rate (SR) ANFs have shorter internodes than high-SR fibers, the relationship between internodal length and diameter is not addressed here or elsewhere. A study based on measures of the rat's anterior medullary velum showed a broadly linear relationship, though with poorer correlation between diameter and internodal length (Ibrahim et al. 1995). Thus, we choose to use a single set of lengths independent of fiber diameter. This assumption clearly could be explored in population models.
Myelin sheath thickness and cell-body area In our model, the myelin thickness of peripheral and central axons was set at 1 μm, and the cell body had a 300-μm2 cross-section area. The myelin sheath thickness reportedly does not have a significant correlation with internodal length (Friede and Bischhausen 1982) or axonal circumference (Arnesen and Osen 1978). Liberman and Oliver (1984) suggested that cell-body area was not related to SR, which is correlated with fiber diameter. Therefore, both myelin thickness and cell-body area were fixed as fiber diameter was manipulated. Additional anatomical data may be needed to more strongly establish these relationships.
Axonal model parameters A critical parameter is the nodal density of Na channels, as it influences threshold, conduction velocity, RS, and stochastic properties. The densities of Na channels in unmyelinated fibers of rat cervical sympathetic trunk, rabbit vagus nerve, and rat sciatic myelinated fibers are 200, 110, and 630 /μm2, respectively (Ritchie et al. 1976; Neumcke and Stämpfli 1982). Unfortunately, the density for cat ANFs has not been reported. We chose a density of 80/μm2 to produce reasonable conduction velocity, RS, jitter, and ARP. Axonal parameters (internodal resistance and axoplasmic resistance) were optimized to produce plausible responses to single and paired pulses. Anatomical studies are needed to specify actual densities so that other model parameters would be better constrained. As things stand now, there are no unique model solutions and, different modeling groups sometimes focus on different parameters for optimization.
Future directions
The use of a simple, linear, modeled fiber within a homogeneous medium differs greatly from the real conditions of fibers embedded within various cochlear tissues and complex fiber curvatures. A significant improvement would be the use of three-dimensional finite-element approaches to simulate extra-neural tissue boundaries and the distribution and curvatures of ANFs within cochlear spaces. This would provide better simulations of fiber population responses, estimates of sites of excitation, and channel interactions. More realistic spatial models will likely affect the temporal responses of modeled ANFs through changes in sites and patterns of nodal depolarization.
While our relatively simple manipulation of [K+]ext produced good results, concurrent model efforts are examining the use of multiple types of K channels, such as slow K+ conductance and low-threshold K channels (Schwarz et al. 1995; Bruce and Negm 2009; Imennov and Rubinstein 2009). Models with greater channel specificity may be able to account for phenomena such as refractoriness, adaptation, and subthreshold adaptation (Miller et al. 2009; Bruce, personal communication) and result in better, more appropriate, parameter optimization. This is clearly a promising area for future research. Another challenge is identifying these channels in real feline ANFs or specifying feline channel conductances. Relative to the cat, more progress has been made describing the channels of rodents.
Computational models can greatly extend physiologically based data sets to novel stimuli. Clinical prostheses often use modulated pulse trains in which the carrier transmits auditory information. We propose to incorporate some or all of the aforementioned improvements to more accurately simulate a population of fibers. After refinements are made, a new experiment would include the use of modulated pulse trains to address clinical issues of stimulus representation. Such work could detail how features of speech stimuli are effectively encoded (or fail to be encoded) across a population of ANFs. By doing so, a sophisticated computational model could be used to help develop more efficient and effective speech processors and stimulation electrode arrays.
Acknowledgement
This research was supported by a grant from the NIH NIDCD (R01-DC006478). The authors acknowledge the work of the editor and two anonymous reviewers and Barbara Robinson for her comments on the manuscript.
Contributor Information
Jihwan Woo, Phone: +1-319-3537648, FAX: +1-319-3846761, Email: jihwan-woo@uiowa.edu.
Charles A. Miller, Phone: +1-319-3846758, FAX: +1-319-3846761, Email: charles-miller@uiowa.edu
Paul J. Abbas, Phone: +1-319-3358733, FAX: +1-319-3358851, Email: paul-abbas@uiowa.edu
References
- Abbas PJ. Recovering from long-term and short-term adaptation of the whole nerve action potential. J Acoust Soc Am. 1984;75:1541–1547. doi: 10.1121/1.390825. [DOI] [PubMed] [Google Scholar]
- Arnesen AR, Osen KK. The cochlear nerve in the cat: topography, cochleotopy, and fiber spectrum. J Comp Neurol. 1978;178:661–678. doi: 10.1002/cne.901780405. [DOI] [PubMed] [Google Scholar]
- Baylor DA, Nicholls JG. Changes in extracellular potassium concentration produced by neuronal activity in the central nervous system of the leech. J Physiol. 1969;203:555–569. doi: 10.1113/jphysiol.1969.sp008879. [DOI] [PMC free article] [PubMed] [Google Scholar]
- Bruce I, Negm M (2009) IKLT and Ih may explain rapid and short-term spike rate adaptation in auditory nerve fiber responses to cochlear implant stimulation. Assoc Res Otolaryngol, Baltimore, MA, Abstract: 965
- Bruce IC, White MW, Irlicht LS, O'Leary SJ, Dynes S, Javel E, Clark GM. A stochastic model of the electrically stimulated auditory nerve: single-pulse response. IEEE Trans Biomed Eng. 1999;46:617–629. doi: 10.1109/10.764938. [DOI] [PubMed] [Google Scholar]
- Bruce IC, Irlicht LS, White MW, O'Leary SJ, Clark GM. Renewal-process approximation of a stochastic threshold model for electrical neural stimulation. J Comput Neurosci. 2000;9:119–32. doi: 10.1023/A:1008942623671. [DOI] [PubMed] [Google Scholar]
- Cartee LA. Spiral ganglion cell site of excitation II: numerical model analysis. Hear Res. 2006;215:22–30. doi: 10.1016/j.heares.2006.02.011. [DOI] [PubMed] [Google Scholar]
- Cartee LA, Miller CA, Honert C. Spiral ganglion cell site of excitation I: comparison of scala tympani and intrameatal electrode responses. Hear Res. 2006;215:10–21. doi: 10.1016/j.heares.2006.02.012. [DOI] [PubMed] [Google Scholar]
- Chow CC, White JA. Spontaneous action potentials due to channel fluctuations. Biophys J. 1996;71:3013–3021. doi: 10.1016/S0006-3495(96)79494-8. [DOI] [PMC free article] [PubMed] [Google Scholar]
- Clay KM, Brown CJ. Adaptation of the electrically evoked compound action potential (ECAP) recorded from nucleus CI24 cochlear implant users. Ear Hear. 2007;28:850–861. doi: 10.1097/AUD.0b013e318157671f. [DOI] [PubMed] [Google Scholar]
- Clay JR, Defelice LJ. Relationship between membrane excitability and single channel open-close kinetics. Biophys J. 1983;42:151–157. doi: 10.1016/S0006-3495(83)84381-1. [DOI] [PMC free article] [PubMed] [Google Scholar]
- Colombo J, Parkins CW. A model of electrical excitation of the mammalian auditory-nerve neuron. Hear Res. 1987;31:287–311. doi: 10.1016/0378-5955(87)90197-3. [DOI] [PubMed] [Google Scholar]
- Finley CC, Wilson BS, White MW. Models of neural responsiveness to electrical stimulation. In: Miller JM, Spelman FA, editors. Cochlear implants: models of the electrically stimulated ear. New York: Springer-Verlag; 1990. pp. 55–93. [Google Scholar]
- Fox RF. Stochastic versions of the Hodgkin–Huxley equations. Biophys J. 1997;72:2068–2074. doi: 10.1016/S0006-3495(97)78850-7. [DOI] [PMC free article] [PubMed] [Google Scholar]
- Frankenhaeuser B, Hodgkin AL. The after-effects of impulses in the giant nerve fibres of Loligo. J Physiol. 1956;131:341–376. doi: 10.1113/jphysiol.1956.sp005467. [DOI] [PMC free article] [PubMed] [Google Scholar]
- Frankenhaeuser B, Huxley AF. The action potential in the myelinated nerve fibre of Xenopus laevis as computed on the basis of voltage clamp data. J Physiol. 1964;171:302–315. doi: 10.1113/jphysiol.1964.sp007378. [DOI] [PMC free article] [PubMed] [Google Scholar]
- Friede RL, Bischhausen R. How are sheath dimensions affected by axon caliber and internode length? Brain Res. 1982;235:335–350. doi: 10.1016/0006-8993(82)91012-5. [DOI] [PubMed] [Google Scholar]
- Frijns JH, Snoo SL, Schoonhoven R. Potential distributions and neural excitation patterns in a rotationally symmetric model of the electrically stimulated cochlea. Hear Res. 1995;87:170–186. doi: 10.1016/0378-5955(95)00090-Q. [DOI] [PubMed] [Google Scholar]
- Frijns JH, Snoo SL, Kate JH. Spatial selectivity in a rotationally symmetric model of the electrically stimulated cochlea. Hear Res. 1996;95:33–48. doi: 10.1016/0378-5955(96)00004-4. [DOI] [PubMed] [Google Scholar]
- Frijns JH, Briaire JJ, Grote JJ. The importance of human cochlear anatomy for the results of modiolus-hugging multichannel cochlear implants. Otol Neurotol. 2001;22:340–349. doi: 10.1097/00129492-200105000-00012. [DOI] [PubMed] [Google Scholar]
- Gillespie DT. Exact stochastic simulation of coupled chemical reactions. J Phys Chem. 1977;81:2340–2361. doi: 10.1021/j100540a008. [DOI] [Google Scholar]
- Gleich O, Wilson S. The diameters of guinea pig auditory nerve fibres: distribution and correlation with spontaneous rate. Hear Res. 1993;71:69–79. doi: 10.1016/0378-5955(93)90022-S. [DOI] [PubMed] [Google Scholar]
- Goutman JD, Glowatzki E. Time course and calcium dependence of transmitter release at a single ribbon synapse. Proc Natl Acad Sci USA. 2007;104:16341–16346. doi: 10.1073/pnas.0705756104. [DOI] [PMC free article] [PubMed] [Google Scholar]
- Hodgkin AL, Huxley AF. Currents carried by sodium and potassium ions through the membrane of the giant axon of Loligo. J Physiol. 1952;116:449–472. doi: 10.1113/jphysiol.1952.sp004717. [DOI] [PMC free article] [PubMed] [Google Scholar]
- Ibrahim M, Butt AM, Berry M. Relationship between myelin sheath diameter and internodal length in axons of the anterior medullary velum of the adult rat. J Neurol Sci. 1995;133:119–127. doi: 10.1016/0022-510X(95)00174-Z. [DOI] [PubMed] [Google Scholar]
- Imennov NS, Rubinstein JT. Stochastic population model for electrical stimulation of the auditory nerve. IEEE Trans Biomed Eng. 2009;56:2493–2501. doi: 10.1109/TBME.2009.2016667. [DOI] [PubMed] [Google Scholar]
- Javel E, Shepherd RK. Electrical stimulation of the auditory nerve. III. Response initiation sites and temporal fine structure. Hear Res. 2000;140:45–76. doi: 10.1016/S0378-5955(99)00186-0. [DOI] [PubMed] [Google Scholar]
- Javel E, Viemeister NF. Stochastic properties of cat auditory nerve responses to electric and acoustic stimuli and application to intensity discrimination. J Acoust Soc Am. 2000;107:908–921. doi: 10.1121/1.428269. [DOI] [PubMed] [Google Scholar]
- Keithley EM, Schreiber RC. Frequency map of the spiral ganglion in the cat. J Acoust Soc Am. 1987;81:1036–1042. doi: 10.1121/1.394675. [DOI] [PubMed] [Google Scholar]
- Liberman MC. Single-neuron labeling in the cat auditory nerve. Science. 1982;216:1239–1241. doi: 10.1126/science.7079757. [DOI] [PubMed] [Google Scholar]
- Liberman MC, Oliver ME. Morphometry of intracellularly labeled neurons of the auditory nerve: correlations with functional properties. J Comp Neurol. 1984;223:163–176. doi: 10.1002/cne.902230203. [DOI] [PubMed] [Google Scholar]
- Massacrier A, Couraud F, Cau P. Voltage-sensitive Na+ channels in mammalian peripheral nerves detected using scorpion toxins. J Neurocytol. 1990;19:850–872. doi: 10.1007/BF01186815. [DOI] [PubMed] [Google Scholar]
- Matsuoka AJ, Rubinstein JT, Abbas PJ, Miller CA. The effects of interpulse interval on stochastic properties of electrical stimulation: models and measurements. IEEE Trans Biomed Eng. 2001;48:416–424. doi: 10.1109/10.915706. [DOI] [PubMed] [Google Scholar]
- McNeal DR. Analysis of a model for excitation of myelinated nerve. IEEE Trans Biomed Eng. 1976;23:329–337. doi: 10.1109/TBME.1976.324593. [DOI] [PubMed] [Google Scholar]
- Miller CA, Abbas PJ, Robinson BK, Rubinstein JT, Matsuoka AJ. Electrically evoked single-fiber action potentials from cat: responses to monopolar, monophasic stimulation. Hear Res. 1999;130:197–218. doi: 10.1016/S0378-5955(99)00012-X. [DOI] [PubMed] [Google Scholar]
- Miller CA, Abbas PJ, Robinson BK. Response properties of the refractory auditory nerve fiber. J Assoc Res Otolaryngol. 2001;2:216–232. doi: 10.1007/s101620010083. [DOI] [PMC free article] [PubMed] [Google Scholar]
- Miller CA, Abbas PJ, Nourski KV, Hu N, Robinson BK. Electrode configuration influences action potential initiation site and ensemble stochastic response properties. Hear Res. 2003;175:200–214. doi: 10.1016/S0378-5955(02)00739-6. [DOI] [PubMed] [Google Scholar]
- Miller CA, Robinson BK, Hetke JF, Abbas PJ, Nourski KV. Feasibility of using silicon-substrate recording electrodes within the auditory nerve. Hear Res. 2004;198:48–58. doi: 10.1016/j.heares.2004.07.009. [DOI] [PubMed] [Google Scholar]
- Miller CA, Hu N, Zhang F, Robinson BK, Abbas PJ. Changes across time in the temporal responses of auditory nerve fibers stimulated by electric pulse trains. J Assoc Res Otolaryngol. 2008;9:122–137. doi: 10.1007/s10162-007-0108-5. [DOI] [PMC free article] [PubMed] [Google Scholar]
- Miller CA, Hu N, Woo J, Abbas PJ, Robinson BK (2009) Sub-threshold electric stimuli can enhance or reduce auditory nreve responsiveness. Assoc Res Otolaryngol, Baltimore, MA, Abstract: 966
- Mino H, Rubinstein JT. Effects of neural refractoriness on spatio-temporal variability in spike initiations with electrical stimulation. IEEE Trans Rehabil Eng. 2006;14:273–280. doi: 10.1109/TNSRE.2006.881590. [DOI] [PubMed] [Google Scholar]
- Mino H, Rubinstein JT, White JA. Comparison of algorithms for the simulation of action potentials with stochastic sodium channels. Ann Biomed Eng. 2002;30:578–587. doi: 10.1114/1.1475343. [DOI] [PubMed] [Google Scholar]
- Mino H, Rubinstein JT, Miller CA, Abbas PJ. Effects of electrode-to-fiber distance on temporal neural response with electrical stimulation. IEEE Trans Biomed Eng. 2004;51:13–20. doi: 10.1109/TBME.2003.820383. [DOI] [PubMed] [Google Scholar]
- Muller M, Robertson D. Relationship between tone burst discharge pattern and spontaneous firing rate of auditory nerve fibres in the guinea pig. Hear Res. 1991;57:63–70. doi: 10.1016/0378-5955(91)90075-K. [DOI] [PubMed] [Google Scholar]
- Neumcke B, Stämpfli R. Sodium currents and sodium-current fluctuations in rat myelinated nerve fibres. J Physiol. 1982;329:163–184. doi: 10.1113/jphysiol.1982.sp014296. [DOI] [PMC free article] [PubMed] [Google Scholar]
- Nguyen BH, Javel E, Levine SC. Physiologic identification of eighth nerve subdivisions: direct recordings with bipolar and monopolar electrodes. Am J Otol. 1999;20:522–534. [PubMed] [Google Scholar]
- Norris CH, Guth PS, Daigneault EA. The site at which peripheral auditory adaptation occurs. Brain Res. 1977;123:176–179. doi: 10.1016/0006-8993(77)90653-9. [DOI] [PubMed] [Google Scholar]
- Parkins CW. Temporal response patterns of auditory nerve fibers to electrical stimulation in deafened squirrel monkeys. Hear Res. 1989;41:137–168. doi: 10.1016/0378-5955(89)90007-5. [DOI] [PubMed] [Google Scholar]
- Rattay F, Aberham M. Modeling axon membranes for functional electrical stimulation. IEEE Trans Biomed Eng. 1993;40:1201–1209. doi: 10.1109/10.250575. [DOI] [PubMed] [Google Scholar]
- Rattay F, Lutter P, Felix H. A model of the electrically excited human cochlear neuron. I. Contribution of neural substructures to the generation and propagation of spikes. Hear Res. 2001;153:43–63. doi: 10.1016/S0378-5955(00)00256-2. [DOI] [PubMed] [Google Scholar]
- Rhode WS, Smith PH. Characteristics of tone-pip response patterns in relationship to spontaneous rate in cat auditory nerve fibers. Hear Res. 1985;18:159–168. doi: 10.1016/0378-5955(85)90008-5. [DOI] [PubMed] [Google Scholar]
- Ritchie JM, Rogart RB, Strichartz GR. A new method for labelling saxitoxin and its binding to non-myelinated fibres of the rabbit vagus, lobster walking leg, and garfish olfactory nerves. J Physiol. 1976;261:477–494. doi: 10.1113/jphysiol.1976.sp011569. [DOI] [PMC free article] [PubMed] [Google Scholar]
- Rubinstein JT. Threshold fluctuations in an N sodium channel model of the node of Ranvier. Biophys J. 1995;68:779–785. doi: 10.1016/S0006-3495(95)80252-3. [DOI] [PMC free article] [PubMed] [Google Scholar]
- Rubinstein JT, Wilson BS, Finley CC, Abbas PJ. Pseudospontaneous activity: stochastic independence of auditory nerve fibers with electrical stimulation. Hear Res. 1999;127:108–118. doi: 10.1016/S0378-5955(98)00185-3. [DOI] [PubMed] [Google Scholar]
- Schwarz JR, Eikhof G. Na currents and action potentials in rat myelinated nerve fibres at 20 and 37°C. Pflügers Arch. 1987;409:569–577. doi: 10.1007/BF00584655. [DOI] [PubMed] [Google Scholar]
- Schwarz JR, Reid G, Bostock H. Action potentials and membrane currents in the human node of Ranvier. Pflügers Arch. 1995;430:283–292. doi: 10.1007/BF00374660. [DOI] [PubMed] [Google Scholar]
- Shepherd RK, Hatsushika S, Clark GM. Electrical stimulation of the auditory nerve: the effect of electrode position on neural excitation. Hear Res. 1993;66:108–120. doi: 10.1016/0378-5955(93)90265-3. [DOI] [PubMed] [Google Scholar]
- Smith RL. Short-term adaptation in single auditory nerve fibers: some poststimulatory effects. J Neurophysiol. 1977;40:1098–1111. doi: 10.1152/jn.1977.40.5.1098. [DOI] [PubMed] [Google Scholar]
- Spach MS, Kootsey JM. Relating the sodium current and conductance to the shape of transmembrane and extracellular potentials by simulation: effects of propagation boundaries. IEEE Trans Biomed Eng. 1985;32:743–755. doi: 10.1109/TBME.1985.325489. [DOI] [PubMed] [Google Scholar]
- Sumner CJ, Lopez-Poveda EA, O'Mard LP, Meddis R. Adaptation in a revised inner-hair cell model. J Acoust Soc Am. 2003;113:893–901. doi: 10.1121/1.1515777. [DOI] [PubMed] [Google Scholar]
- Tasaki I. New measurements of the capacity and the resistance of the myelin sheath and the nodal membrane of the isolated frog nerve fiber. Am J Physiol. 1955;181:639–650. doi: 10.1152/ajplegacy.1955.181.3.639. [DOI] [PubMed] [Google Scholar]
- Honert C, Stypulkowski PH. Physiological properties of the electrically stimulated auditory nerve. II. Single fiber recordings. Hear Res. 1984;14:225–243. doi: 10.1016/0378-5955(84)90052-2. [DOI] [PubMed] [Google Scholar]
- Honert C, Stypulkowski PH. Single fiber mapping of spatial excitation patterns in the electrically stimulated auditory nerve. Hear Res. 1987;29:195–206. doi: 10.1016/0378-5955(87)90167-5. [DOI] [PubMed] [Google Scholar]
- Honert C, Stypulkowski PH. Temporal response patterns of single auditory nerve fibers elicited by periodic electrical stimuli. Hear Res. 1987;29:207–222. doi: 10.1016/0378-5955(87)90168-7. [DOI] [PubMed] [Google Scholar]
- Verveen AA. Fluctuation in excitability. Amsterdam: Drukkerij Holland NV; 1961. [Google Scholar]
- Woo J, Miller CA, Abbas PJ. Simulation of the electrically stimulated cochlear neuron: modeling adaptation to trains of electric pulses. IEEE Trans Biomed Eng. 2009;56:1348–1359. doi: 10.1109/TBME.2009.2023978. [DOI] [PubMed] [Google Scholar]
- Woo J, Miller CA, Abbas PJ. Biophysical model of an auditory nerve fiber with novel adaptation component. IEEE Trans Biomed Eng. 2009;56:2177–2180. doi: 10.1109/TBME.2009.2023978. [DOI] [PubMed] [Google Scholar]
- Zhang F, Miller CA, Robinson BK, Abbas PJ, Hu N. Changes across time in spike rate and spike amplitude of auditory nerve fibers stimulated by electric pulse trains. J Assoc Res Otolaryngol. 2007;8:356–372. doi: 10.1007/s10162-007-0086-7. [DOI] [PMC free article] [PubMed] [Google Scholar]


