

Abstract
Cell differentiation is an orderly process that begins with modifications in gene expression. This process is regulated by the acetylation state of histones. Removal of the acetyl groups of histones by specific enzymes (histone deacetylases, HDAC) usually downregulates expression of genes that can cause cells to differentiate, and pharmacological inhibitors of these enzymes have been shown to induce differentiation in several colon cancer cell lines. Butyrate at high (mM) concentration is both a precursor for acetyl-CoA and a known HDAC inhibitor that induces cell differentiation in colon cells. The dual role of butyrate raises the question whether its effects on HT29 cell differentiation are due to butyrate metabolism or to its HDAC inhibitor activity. To distinguish between these two possibilities, we used a tracer-based metabolomics approach to compare the metabolic changes induced by two different types of HDAC inhibitors (butyrate and the non-metabolic agent trichostatin A) and those induced by other acetyl-CoA precursors that do not inhibit HDAC (caprylic and capric acids). [1,2-13C2]-d-glucose was used as a tracer and its redistribution among metabolic intermediates was measured to estimate the contribution of glycolysis, the pentose phosphate pathway and the Krebs cycle to the metabolic profile of HT29 cells under the different treatments. The results demonstrate that both HDAC inhibitors (trichostatin A and butyrate) induce a common metabolic profile that is associated with histone deacetylase inhibition and differentiation of HT29 cells whereas the metabolic effects of acetyl-CoA precursors are different from those of butyrate. The experimental findings support the concept of crosstalk between metabolic and cell signalling events, and provide an experimental approach for the rational design of new combined therapies that exploit the potential synergism between metabolic adaptation and cell differentiation processes through modification of HDAC activity.
Keywords: Butyrate, Cell differentiation, Histone deacetylase, Medium chain fatty acids, Metabolism, Trichostatin A
Introduction
Histone deacetylases (HDAC) belong to a class of enzymes that remove acetyl groups from lysine residues of histones and regulate the affinity of protein transcription complexes for DNA (de Ruijter et al. 2003). Genes that can cause cell differentiation are normally downregulated by HDAC activity. However, HDACs are involved in controlling other living processes, such as signal transduction, cell growth, the cell cycle and cancer progression (Mariadason 2008; Martin et al. 2007).
Several groups of compounds with different chemical properties are known HDAC inhibitors (HDI) (Siavoshian et al. 2000; Villar-Garea and Esteller 2004). These include short chain fatty acids, hydroxamic acids and benzamides. Short chain fatty acids (SCFA) are end products of bacterial fermentation in the human large intestine. Butyrate is a four-carbon SCFA which is a major fuel of colonocytes (Roediger 1982). In addition to its metabolic effect in reducing glucose oxidation, it regulates cell proliferation and induces apoptosis and cell differentiation in several colon cancer cell lines (Heerdt et al. 1994; Litvak et al. 1998; Marks and Xu 2009). Butyrate has been shown to activate cyclin D3 and p21, and cause cell-cycle arrest in the G1 phase (Siavoshian et al. 2000). Moreover, it has been reported that butyrate affects the genetic profile of pathways involved in cell growth, apoptosis and oxidative metabolism (Smith and Workman 2009), and it also has a direct effect on glucose metabolism. Regarding its metabolic effects, it has been reported that butyrate reduces both glucose consumption and lactate production while increasing de novo fatty acid synthesis from butyrate carbons and inhibiting ribose synthesis (Boren et al. 2003). Since these effects have been observed in the mM range of butyrate concentrations, it has not been possible to discriminate in which extension the metabolic changes observed are due to butyrate’s HDAC inhibitory effect or as a consequence of its metabolism. The capacity of butyrate to induce differentiation has led to the use of this compound, its derivatives and other HDI in clinical trials for treating cancers (Perrine et al. 2007; Villar-Garea and Esteller 2004). Other HDI, like trichostatin A (TSA) and suberoylanilide hydroxamic acid (SAHA), are non-metabolic compounds acting at nM range and have also been reported to induce cell differentiation, even though their effects at metabolic level have not been characterized (Dangond and Gullans 1998; Munster et al. 2001; Woo et al. 2007).
In order to distinguish between the metabolic changes associated with HDI activity and cell differentiation, and those associated with butyrate effects as metabolic precursor, we compared the metabolic profile induced by (1) TSA (acting at nM range), (2) butyrate (acting at mM range) and (3) caprylic and capric acids (fatty acids precursors of acetyl-CoA as butyrate but that do not inhibit HDAC). This metabolic characterization will allow us to identify the metabolic adaptations associated to butyrate induced cell differentiation, which can be exploited in a new combined therapy to enhance cancer cell differentiation or apoptosis.
Materials and methods
Chemicals
All chemicals were purchased from Sigma-Aldrich Co (St Louis, MO, USA), unless otherwise specified. Dulbecco’s Modified Eagle’s Medium (DMEM) and antibiotics (10,000 U/ml penicillin, 10,000 μg/ml streptomycin) were obtained from Gibco-BRL (Eggenstein, Germany), foetal calf serum (FCS) and trypsin-EDTA solution C (0.05% trypsin-0.02% EDTA) from Invitrogen (Paisley, UK). Annexin V/FITC kit was purchased from Bender System (Vienna, Austria), stable [1,2-13C2]-d-glucose and U-13C4-butyrate isotopes were obtained with >99% purity and 99% isotope enrichment for each position from Isotec Inc. (Miamisburg, OH). RNase was obtained from Roche Diagnostics (Mannheim, Germany).
Cell culture
Human colorectal adenocarcinoma HT29 cells (obtained from the American Type Culture Collection, HTB-38) were used in all the experiments. HT29 cells were grown as a monolayer culture in minimum essential medium (DMEM with l-glutamine, without glucose and without sodium pyruvate) in the presence of 10% heat-inactivated fetal calf serum, 10 mM of d-glucose and 0.1% streptomycin/penicillin in standard culture conditions.
Cell cultures were started with the same cell number (3 × 10⁵), which was achieved by using standard cell counting techniques. At the end of the experiment, the final cell number were also measured. Seventy-two hours after seeding, cell medium was removed and fresh supplemented DMEM was added. TSA or fatty acids (FA) were added to the cells at their 72 h-IC20 concentrations described in Sect. 3. Cells were harvested 72 h after treatment. In the case of GC/MS studies, two separate experiments were performed: (1) to study the effect of different treatments on glucose metabolism, cells were incubated with [1,2-13C2]-d-glucose (50% isotope enrichment) and the corresponding treatments; and (2) when the metabolism of butyrate itself was studied, the cultured cells were incubated with unlabeled glucose but with the 72 h-IC20 of U-13C4-butyrate (100% isotope enrichment) and caprylic or capric acid as indicated.
Cell proliferation assay
The assay was performed by a variation of the method described by Mosmann (Mosmann 1983) as specified in (Matito et al. 2003). Briefly, 2.5 × 10³ HT29 cells/well were cultured in 96 well plates. Concentrations that inhibited cell growth by 50% (IC50) and 20% (IC20) after 72 h of treatment were calculated based on the survival rate compared with untreated cells. Relative cell viability was measured by the absorbance on an ELISA plate reader (Tecan Sunrise MR20-301, TECAN, Salzburg, Austria) at 550 nm.
Alkaline phosphatase activity
Alkaline phosphatase activity was measured according to the published procedures (Bergmeyer 1985). Alkaline phosphatase (AP) was expressed as nmol of substrate converted per min and per mg of protein (mU × mg−1). Protein concentration of cell extracts was determined using the BCA Protein Assay (Pierce Biotechnology, Rockford, IL) to calculate the specific activity of the AP enzyme.
Cell cycle analysis
The cell cycle was analyzed by using a fluorescence-activated cell sorter (FACS) at 488 nm in an Epics XL flow cytometer (Coulter Corporation, Hialeah, FL, USA) as described elsewhere (Matito et al. 2003). For this assay, 7.5 × 10⁴ HT29 cells/well were plated in 6 well plates with 2 ml of medium. After 72 h, MCFA were added and the cells were incubated for another 72 h. MCFA doses used were their respective IC20 and IC50 values. All experiments were performed five times with three replicates per experiment.
Apoptosis assay
Cells were treated as described in Sect. 2.5. After centrifugation, cells were washed in binding buffer (10 mM Hepes pH 7.4, 140 mM sodium chloride, 2.5 mM calcium chloride) and resuspended in the same buffer. Annexin V-FITC was added according to the Annexin V-FITC kit. Following 30 min of incubation at room temperature and in darkness, propidium iodide (PI) was added 1 min before FACS analysis at 20 μg × ml−1. Experiments were performed in triplicate. In each experiment, approximately 20 × 103 cells were analyzed.
Glucose and lactate quantification
The levels of glucose and lactate in medium were measured spectrophotometrically. Glucose concentration was measured using a Cobas Mira chemistry analyzer (Roche Applied Science). Lactate concentration was measured on an ELISA plate reader (Tecan Sunrise MR20-301, TECAN).
To measure lactate by GC/MS, this metabolite was extracted from the cell culture medium by ethyl acetate after acidification with HCl and derivatized to its propylamideheptafluorobutyric form. The m/z 328 (carbons 1–3 of lactate, CI) was monitored for the detection of m0 (unlabeled species), m1 (lactate with one 13C atom, obtained when recycled through the pentose phosphate pathway, PPP) and m2 (lactate with two 13C atom, produced directly by glycolysis) (Lee et al. 1998). Glycolytic rate was calculated as m2lactate/(m2glucose/2).
RNA ribose extraction and isotopomer distribution analysis
RNA ribose was isolated by acid hydrolysis of cellular RNA after Trizol (Invitrogen) purification of cell extracts. Ribose isolated from RNA was derivatized to its aldonitrile acetate form using hydroxyl-amine in pyridine and acetic anhydride. The ion cluster around the m/z 256 (carbons 1–5 of ribose, CI) was monitored (Lee et al. 1998). The oxidative versus nonoxidative ratio was measured as ox/nonox = (m1 + m3)/(m2 + m3 + 2 × m4), since m1 and m3 need the oxidative branch to be formed, whereas m2, m3 and m4 species require the nonoxidative branch (twice in m4).
Glutamate isolation and isotopomer distribution analysis
Glutamate was separated from the cell medium using ion-exchange chromatography (Katz et al. 1989). Glutamate was converted to its n-trifluoroacetyl-n-butyl derivative and the ion clusters m/z 198 (carbons 2–5 of glutamate, EI) and m/z 152 (carbons 2–4 of glutamate, EI) were monitored. Pyruvate dehydrogenase activity relative to β-oxidation (m2 C4–C5) was calculated by subtracting m2 of m/z 152 (glutamate fragment C2–C4) from m2 of m/z 198 (glutamate fragment C2–C5) (Lee 1996).
Gas chromatography/mass spectrometry
Mass spectral data were obtained on a GCMS-QP2010 selective detector connected to a GC-2010 gas chromatograph from Shimadzu. The settings were as follows: GC inlet 250°C (200°C for lactate measurement), transfer line 280°C, MS Quad 150°C. A DB-5MS capillary column (30 m length, 250 μm diameter and 0.25 μm film thickness) was used for the analysis of ribose, glutamate, and lactate.
Data analysis and statistical methods
In vitro experiments were carried out using three cultures each time for each treatment and then repeated twice. Mass spectral analyses were carried out by three independent automatic injections of 1 μl of each sample by the automatic sampler and were accepted only if the standard sample deviation was less than 1% of the normalized peak intensity. Statistical analyses were performed using the parametric unpaired, two-tailed independent sample t test with 99% confidence intervals. P < 0.01 (*) was considered to indicate significant differences in glucose carbon metabolism in HT29 cell cultures treated with the different FA or TSA.
Results
Effect of MCFA and TSA on cell proliferation
Figure 1 shows the effect on cell proliferation of different fatty acids alone or in combination with butyrate. From these graphs, an IC20 and an IC50 were obtained for each individual treatment (butyrate –NaB–, caprylic and capric acids). The IC20 of caprylic acid (2.25 mM) and NaB (3 mM) were similar. However, capric acid (0.4 mM) presented an IC20 that was almost 10-fold lower. An IC50 of 5 mM, 2.75 mM and 0.5 mM were found for NaB, caprylic and capric treatments, respectively. An IC20 of 180 nM was obtained for the TSA treatment (data not shown). In combined treatments, a constant dose of 3 mM NaB was used, while increasing doses of caprylic and capric acid were added. The graphs show an increase in cell proliferation when the cells were treated with low concentrations of caprylic and capric acids. This effect was not observed in combined treatments of these MCFA with NaB. Moreover, the presence of NaB did not alter significantly the IC20 found for caprylic and capric acids, and an additive effect was observed after treating the cells with NaB and caprylic, but not with NaB and capric.
Fig. 1.
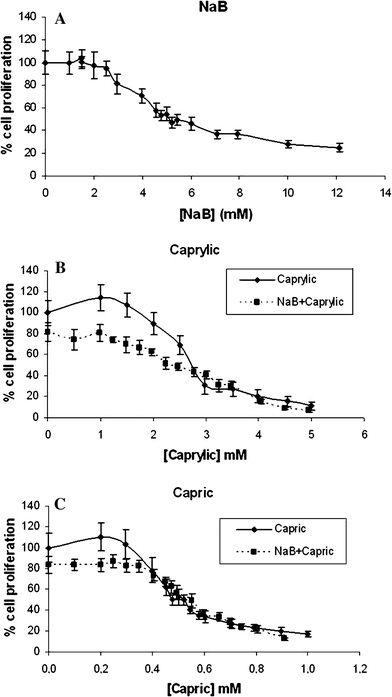
Antiproliferative effect of NaB (a), caprylic (b) and capric acids (c). In combined treatments, a constant dose of 3 mM NaB was used while increasing doses of caprylic and capric were added. Results are normalized by the untreated control
In the following experiments, an IC20 of each compound was used unless specified. A concentration of 0.4 mM for the caprylic treatment was also used in metabolomic studies, to avoid the dilution effects of caprylic treatments. When treatments were carried out in combination with NaB in metabolomic studies, an IC20 of each compound (NaB and caprylic or capric acids) was used.
Effect of MCFA on cell cycle and apoptosis
The effects of the different FA on cell cycle and apoptosis were studied at their respective IC50. The obtained results (Fig. 2a) showed that not all treatments generated the same cell cycle profile. NaB and caprylic acid treatment induced a cell cycle arrest in the G1 phase. However, the effect with caprylic acid treatment was less pronounced, as the S phase of the cell cycle was not as affected as it was in the NaB treatment. The mixed treatments induced a noticeable arrest in the G1 phase of the cycle, in the same way as the NaB treatment alone.
Fig. 2.
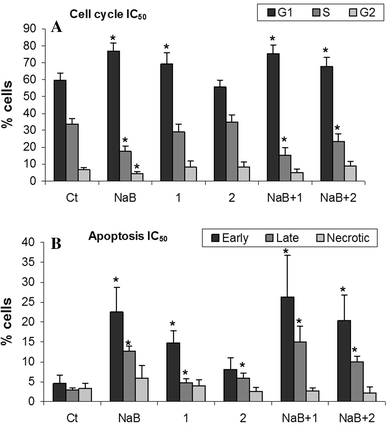
Percentage of cells in a each cell cycle phase and b early/late apoptosis or necrotic state under the different fatty acid treatments. The IC50 of each fatty acid was used. Ct: Control; NaB: Butyrate; 1: Caprylic; 2: Capric. P < 0.01 (*) was considered to indicate significant differences in percentages compared to the control
All the treatments were associated with a significant increase in apoptosis (Fig. 2b), although necrosis levels did not increase. In the mixed treatments, the effect of the different MCFA on apoptosis was more prominent for caprylic acid, according to the additive effects seen in cell proliferation.
Effect of MCFA on cell differentiation
Morphological changes associated with cell differentiation were evaluated by optical microscopy and the activity of the alkaline phosphatase (AP) enzyme was also determined as a marker of cell differentiation. NaB was the only MCFA agent that induced differentiation; treatment with the other fatty acids did not produce this effect (Fig. 3). A slight AP increase was observed in treatments combined with NaB, due to the presence of butyrate. Cells treated with TSA showed the characteristic morphology of differentiated cells and a very slight increase in AP respect to the control (data not shown), as described in the literature (Siavoshian et al. 2000).
Fig. 3.
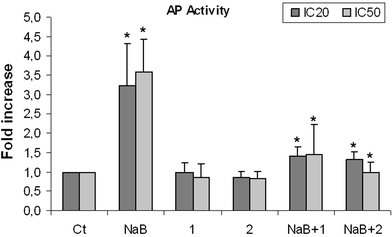
Alkaline phosphatase activity induced by the different treatments at their IC20 and IC50 doses. An arbitrary value of 1 was assigned to the controls. Treatments are shown as the value per one with respect to the control. Ct: Control; NaB: Butyrate; 1: Caprylic; 2: Capric. P < 0.01 (*) was considered to indicate significant differences of the treatments compared to the corresponding control
Effect of MCFA and TSA on glucose metabolism
Glucose consumption decreased in both NaB and TSA treatments, but not in the other fatty acids treatments. Similarly, lactate production only decreased after NaB and TSA treatments (Fig. 4a). These results indicate a reduction in the glycolytic flux in differentiating HT29 cells.
Fig. 4.
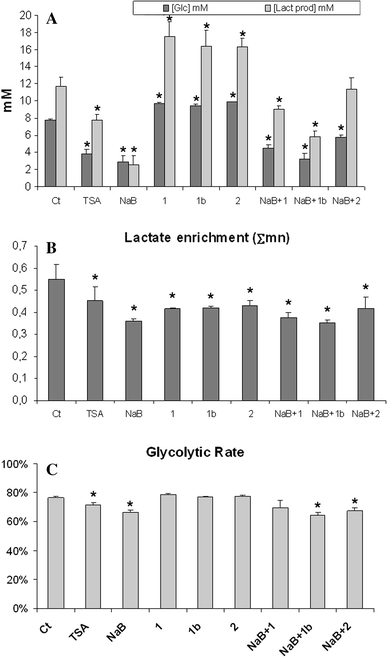
a Determination of glucose consumption and lactate production under the different treatments at their respective IC20. b Total 13C lactate enrichment from labeled glucose of the different treatments was calculated as Σmn = m1 + 2 × m2 + 3 × m3. c Glycolytic rate expressed as m2lactate/(m2glucose/2). m2glucose represented 48.08% of total glucose.Ct: Control; NaB: Butyrate; TSA: Trichostatin A; 1: Caprylic; 1b: Caprylic 0.4 mM; 2: Capric. P < 0.01 (*) was considered to indicate significant differences
When HT29 cells were incubated with [1,2-13C2]-d-glucose, all the treatments reduced the total label incorporation into lactate (Fig. 4b). Interestingly, although all the treatments reduced m1 lactate (data not shown), only NaB and TSA decreased the direct glycolysis as it is deduced from the lower glycolytic rate (Fig. 4c).
To find the molar enrichment and positional distribution of 13C labels in ribose, the major isotopomers of ribose were studied: m1 ribose (formed when [1,2-13C2]-d-glucose is decarboxylated by the oxidative branch of the PPP) and m2 ribose (synthesized by the reversible nonoxidative branch of the cycle). NaB and TSA treatments resulted in a decrease in the m1 ribose isotopomer (Fig. 5a), which indicates a decrease in the use of the oxidative branch of the PPP. Similarly, the oxidative/nonoxidative ratio of PPP that was estimated according to Ramos-Montoya and colleagues (Ramos-Montoya et al. 2006), was also significantly lower for NaB and TSA than for the control (Fig. 5b). This ratio has been reported to increase in tumor cells vs. normal cells.
Fig. 5.
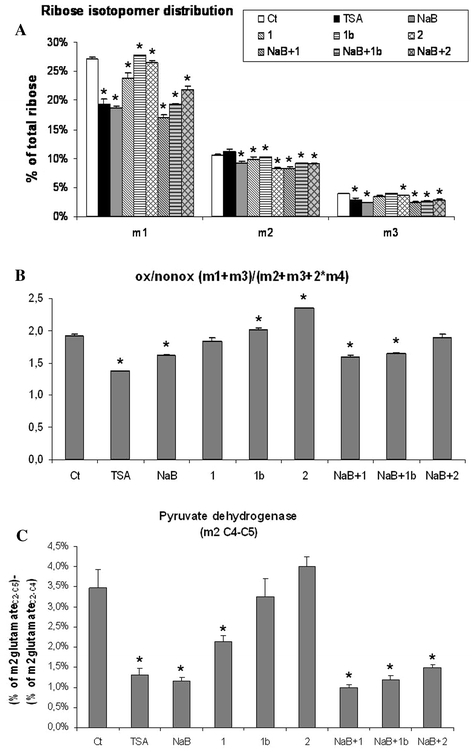
RNA ribose isotopomer distribution of 13C enrichment under the different treatments, expressed as % of total ribose (a). In b, the contribution of oxidative vs. nonoxidative branches of PPP was calculated from the isotopomeric distribution as ox/nonox = (m1 + m3)/(m2 + m3 + 2 × m4). c Pyruvate dehydrogenase contribution under the different treatments expressed as m2 of C4–C5 carbons of glutamate obtained from labeled glucose (% of total glutamate). Pyruvate dehydrogenase activity relative to β-oxidation (m2 C4–C5) was calculated by subtracting the m2 of m/z 152 (glutamate fragment C2–C4) from the m2 of m/z 198 (glutamate fragment C2–C5). Ct: Control; NaB: Butyrate; TSA: Trichostatin A; 1: Caprylic; 1b: Caprylic 0.4 mM; 2: Capric. P < 0.01 (*) was considered to indicate significant differences
Krebs cycle activity was studied by means of glutamate enrichment and isotopomer distribution analysis. The pyruvate dehydrogenase (PDH) contribution was markedly lower in NaB and TSA treatments, slightly lower in the caprylic treatment and was not affected in the capric treatment (Fig. 5c). This result suggests that the effect of NaB was not due to its metabolization but to the differentiation process, as TSA treatment had the same effect.
Effect of MCFA on butyrate metabolism
The contribution of butyrate carbons to the Krebs cycle was assessed, as this compound can be oxidized to obtain two molecules of acetyl-CoA. For this purpose, HT29 cells were incubated with U-13C4-butyrate and the glutamate isotopomers were determined. The results show that the different fatty acids combined with NaB did not change butyrate metabolization (Fig. 6). Only the IC20 of caprylic acid slightly diluted the label of glutamate from butyrate. This could be explained by the high amount of carbons provided by caprylic metabolization, as its concentration was almost 6 times higher than with capric acid.
Fig. 6.
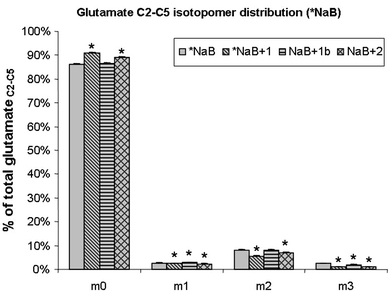
Measure of β-oxidation of butyrate: glutamate isotopomer distribution under the conditions containing U-13C4-butyrate as a tracer (% of total glutamate). Ct: Control; NaB: Butyrate; 1: Caprylic; 1b: Caprylic 0.4 mM; 2: Capric. P < 0.01 (*) was considered to indicate significant differences
Discussion
A popular hypothesis of carcinogenesis is the clonogenic expansion of cancer stem cells, which possess characteristics of “undifferentiated” cells. Cell differentiation is a process by which an undifferentiated cell becomes more specialized and less invasive. The biochemical process that induces cell differentiation is currently considered as a viable cancer treatment modality. The differentiation process is highly organized and depends on specific modifications in gene expression. The acetylation of histones is one of the most important mechanisms of gene regulation (Csordas 1990). This modulation is achieved by the action of histone acetyltransferases (HAT) and HDAC, enzymes that transfer and remove acetyl groups from histones respectively. Inhibition of histone deacetylases with HDAC inhibitors (HDI) to increase histone acetylation and to induce cell differentiation is potentially an effective therapeutic strategy for cancer treatment. In recent years, clinical trials with HDI have been performed with promising results (Kelly et al. 2002; Kouraklis and Theocharis 2006; Oki and Issa 2006; Smith and Workman 2009; Witt et al. 2009).
Many potent HDIs are modified hydroxamic acids specially designed to target histone protein complexes. These HDIs are effective at nanomolar concentrations because of their specificities. On the other hand, butyrate is a well-known differentiating agent in colon cancer cells (Mariadason 2008) that also inhibits cell proliferation and provokes cell cycle arrest during G1 at millimolar concentrations. Moreover, a direct effect of butyrate on inhibition of HDAC activity has been reported (Waldecker et al. 2008). In this paper we have identified a common metabolic flux pattern of cell differentiation induced either by NaB or TSA that is different from the effect induced by other MCFA, which neither possess HDI activity nor provoke cell differentiation on HT29 cells. Thus, although caprylic and capric acids produced a similar degree of cell cycle arrest and apoptosis to NaB, they did not induce cell differentiation and had different metabolic changes from those induced by the two HDI inhibitors tested. These effects should be applied to other cell lines that do respond to butyrate treatment, as HCT116 or CaCo-2 (Wilson et al. 2006). The different behavior of capric and caprylic acids may be explained by the different acyl-CoA dehydrogenases that metabolize the different length fatty acids (Jethva et al. 2008; Kieweg et al. 1997). However, more experiments should be conducted in order to test this hypothesis since the results obtained here neither confirm nor support this point.
HT29 cells treated with butyrate and TSA had a similar decrease in the glycolytic flux and lactate production due to a decrease in glucose consumption. On the contrary, cells treated with caprylic and capric acids showed an increase in glucose consumption and lactate production. Lactate enrichment was less than the expected from the obtained glycolytic flux. Therefore, cells treated with caprylic and capric acids probably used precursors other than glucose to produce lactate, such as glutamine (Mazurek and Eigenbrodt 2003; Rossignol et al. 2004; Vizán et al. 2008). The decrease in lactate enrichment (Σmn) and in the glycolytic rate was more prominent after inhibition of histone deacetylases by NaB and TSA due to the suppression of tumor glucose uptake and glycolysis. The effect of HDI in suppressing the high glucose utilization by tumor cells is supported by the recently published work by Egler and colleagues (Egler et al. 2008), where synergistic effect of 2-deoxyglucose, an inhibitor of glycolysis and histone deacetylase inhibitors was observed in combined therapy to induce glioblastoma cell death. Both NaB and TSA showed a decrease in the oxidative branch of the PPP (ribose m1), which could be related to a decrease in ribose synthesis that was not compensated for by an increase in the nonoxidative branch. This fact is in accordance with the importance of the oxidative/nonoxidative ratio in tumor vs. non-tumor cells, which was previously reported by our group, since an increase in this ratio is related to tumor malignancies (Ramos-Montoya et al. 2006).
Another difference between HDI inhibitors NaB and TSA and MCFA caprylic and capric acids was a significant decrease in glucose utilization through PDH (glutamate m2). Despite similarity between butyrate and caprylic and capric acids in their metabolism to acetyl-CoA, butyrate was more effective in reducing PDH activity than the other MCFAs. However, the effect of butyrate on PDH (glutamate m2) is similar to that of TSA which does not produce acetyl-CoA. These findings suggest that the metabolic pattern observed in cells treated with HDI is due to gene expression as part of the differentiation program. Accordingly, it has been reported that TSA is able to induce PDK4 gene expression which in turn inhibits PDH activity (Kwon and Harris 2004; Kwon et al. 2006).
To sum up, TSA induces the same metabolic profile changes as butyrate does. This suggests that the butyrate-induced HT29 metabolic profile change is the consequence of HT29 differentiation and not the cause of cell differentiation. The identification of the common metabolic profile induced by two different types of HDI enables the rational design of new combined therapies that synergize the metabolic adaptation of the cell differentiation process.
Concluding remarks
Differentiation causes metabolic changes that are not due to the use of NaB as an energetic substrate, since other MCFA did not present the same effects as NaB, but were observed when cells were incubated in the presence of the well-know differentiating agent TSA. The metabolic changes observed with NaB appear to be due to its HDAC inhibitory activity rather than to its lipid/substrate nature. We conclude that the observed metabolic changes accompany the differentiation program that is induced by the inhibition of histone deacetylation.
The better understanding of the specific effects of HDI on tumor cell central metabolic networks reported in this paper opens new avenues to design combination therapies with drugs that directly inhibit those pathways that decrease their flux during the differentiation process to generate synergies and enhance the effects of HDI.
Acknowledgements
This study was supported by grants SAF2008-00164 from the Ministerio de Ciencia e Innovación and personal financial support (FPU program) from the Ministerio de Educación y Ciencia, ISCIII-RTICC (RD06/0020/0046) from the Spanish government, from the European Union FEDER funds and from the European Commission (FP7) Etherpaths KBBE-grant agreement no. 222639. It has also received financial support from the Government of Catalonia (2005SGR00204) and mass spectrometry facility at Harbor-UCLA supports from grants to WNP Lee from UCLA Center of Excellence (PO1 AT003960-01) and from Harbor-UCLA GCRC (MO1 RR00425-33).
Open Access
This article is distributed under the terms of the Creative Commons Attribution Noncommercial License which permits any noncommercial use, distribution, and reproduction in any medium, provided the original author(s) and source are credited.
Abbreviations
- AP
Alkaline phosphatase
- NaB
Butyrate sodium salt
- CI
Chemical ionization
- DMSO
Dimethyl sulfoxide
- EI
Electron impact ionization
- FA
Fatty acids
- FACS
Fluorescence-activated cell sorter
- GC/MS
Gas chromatography coupled to mass spectrometry
- HDAC
Histone deacetylase
- HDI
Histone deacetylase inhibitor
- MCFA
Medium chain fatty acids
- MTT
3-[4,5-dimethylthiazol-2yl]-2,5-diphenyltetrazolium bromide
- PI
Propidium iodide
- TSA
Trichostatin A
References
- Bergmeyer HU, editor. Methods of enzymatic analysis. Weinheim: Verlag Dhemie; 1985. [Google Scholar]
- Boren J, Lee W-NP, Bassilian S, et al. The stable isotope-based dynamic metabolic profile of butyrate-induced HT29 cell differentiation. Journal of Biological Chemistry. 2003;278:28395–28402. doi: 10.1074/jbc.M302932200. [DOI] [PubMed] [Google Scholar]
- Csordas A. On the biological role of histone acetylation. Biochemical Journal. 1990;265:23–38. doi: 10.1042/bj2650023. [DOI] [PMC free article] [PubMed] [Google Scholar]
- Dangond F, Gullans SR. Differential expression of human histone deacetylase mRNAs in response to immune cell apoptosis induction by trichostatin A and butyrate. Biochemical and Biophysical Research Communications. 1998;247:833–837. doi: 10.1006/bbrc.1998.8891. [DOI] [PubMed] [Google Scholar]
- de Ruijter AJ, van Gennip AH, Caron HN, Kemp S, van Kuilenburg AB. Histone deacetylases (HDACs): Characterization of the classical HDAC family. Biochemical Journal. 2003;370:737–749. doi: 10.1042/BJ20021321. [DOI] [PMC free article] [PubMed] [Google Scholar]
- Egler V, Korur S, Failly M, et al. Histone deacetylase inhibition and blockade of the glycolytic pathway synergistically induce glioblastoma cell death. Clinical Cancer Research. 2008;14:3132–3140. doi: 10.1158/1078-0432.CCR-07-4182. [DOI] [PubMed] [Google Scholar]
- Heerdt BG, Houston MA, Augenlicht LH. Potentiation by specific short-chain fatty acids of differentiation and apoptosis in human colonic carcinoma cell lines. Cancer Research. 1994;54:3288–3293. [PubMed] [Google Scholar]
- Jethva R, Bennett MJ, Vockley J. Short-chain acyl-coenzyme A dehydrogenase deficiency. Molecular Genetics and Metabolism. 2008;95:195–200. doi: 10.1016/j.ymgme.2008.09.007. [DOI] [PMC free article] [PubMed] [Google Scholar]
- Katz J, Lee WN, Wals PA, Bergner EA. Studies of glycogen synthesis and the Krebs cycle by mass isotopomer analysis with [U-13C] glucose in rats. Journal of Biological Chemistry. 1989;264:12994–13004. [PubMed] [Google Scholar]
- Kelly WK, O’Connor OA, Marks PA. Histone deacetylase inhibitors: From target to clinical trials. Expert Opinion on Investigational Drugs. 2002;11:1695–1713. doi: 10.1517/13543784.11.12.1695. [DOI] [PubMed] [Google Scholar]
- Kieweg V, Krautle FG, Nandy A, et al. Biochemical characterization of purified, human recombinant Lys304–>Glu medium-chain acyl-CoA dehydrogenase containing the common disease-causing mutation and comparison with the normal enzyme. European Journal of Biochemistry. 1997;246:548–556. doi: 10.1111/j.1432-1033.1997.00548.x. [DOI] [PubMed] [Google Scholar]
- Kouraklis G, Theocharis S. Histone deacetylase inhibitors: A novel target of anticancer therapy (review) Oncology Reports. 2006;15:489–494. [PubMed] [Google Scholar]
- Kwon HS, Harris RA. Mechanisms responsible for regulation of pyruvate dehydrogenase kinase 4 gene expression. Advances in Enzyme Regulation. 2004;44:109–121. doi: 10.1016/j.advenzreg.2003.11.020. [DOI] [PubMed] [Google Scholar]
- Kwon HS, Huang B, Ho Jeoung N, Wu P, Steussy CN, Harris RA. Retinoic acids and trichostatin A (TSA), a histone deacetylase inhibitor, induce human pyruvate dehydrogenase kinase 4 (PDK4) gene expression. Biochimica et Biophysica Acta. 2006;1759:141–151. doi: 10.1016/j.bbaexp.2006.04.005. [DOI] [PubMed] [Google Scholar]
- Lee WN. Stable isotopes and mass isotopomer study of fatty acid and cholesterol synthesis. A review of the MIDA approach. Advances in Experimental Medicine and Biology. 1996;399:95–114. doi: 10.1007/978-1-4613-1151-5_8. [DOI] [PubMed] [Google Scholar]
- Lee WN, Boros LG, Puigjaner J, Bassilian S, Lim S, Cascante M. Mass isotopomer study of the nonoxidative pathways of the pentose cycle with [1,2-13C2] glucose. American Journal of Physiology. 1998;274:E843–E851. doi: 10.1152/ajpendo.1998.274.5.E843. [DOI] [PubMed] [Google Scholar]
- Litvak DA, Evers BM, Hwang KO, Hellmich MR, Ko TC, Townsend CM., Jr Butyrate-induced differentiation of Caco-2 cells is associated with apoptosis and early induction of p21Waf1/Cip1 and p27Kip1. Surgery. 1998;124:161–169. [PubMed] [Google Scholar]
- Mariadason JM. HDACs and HDAC inhibitors in colon cancer. Epigenetics. 2008;3:28–37. doi: 10.4161/epi.3.1.5736. [DOI] [PubMed] [Google Scholar]
- Marks PA, Xu WS. Histone deacetylase inhibitors: Potential in cancer therapy. Journal of Cellular Biochemistry. 2009;107(4):600–608. doi: 10.1002/jcb.22185. [DOI] [PMC free article] [PubMed] [Google Scholar]
- Martin M, Kettmann R, Dequiedt F. Class IIa histone deacetylases: Regulating the regulators. Oncogene. 2007;26:5450–5467. doi: 10.1038/sj.onc.1210613. [DOI] [PubMed] [Google Scholar]
- Matito C, Mastorakou F, Centelles JJ, Torres JL, Cascante M. Antiproliferative effect of antioxidant polyphenols from grape in murine Hepa-1c1c7. European Journal of Nutrition. 2003;42:43–49. doi: 10.1007/s00394-003-0398-2. [DOI] [PubMed] [Google Scholar]
- Mazurek S, Eigenbrodt E. The tumor metabolome. Anticancer Research. 2003;23:1149–1154. [PubMed] [Google Scholar]
- Mosmann T. Rapid colorimetric assay for cellular growth and survival: Application to proliferation and cytotoxicity assays. Journal of Immunological Methods. 1983;65:55–63. doi: 10.1016/0022-1759(83)90303-4. [DOI] [PubMed] [Google Scholar]
- Munster PN, Troso-Sandoval T, Rosen N, Rifkind R, Marks PA, Richon VM. The histone deacetylase inhibitor suberoylanilide hydroxamic acid induces differentiation of human breast cancer cells. Cancer Research. 2001;61:8492–8497. [PubMed] [Google Scholar]
- Oki Y, Issa JP. Review: Recent clinical trials in epigenetic therapy. Reviews on Recent Clinical Trials. 2006;1:169–182. doi: 10.2174/157488706776876490. [DOI] [PubMed] [Google Scholar]
- Perrine SP, Hermine O, Small T, et al. A phase 1/2 trial of arginine butyrate and ganciclovir in patients with Epstein–Barr virus-associated lymphoid malignancies. Blood. 2007;109:2571–2578. doi: 10.1182/blood-2006-01-024703. [DOI] [PMC free article] [PubMed] [Google Scholar]
- Ramos-Montoya A, Lee WN, Bassilian S, et al. Pentose phosphate cycle oxidative and nonoxidative balance: A new vulnerable target for overcoming drug resistance in cancer. International Journal of Cancer. 2006;119:2733–2741. doi: 10.1002/ijc.22227. [DOI] [PubMed] [Google Scholar]
- Roediger WE. Utilization of nutrients by isolated epithelial cells of the rat colon. Gastroenterology. 1982;83:424–429. [PubMed] [Google Scholar]
- Rossignol R, Gilkerson R, Aggeler R, Yamagata K, Remington SJ, Capaldi RA. Energy substrate modulates mitochondrial structure and oxidative capacity in cancer cells. Cancer Research. 2004;64:985–993. doi: 10.1158/0008-5472.CAN-03-1101. [DOI] [PubMed] [Google Scholar]
- Siavoshian S, Segain JP, Kornprobst M, et al. Butyrate and trichostatin A effects on the proliferation/differentiation of human intestinal epithelial cells: Induction of cyclin D3 and p21 expression. Gut. 2000;46:507–514. doi: 10.1136/gut.46.4.507. [DOI] [PMC free article] [PubMed] [Google Scholar]
- Smith KT, Workman JL. Histone deacetylase inhibitors: Anticancer compounds. International Journal of Biochemistry and Cell Biology. 2009;41(1):21–25. doi: 10.1016/j.biocel.2008.09.008. [DOI] [PubMed] [Google Scholar]
- Villar-Garea A, Esteller M. Histone deacetylase inhibitors: Understanding a new wave of anticancer agents. International Journal of Cancer. 2004;112:171–178. doi: 10.1002/ijc.20372. [DOI] [PubMed] [Google Scholar]
- Vizán P, Mazurek S, Cascante M. Robust metabolic adaptation underlying tumor progression. Metabolomics. 2008;4:1–12. doi: 10.1007/s11306-007-0101-3. [DOI] [Google Scholar]
- Waldecker M, Kautenburger T, Daumann H, Busch C, Schrenk D. Inhibition of histone-deacetylase activity by short-chain fatty acids and some polyphenol metabolites formed in the colon. Journal of Nutritional Biochemistry. 2008;19:587–593. doi: 10.1016/j.jnutbio.2007.08.002. [DOI] [PubMed] [Google Scholar]
- Wilson AJ, Byun DS, Popova N, et al. Histone deacetylase 3 (HDAC3) and other class I HDACs regulate colon cell maturation and p21 expression and are deregulated in human colon cancer. Journal of Biological Chemistry. 2006;281:13548–13558. doi: 10.1074/jbc.M510023200. [DOI] [PubMed] [Google Scholar]
- Witt O, Deubzer HE, Milde T, Oehme I. HDAC family: What are the cancer relevant targets? Cancer Letters. 2009;277:8–21. doi: 10.1016/j.canlet.2008.08.016. [DOI] [PubMed] [Google Scholar]
- Woo HJ, Lee SJ, Choi BT, Park YM, Choi YH. Induction of apoptosis and inhibition of telomerase activity by trichostatin A, a histone deacetylase inhibitor, in human leukemic U937 cells. Experimental and Molecular Pathology. 2007;82:77–84. doi: 10.1016/j.yexmp.2006.02.004. [DOI] [PubMed] [Google Scholar]