

Abstract
Traditional analyte-specific synthetic receptors or sensors have been developed on the basis of supramolecular interactions (e.g., hydrogen bonding, electrostatics, weak coordinative bonds). Unfortunately, this approach is often subject to limitations. As a result, increasing attention within the chemical sensor community is turning to the use of analyte-specific molecular indicators, wherein substrate-triggered reactions are used to signal the presence of a given analyte. This tutorial review highlights recent reaction-based indicator systems that have been used to detect selected anions, cations, reactive oxygen species, and neutral substrates.
1. Introduction
Supramolecular chemistry has continued to develop in an ever broader manner since it was recognized with the 1987 Nobel Prize for Chemistry, awarded jointly to Donald J. Cram, Jean-Marie Lehn, and Charles J. Pedersen. In theory, the principles of supramolecular chemistry may be (and often have been) embodied in synthetic host molecules that can recognize guest molecules in a very selective way using weak and generally reversible noncovalent bonds.1 Appreciating this fact, considerable effort within the supramolecular community has been devoted to the synthesis of chemical sensor systems (“sensors”) based on noncovalent interactions, including hydrogen bonding, π–π, donor–acceptor, electrostatic, hydrophobic, hydrophilic, and coordination-based interactions, among others.2 While considerable progress has been made, there remains a need for new approaches to chemical sensing. Indeed, a variety of strategies are currently being pursued. One approach that has received relatively little attention involves the use of reaction-based indicator systems.
Reaction-based chemical indicators may be defined as those where the visualized response is based on an irreversible or essentially irreversible reaction (Fig. 1). Needless to say, in the extreme, when the equilibrium is shifted (or almost shifted) to the product and the product is isolable, the underlying response chemistry involves a bona fide reaction.3 Thus, strictly speaking, reaction-based indicators fall outside the definition of supramolecular chemistry. In fact, in some respects the concept of reaction-based “sensing” simply represents a new twist on the venerable field of analyte-specific qualitative analysis. However, as detailed below, most modern systems borrow key concepts from the supramolecular chemical community, including the ideas of substrate-based specificity and the direct incorportation of readout-enabling sensor elements within the indicator. Therefore, as long as the reactions are used for detecting guests, reaction-based indicators can be considered as falling within the general paradigm of molecular recognition-based chemical sensor systems. The main difference between the newer reaction-based and more classic supramolecular-predicated approaches is that in the former the molecular specificity is derived from an analyte-specific reaction, rather than via analyte–receptor complementarity.
Fig. 1.
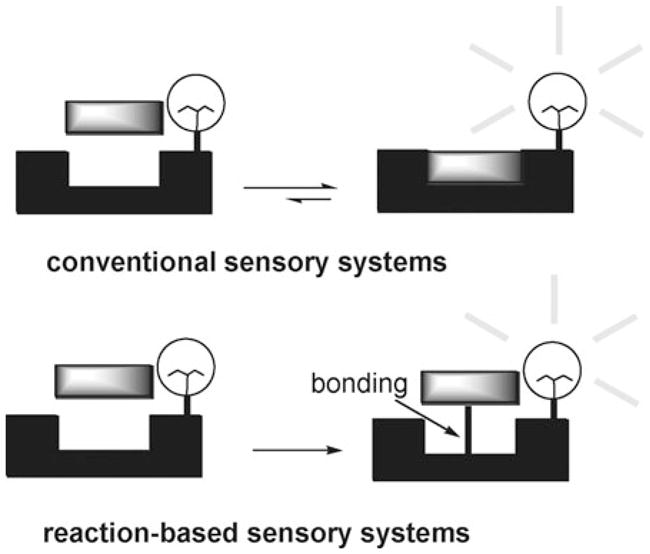
Schematic illustration of conventional sensors and reaction-based sensors.
Currently, the field of reaction-based sensors is still in its infancy. Nonetheless, it is already apparent that reaction-based sensory systems need to fulfill at least two key design requirements, namely: (i) operate with high selectivity, and (ii) produce product(s) that can be used as a marker for the analyte in question. However, to the extent these considerations can be met, reaction-based sensory systems promise near ultimate sensitivity. While this promise has yet to be fully realized, this tutorial review describes many indicator-based sensor systems that rely on complete or partial reactions and which, taken in concert, help illustrate the promise of the reaction-based approach to analyte sensing within chemistry and related fields. Our focus will be on systems where a design element has gone into the construction of the indicator and the reactions in question are essentially or nearly irreversible. Further, in keeping with the modern theme, the emphasis will be on systems reported over the last two decades. Of course, by its nature, our coverage will not be comprehensive. Thus, the attention of the reader is called to a recent concept paper that describes the use of reversible reactions for analyte sensing.4
2. Anion recognition
One of the areas where reaction-based indicators have enjoyed greatest success is in the area of cyanide sensing. The prevalence and toxicity of the cyanide anion make it of considerable interest in terms of new sensor development. Cyanide, CN−, is widely used in gold mining, electroplating, and metallurgy among other applications. While several more conventional supramolecular sensors for this species have been described recently,5 it is nevertheless apparent that new methods that could facilitate detection would be useful; appropriately applied, they might help mitigate environmental disasters such as that which plagued the Danube in 20016 or more generally help in recognition and control of this highly toxic species. Reaction-based detection systems appear to have an important role to play in this regard. This is because the cyanide anion is relatively basic and nucleophilic and is well appreciated for its rather unique reaction chemistry. In fact, as detailed below, these features have made CN− one of the more widely studied targets within the context of reaction-based indicator development studies.
2.1 Cyanide
The ortho-TFADA derivative 17 is one of the first reaction-based receptors to be described. This system, reported by the Ahn group, relies on the cyanohydrin reaction (Scheme 1). It owes its success to the fact that the ortho-TFADA core contains both an activated ketone (cyanohydrin reaction site) and a dansyl signalling motif. Further, this receptor takes advantage of an activated fluorinated ketone and a hydrogen bonding donor to facilitate cyanide recognition and to stabilize the cyanohydrin (2) formed from the cyanide addition reaction.
Scheme 1.

Proposed mechanism for the reaction-based detection of cyanide ion by indicator 1.
The photophysical properties of ortho-TFADA correspond to those of the dansyl moiety, displaying strong absorption at 260 and 350 nm. The sensing properties were studied via fluorescence titration by irradiating at 350 nm in CH3CN. The selectivity of receptor 1 was examined by adding 1 equiv. of various anions to a solution of the host (20 μM). Cyanide induced a 5-fold increase in the fluorescence intensity relative to 1, whereas both OAc− and F− were found to increase the fluorescence intensity by a factor of 2. In contrast, H2PO4− produced very little enhancement and the other anions tested (H2SO4−, ClO4−, Cl−, Br−, SCN−) produced no appreciable change in the fluorescence intensity. A pseudo association constant (Ka = 3 × 10⁵ M−1) for the interaction of TFADA with cyanide was obtained by carrying out the addition in the form of a fluorescence titration.
The position of the sulfonamide in 1 was considered pivotal to the observation of an anion-induced fluorescence enhancement effect. For instance, the analogous para-TFADA system displayed quenching behavior when cyanide anion was added. On the basis of such comparisons, the authors effectively excluded possible acid and base derived reaction pathways, and concluded that a cyanohydrin reaction served to underpin the signal-producing changes. Independent 1H NMR and 19F NMR spectral studies of 1 provided support for this conclusion. For example, the NH proton in the 1H NMR was found to shift to lower field (Δδ= 3.6) upon the addition of cyanide, whereas the signal for the CF3 group in the 19F NMR was found to shift upfield.
In 2006, receptor 3 (Scheme 2) was reported by the Sun group.8 This sensor also relies on the cyanohydrin reaction to elicit a cyanide-triggered response. While the analyses carried out were mostly visual and spectroscopic in nature, the authors did infer the presence of the product (compound 4) from electrospray mass spectrometric data (e.g., observation of a peak corresponding to [4 + 2Bu4N + CN−]+ = 948.68 m/z). The cyanide anion selectivity of 3 was probed in H2O–acetonitrile (1: 1, v/v) by adding various anions, such as CN−, F−, Cl−, Br−, I−, AcO−, BzO−, NO3−, H2PO4−, HP2O73−, ClO4−, and HS− (10 equiv.) to a solution of 3 (18 μM). Only the cyanide anion generated a new absorption band at 454 nm. This addition served to change the solution from colorless to yellow in color. Under these conditions, the calculated association constant is reasonably high (log Ka = 9.2M−2) for a 2: 1 binding process. In fact, 3 was found to be selective for cyanide over fluoride when tested for its response in H2O–acetonitrile (1: 1, v/v).
Scheme 2.

Proposed mechanism for the reaction-based detection of cyanide ion by indicator 3.
In 2008, a somewhat analogous amide-based cyanide was reported by the Akkaya group.9 This indicator (structure not shown) is based on a boradiazaindacene (BODIPY) dye and relies on a trifloroactyl amide group to elicit the cyanide-dependent response.
In 2006, the Tae group reported an acridinium salt 5 that reacts with the cyanide anion (Scheme 3).10 In this case, a nucleophilic addition reaction takes place at the activated 9-position of an N-alkylated acridinium cation to produce intermediate 5a. Subsequent oxidation produces 6. Interestingly, a similar reaction between methylated acridinium and cyanide had been published with the final product, N-methylacridon, being fully characterized in 1970.11 However, at the time its potential analytical utility was not recognized.
Scheme 3.
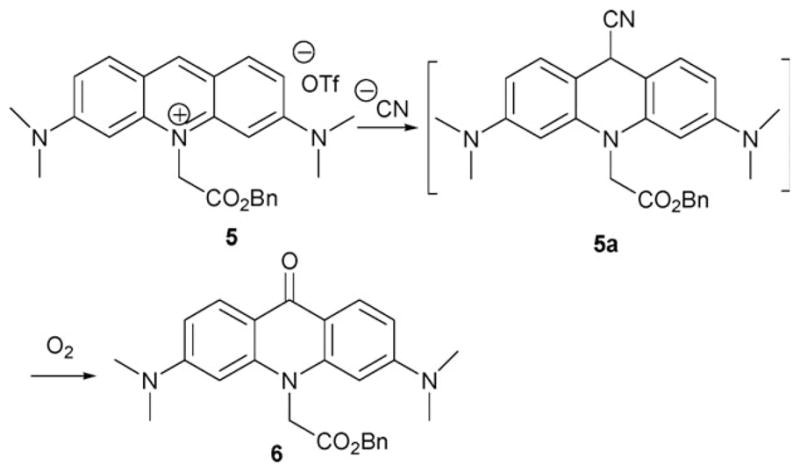
Proposed mechanism for the reaction-based detection of cyanide ion by indicator 5.
Based on the chemistry involved, it is quite likely that Tae’s cyanide-detection procedure is dependent on the solvent conditions, temperature, and reaction time. The indicator experiments were optimized and carried out in DMSO–water (95: 5, v/v) at 50 °C for 10 min by monitoring the fluorescence spectroscopic or visual changes seen upon the addition of cyanide. In the case of the fluorescence changes, the studies in question consisted of adding various anions (1 equiv.), including CN−, AcO−, ClO4−, F−, Br−, Cl−, I−, HSO4−, H2PO4−, SCN−, BzO−, NO3− CH3S−, and N3− to solutions of 5 under the mixed aqueous organic conditions noted above. Among the tested anions, only cyanide produced a color change (yellow to blue), and served to decrease the fluorescence emission intensity (Fo/F = 14). Other potential nucleophiles (Et2NH, BuNH2, PhSH, NaSMe, NaOPh and n-Bu4N·OH) yielded no detectable change. The detection limit for cyanide proved to be below 1.9 μM as judged by visual inspection under these optimized conditions.
The Raymo and Sortino group noted that the oxazine 7 (Scheme 4) is subject to a ring-opening equilibrium.12 These workers also discoverd that the ring-opened species could be trapped by the addition of n-Bu4N·OH. Presumably, the addition of this or other nucleophiles can suppress the ring-closing reaction effectively. 1H NMR spectroscopic studies supported the quantitative formation of hemiaminal 8, and the conclusion was further supported by a single-crystal structural analysis of the hemiaminal compound.12 Based on this information, the Raymo group developed the oxazine system 1013 as a possible colorimetric indicator. It differs from the original oxazine 7 in that it contains an azo group, which serves to enhance the absorption intensity upon the addition of cyanide anion. The selective nature of this class of oxazine indicators was probed via the addition of NaF, NaCl, NaBr, NaI and NaCN. It was found that the absorption spectrum only changed significantly when NaCN (10 mM) was added to a solution of 10 (0.1 mM) in acetonitrile.
Scheme 4.

Proposed mechanism for the reaction-based detection of cyanide ion by indicator 10.
It was found, however, that when the concentration of water in the medium was appreciable, a considerable amount of NaCN had to be added to induce a significant color change. To overcome this problem, the cyanide addition was carried out as a two-phase reaction (CH2Cl2–aqueous sodium phosphate buffer solution, pH = 9.0) using a phase transfer catalyst (n-Bu4N·Cl). The characteristic absorbance of the phenolate chromophore was observed upon the addition of 1 μM cyanide under these biphasic conditions. The limit of cyanide detection was judged to be 1 μM as inferred from UV-vis spectroscopic titrations.
The coumarin derivative 11 (Scheme 5),14 reported by the Hong group, also acts as a cyanide indicator. As with several of the previous systems, it also relies on a cyanohydrin reaction to produce a detectable fluorescence response. In this case, the cyanide-sensing mechanism was supported by a study of the chemical shifts of Ha and Hb in the 1H NMR spectrum. The aldehyde proton (Ha) of coumarin 11 appeared at 10.1 ppm in D2O. Upon the addition of NaCN, the aldehyde proton was seen to undergo a dramatic shift to 6.1 ppm (Hb). More quantitative studies of the anion response were carried out in HEPES buffer solution (pH = 7.4) using fluorescence emission methods. Based on these studies, it was concluded that the coumarin indicator 11 (10 μM) is very inert to other anions, including F−, H2PO4−, AcO−, ClO4−, Br−, Cl−, I−, NO3−, and N3− up to 1500 equiv. of anion. The relative specificity of this cyanohydrin-type reaction was ascribed to the presence of an ancillary hydrogen bonding interaction between the aldehyde functionality and the phenolic OH in 11. System 11 represents an important advance in the area of reaction-based indicator development in that it shows a fluorescence response to cyanide ions under aqueous conditions that mimic those present in biological milieus. This advance is all the more impressive given the simplicity of the molecular design.
Scheme 5.

Proposed mechanism for the reaction-based detection of cyanide ion by indicator 11.
The Sessler group explored the benzil rearrangement reaction and introduced it as a new reaction that could be exploited to obtain a cyanide-specific reaction-based indicator.15 This indicator system 13 (Scheme 6) contains an extended π conjugation pathway that is interupted after reaction with cyanide. Support for this mechanistic rationale came from an analysis of the chemistry involved and by isolation of the final product 14 in 69% yield.
Scheme 6.

Proposed mechanism for the reaction-based detection of cyanide ion by indicator 13.
Sensing-type indicator experiments involving 13 were conducted in ethyl acetate (21.3 μM). Upon the addition of cyanide (3 equiv.), the maximum absorption (λmax) was found to shift from 412 nm to 356 nm. This change in λmax was observable by eye (i.e., a change in the solution color from yellow to colorless). The selectivity of this receptor was shown by demonstrating that other anions, such as OH−, F−, N3−, AcO−, Cl−, HSO4−, and H2PO4−, did not either induce a detectable color change or trigger the benzil rearrangement reaction. The limit of cyanide detection proved to be about 20 μM in ethyl acetate under visual conditions; however, due to the fluorescent nature of the cyanobenzyl benzoate produce 14, the presence of cyanide anion could be detected at lower concentrations by a using laboratory UV lamp.
The Sessler group developed a second generation benzil indicator system that was found to overcome the water incompatibility and relatively low sensitivity of the previous indicator 13; this was done by introducing hydrophilic groups to the benzil core and exploiting a different cyanide-triggered reaction called the benzil–cyanide reaction. In this reaction, the benzil derivative 15 (Scheme 7)16 reacts with cyanide anions to produce the cleavage products 16a and 16b. As in the case of 14 above, these key species were identified via independent synthesis.
Scheme 7.

Proposed mechanism for the reaction-based detection of cyanide ion by indicator 15.
The cyanide-induced cleavage process produces a change in the maximum absorption from 409 nm (yellow) to 366 nm (white). Sensing experiments were conducted under optimized conditions wherein an added base acts to accelerate the reaction of 15 (by ca. 6× at an indicator concentration of 2.30 × 10⁻⁵ M in MeOH–water (80: 20, v/v)). In practical terms, the use of NaOH (1 N, 10 μM) in conjunction with indicator 15 (7.20 × 10⁻⁶ M in MeOH–water (30: 70, v/v)) allowed cyanide to be detected at a concentration of ≥1.7 μM within a time period of 1 h.
The selectivity of this reaction was probed by testing other anions, specifically OH−, F−, N3−, BzO−, Cl−, HSO4−, H2PO4− (10 equiv. of each anion), and finding that none induced a detectable color change when added to a solution of 15 (2.30 × 10⁻⁵ M in MeOH–water (80: 20, v/v)); in contrast, under these same conditions, the addition of cyanide (1 equiv.) produced a naked eye detectable color change within 10 min. This latter color change was not inhibited by either the presence of other anions (e.g., F−, N3−, BzO−, Cl−, HSO4−, H2PO4−; 1 equiv. of each) or NaOH (1 N, 10 μM), nor was there an appreciable slowing of the reaction rate.
2.2 Fluoride
While lying outside the scope of this review, there are a number of supramolecular receptors and sensors for the fluoride anion.2 Many of them show considerable selectivity for this species, especially in organic media. This selectivity could reflect simple size effects (the fluoride anion being relatively small and hard in the absence of extensive hydration); some of the fluoride-specific effects observed to date could be the result of the high inherent basicity of the F− anion. This basicity can lead to reactions, in particular receptor-centered deprotonations, the effects of which have been highlighted in recent years. For example, the Fabbrizzi group systematically investigated the anion recognition properties of a (benzylidenamino)thiourea receptor and concluded that the fluoride anion recognition attributed to this system is actually the result of an acid–base reaction.17 Analogous, and equally important, results were found by the Gale group; these researchers found that single crystals of a pyrrolyl-amidothiourea receptor grown from an organic solution containing (F− or Bz− as TBA salts) were deprotonated at the pyrrolic NH position.18 Although the (benzylidenamino)-thiourea and pyrrolylamidothiourea of Fabbrizzi and Gale, respectively, should not be considered as anion-selective indicators due to the unselective nature of the deprotonation event, they do serve to highlight an important reaction, namely proton transfer, that can be used to produce fluoride anion indicators. In spite of this promise, however, the chemistry of reaction-based indicators for fluoride is far less developed than that for cyanide.
The Swager group reported the polymeric fluoride indicator 17 (Scheme 8).19 In this case, the key F−-dependent sensing chemistry takes advantage of a silyl ether deprotection reaction,20 a transformation that permits cyclization to form a fluorescent coumarin moiety. It is thus the presence of the latter subunit within the polymer (cf. structure 18) that serves to signal the presence of fluoride. Fluoride-dependent fluorescence changes were demonstrated in CH2Cl2. In particular, it was found that upon the addition of fluoride (0.16 μM in CH2Cl2) to a solution of 17 (1.5 μM in CH2Cl2), both the fluorescence and emission spectra were red-shifted from (λmax = 378 nm and λem = 482 nm) to (λmax = 396 nm and λem = 517 nm). In addition, polymer 17 was found to produce changes in fluorescence behavior that were enhanced relative to those seen in the corresponding small molecule control system 19, at least in THF. Although the maximum change in fluorescence intensity was seen within 2 h upon the addition of fluoride (0.16 μM in THF) to a solution of 17 (1.5 μM in THF), its congener 19 (1.5 μM in THF) required a 100-fold higher fluoride concentration to achieve the same fluorescence intensity in 2 h.
Scheme 8.

Proposed mechanism for the reaction-based detection of fluoride by indicator 17.
The silyl-containing fluoride indicator 20 (Scheme 9)21 was reported by the Hong group in 2007; it also takes advantage of a silyl ether deprotection reaction. Specifically, this indicator reacts with TBA·F (or NaF) to produce the resorufin anion, a species that displays increased fluorescence intensity relative to the starting system 20. In this case, support for the proposed sensing mechanism came from a comparison of the maximum emission wavelength of the resorufin (sodium salt) recorded in the presence and absence of fluoride (studied in CH3CN–water 50: 50, v/v). The maximum emission band (λmax = 591 nm) observed in these experiments is attributed to the resorufin sodium salt.
Scheme 9.

Proposed mechanism for the reaction-based detection of fluoride by indicator 20.
The fluoride anion specificity of dosimeter 20 (0.5 μM in acetonitrile) was examined by testing its ability to produce a response in the presence of various potentially competitive anions, including F−, Cl−, Br−, I−, AcO−, H2PO4−, HSO4−, NO3−, and N3−. This was done by adding each anion (1400 equiv.) to a solution of 20 in CH3CN and monitoring the fluorescence response. It was found that the addition of F− increases the fluorescence intensity by ca. 500-fold at 591 nm, whereas the effect of the other anions proved negligible. In addition, when 11 equiv. of F− were added to a solution 20 (20 μM in CH3CN), the absorption peak intensity in the UV-vis spectrum was found to increase by 250-fold, with the response becoming saturated at this point. Again, other anions did not produce an appreciable response.
The response of indicator 20 (5 μM) to various anions was also tested in a water-containing medium (CH3CN–H2O, 50: 50, v/v). In this case, the addition of 3000 equiv. of F− led to a saturation of the fluorescence intensity (λem=589 nm), with a 200-fold increase in this intensity being observed. The color of the solution was also found to change from pale yellow to pink under these conditions. Other test anions produced no color change. Although this system demonstrates the effectiveness of this general approach to F− detection, the actual detection limit for indicator 20 is still too poor to make it a viable indicator.
Lewis acidic borane derivatives have been considered as anion sponges for such species as hydride, fluoride and hydroxide.22 However, most of these derivatives fail to produce an easy-to-monitor response. As such, they fall outside of our definition of reaction-based indicator systems. One important exception to this generalization comes from the Gabbaï group. These researchers designed a cationic Lewis acidic borane receptor 22 (Scheme 10),23 which contains a Lewis acidic borane and a cationic tertiary amine. Interestingly, the precursor to 22, compound 21, was seen to undergo no detectible change when exposed to TBAF in CHCl3. Under these conditions, the 1H NMR spectrum revealed only peaks ascribable to receptor 21. However, the corresponding cationic derivative 22 was seen to react quantitatively with TBA·F or TAS·F (tris(dimethylamino)sulfonium difluorotrimethylsilicate) under analogous conditions.
Scheme 10.

Synthesis and proposed mechanism of action for the fluoride indicator 22. Conditions: (a) MeOTf, CH2Cl2, 25 °C, 88%. (c) [Me3SIF2][S(NMe2)3], CH2Cl2, 25 °C, 64%.
In solution, a signal at 12.2 ppm was seen in the 11B NMR spectrum of receptor 22, while the corresponding fluorine resonance was observed at −152 ppm in the 19F NMR spectrum. Both signals are ascribed to a triarylfluoroborate moiety, a subunit that would be expected for the proposed product 23. Further support for such a species, and by extension the proposed mechanism of signal production, came from a crystal structure of 23; the latter revealed a C–H···F–B hydrogen bond. This bond is reflected in the fine splitting pattern seen in the 1H NMR spectrum (1JH–F = 9.2 Hz and 2JH–H = 12.9 Hz).
The ability of receptor 22 to act as a fluoride anion indicator was examined by monitoring the changes in the absorption spectrum of 22 in THF–MeOH (75: 25, v/v) as a function of added [TBA·F]. An association constant, Ka=5.0 × 10⁶M−1, was determined from these changes. Further studies of the interaction with fluoride anion were carried out by shaking a biphasic mixture consisting of TBA·F in D2O (2.7 × 10⁻¹ M−1, 0.5 mL) and receptor 22 in the CDCl3 (6.9 × 10⁻² M−1, 0.5 mL) layer. Under these conditions, receptor 22 afforded 23 in a yield of 82%.
Building on their previous work, the Gabbaï group elaborated their Lewis acidic cationic receptor by changing the distance between the cationic amine and the Lewis acidic borane center. This produced indicators 24 and 26 (Scheme 11). Cognizant of the fact that the [Ph3BCN]− anion had been used for the preparation of caesium ion salts, these workers examined the reaction between the cyanide anion and these two new boranes (i.e., 24 and 26).24 It was found that 24 and 26 react with both cyanide and fluoride anions (TBA salts) in organic solvents, such as chloroform. Surprisingly, in a mixture consisting of H2O–DMSO (60: 40, v/v), compound 24 reacted only with the cyanide anion, while receptor 26 reacted only with fluoride. In both cases, the addition of the anion caused a decrease in the absorption intensity. By monitoring this decrease as a function of concentration, effective association constants for receptors 24 and 26 could be obtained for cyanide and fluoride, respectively (Ka(CN) = 3.9 × 10⁸ M−1, Ka(F) = 910 M−1), in this solvent mixture.
Scheme 11.

Cyanide- and fluoride-sensing reactions of indicators 24 and 26.
In contrast to what was seen with these receptors, Mes3B does not react with cyanide. In the light of this “control,” the reaction with cyanide was ascribed to enhanced electrostatic interactions. Considering the relatively low association constant for F−, the authors suggest that this favourable electrostatic interaction cannot overcome the high hydration enthalpy and relative low basicity of fluoride (ΔH°hyd = −504 KJ mol−1, pKa = 3.18). In the case of both 24 and 26, interference from other anions, such as Cl−, Br−, I−, NO2−, HSO4−, and OAc−, proved negligible under the same mixed aqueous–organic reaction conditions noted above. Finally, it was found that receptor 24 (5 μM) produces a naked eye detectable signal with 1 equiv. of cyanide in H2O–MeOH (90: 10, v/v), when contained in a cuvette and illuminated with a laboratory UV lamp.
In a separate study, the Gunnlaugsson group observed an intense color change upon the addition of F− to a solution of 28 in DMSO (Scheme 12). These workers speculated that this color change could be the result of a deprotonation reaction. To confirm or refute this hypothesis, a series of compounds, 29–32, were synthesized and tested. While compounds 29, 30, and 32 give rise to a color change, 31 does not due to the lack of an acidic proton. This result clearly shows that the colorimetric change involves a deprotonation process.25 Further insights into the chemistry of the indicator were obtained by monitoring the changes seen in the 1H NMR spectrum of 29 in DMSO-d6 upon the addition of AcO−, H2PO4−, Cl−, Br− and F− (studied as their corresponding TBA salts). Significant changes in the chemical shifts of the naphthalimide ring protons were only observed upon the addition of F−. Saturation was seen at 2 equiv. of F− and was accompanied by an intense change in color from green to purple.
Scheme 12.

Fluoride selective indicators whose mode of action involves deprotonation.
3. Cation recognition
Cation recognition parallels anion binding as a major interest in supramolecular chemistry. Cations such as sodium, potassium, magnesium and calcium are ubiquitous in biological systems.2 Some transition metal ions such as Cu(I or II), Co(II), Zn(I) and Mn(II) play important roles in metalloenzymes and other proteins.26 Further, other metals such as Hg, Cd, and most radioactive species are very toxic. Thus, the facile detection and, in some cases, extraction of these cations are very important. Not surprisingly, therefore, a number of motifs, including crown ethers, cryptands, aza-crowns, polyamines and carboxylic acid derivatives, have been studied as cation complexants. The cation selectivity of these motifs is known to be highly dependent on structure. For instance, crown ethers can selectively bind Na+ or K+ depending on their size.
Although specificity always remains an issue, this size dependence has inspired many structural modifications.27 Nevertheless, obtaining good sensors or indicators for these and many other cations remains a challenge. For instance, detecting palladium has proven tremendously difficult using typical metal binding motifs. One solution involves the use of reaction-based indicator systems. A survey of such systems now follows. Excluded from our discussion are classic single element reactions, such as precipitation with H2S, that have been used since the early days of chemistry and which are the underpinnings of traditional qualitative and quantitative metal analysis.
3.1 Mercury
Hg(II) is known to be a thiophilic metal ion. Desulfurization reactions of thiocarbonyl compounds are relatively common and well documented.28 In fact, Hg(II) can convert many thiocarbonyl groups into the corresponding simple carbonyl. The Czarnik group used this desulfurization reaction to produce a reaction-based indicator for Hg(II). Their system, indicator 33 (Scheme 13), may represent the first documented modern reaction-based sensor system for detecting metal ions.29 Its mode of action is based on an appreciation that the thiocarbonyl group in 33 would quench the anthracene fluorescence by photoinduced electron transfer (PET). By contrast, the carbonyl product 34 produced by desulfurization was expected to be fluorescent. In accordance with such expectations, compound 34 proved to be 56 times more fluorescent than compound 33. Test desulfurization reactions were carried out with Hg2+, Ag+, Al3+, Ca2+, Cd2+, Co2+, Cr2+, Cu2+, Fe3+, In3+, K+, Mg2+, Mn2+, Na+, Ni2+, Sn4+, Pb2+, UO22+, and Zn2+ in aqueous buffer (HEPES buffer, pH = 7.0). Of these cations, only Hg(II) and Ag(I) reacted with receptor 33, as judged by the observation of an enhanced fluorescence intensity at 413.5 nm. The interactions with Hg(II) and Ag(I) proved relatively fast, proceeding to 87% and 73% completion, respectively, after 10 min under stoichiometric conditions (23 μM) at room temperature.
Scheme 13.

Proposed mechanism for the reaction-based detection of mercury by indicator 33.
The Zhang group has also reported a Hg(II) dosimeter, compound 35, that is based on a desulfurization reaction.30 As shown in Scheme 14, reduction with Hg(II) converts a poorly fluorescent compound, 35, to a highly fluorescent compound, 36. As in the case of the Czarnik system, a change in the PET properties provides the basis for the observed difference in the optical properties. The actual experiments were conducted in THF–water (20: 1, v/v) due to the low solubility of 35 in pure water. All reactions were carried out at 40 °C in the presence of 35 (10 μM) for 30 min. The enhancement in the fluorescence intensity was found to be linear in added Hg(II), with a 10-fold increase being observed at the point where 1 molar equivalent of Hg(II) had been added. Little detectable fluorescence enhancement was observed with other metal ions, including Ag+, Ba2+, Co2+, Mn2+, Ni2+, Pb2+, Zn2+ and Fe3+. Moreover, under conditions of direct competition, the interference from these metal ions, as well as La3+, Ce3+, Nd3+, Y3+, and Gd3+, proved negligible ([35] = 10 μM and [Hg2+] = 50 μM at 40 °C). Indicator 35 thus has a better selectivity profile than 33 for which competition from Ag(I) was observed.
Scheme 14.

Proposed mercury-sensing mechanism of 35.
In 2005, the Tian group reported what was apparently the first dual fluorescent and colorimetric reaction-based indicator for Hg(II). Their system, 37, consists of a 4-amino-1,8-naphthalimide (signaling unit) and a thiourea (reaction unit), as shown in Scheme 15.31 It relies on the formation of guanidiums from thioureas, both of which have been widely used as binding motifs in supramolecular chemistry.32 In contrast to other previously reported Hg(II) selective indicators, the creation of a guanidium moiety in the course of the reaction leads to a change in the π conjugation pathway; this is a key conversion that leads to a change in the absorption bands in the UV-vis region of the electronic spectrum.
Scheme 15.

Proposed mechanism for the reaction-based detection of mercury by indicator 37.
Actual tests of 37 as an indicator were carried out under conditions that were optimized to afford the best selectivity. These involved the addition of the Hg(II) ion (0.2 equiv.) to a solution of receptor 37 (3 μM) in acetonitrile–water, 80: 20 v/v, and allowing the reaction to proceed for 10 min. As expected, the absorption and emission maxima were shifted from 350 nm and 475 nm to 435 nm and 530 nm, respectively. No appreciable change was observed when other cations, such as Ag+, Co2+, Cu2+, Ni2+, Pb2+, and Zn2+, were examined. However, for Hg(II), the change was substantial; indeed, using standard fluorescence titrations, the limit of detection was determined to be ca. 0.2 μM.
Squaraine dyes have been used as a signalling unit for Ca2+ sensing, as well as being exploited extensively for other aspects of supramolecular chemistry.33 Squaraine has an electron deficient central core that is very vulnerable to nucleophilic reactions. The squaraine-based Hg(II) indicator 3934 (Scheme 16) exploits this feature to create a system that allows for both reaction and signal “read out”. The actual Hg(II)-sensing mechanism involves a thiol elimination step assisted by Hg(II). One interesting feature of receptor 39 is that it can be recycled quantitively by adding thiols, as shown in Scheme 16.
Scheme 16.

Mercury(II)-induced conversion of 39 to zwitterion 40 and the thiol-based regeneration of 39.
The conditions used for Hg(II) detection were optimized and consisted of a water–acetonitrile mixture (4: 1, v/v, 0.01 M CHES buffer solution, pH=9.6). Upon the addition of Hg(II) to a solution of 39 in this medium, a new absorption signal was observed at 642 nm with an emission signal appearing at 670 nm. The Hg(II) selectivity was tested by adding 0.5 equiv. of various metal ions, specifically Ni2+, Zn2+, Ti+, Fe3+, Hg2+, Pb2+, and Al3+, to a solution of 39 (6 μM). Of these, only Hg2+ engendered a strong absorption increase at 642 nm. When fluorescence spectroscopy was used to monitor the change, the detection limit for Hg(II) was found to be less than 2 ppb (for [39] = 0.1 μM). In addition, a prototype of a dip-stick system, wherein 39 was fixed on a polyethylene terephthalate film, was prepared and tested. Dipping the resulting modified film into a Hg(II) solution then produced a change from colorless to blue in a few seconds. This bodes well for the use of systems such as 39 as practical colorimetric indicators.
The Hg(II) indicator 4135 reported by the Tae group relies on a 1,3,4-oxadiazole forming reaction.36 In this case, the indicating core is derived from rhodamine 6G. Nonetheless, the actual Hg(II) detection process involves a desulfurization reaction, as shown in Scheme 17. Sensing experiments were conducted in water–methanol (80: 20, v/v). Upon the addition of Hg(II) ions (1 equiv.), the fluorescence intensity of the solution 41 (1 μM) was found to increase 26-fold, while the emission maximum shifted from 533 nm to 557 nm. The signal readout was relatively fast, allowing for a response time of <1 min. To test the selectivity of receptor 41, 1 equiv. of various potentially competitive metal ions, such as Ag+, Zn3+, Cu2+, Pb2+, Cd2+, Ni3+, Co2+, Fe2+, Mn2+, Mg3+, Ca3+, Ba2+, Li+, K+, Na+, Rh3+, and Cr2+, were added to 41 under identical conditions. While a slight enhancement in the fluorescence intensity was seen for Ag(I) and Zn(II), little detectable change was observed for the other cations tested. Further, based on the result of fluorescence titration experiments, the detection limit of this dosimeter was determined to be in the parts per billion range.
Scheme 17.

Proposed mechanism for the reaction-based detection of mercury by indicator 41.
8-Hydroxyquinoline (8-HQ) is a well-known ligand for Zn2+, Al3+, Fe3+ and Hg2+. The Chang group introduced a thionyl amide group to 8-HQ, to produce indicator 43 (Scheme 18).37 Treatment with Hg(II) engenders a desulfurization reaction analogous to those described above; this conversion, which produces 44, leads to a “turn on” increase in the fluoresence intensity at 479 nm. Various metal ions (Na+, K+ Mg2+ Ca2+, Ni2+, Cu2+, Zn2+, Hg2+ and Cd2+) were examined for their effect on 43. These experiments were carried out in a 30% aqueous acetonitrile solution that was buffered at pH 8.1 with tris buffer. In each case, 100 equiv. of the ions in question were added to a solution of 43 (5 μM). Only in the case of Hg(II) was an enhancement in the fluorescence intensity seen. The most likely competitive species, Cd(II), was found in particular to produce a negligible change. On the other hand, it was determined that the addition of 1 equiv. of Hg(II) leads to a complete saturation of the fluorescent change at 479 nm under the same conditions. From quantitative studies, the detection limit for Hg(II) was estimated to be 0.5 μM.
Scheme 18.

Proposed mechanism for the reaction-based detection of mercury by indicator 43.
The Chang group reported a different kind of Hg(II) indicator that takes advantage of selective direct mercuration to the ortho-position of the phenol subunit present in dichlorofluorescein, 45.38 Support for this sensing mechanism, shown in Scheme 19, came by comparing the NMR and fluorescence spectra of the proposed product of the reaction, the mercury derivative 46, with those obtained from a sample prepared by direct synthesis.
Scheme 19.

Proposed mechanism for the reaction-based detection of mercury by indicator 45.
The ability of indicator 45 to signal the presence of mercury(II) was investigated by adding Hg(II) ions to a solution of 45 in H2O–DMSO (90: 10) at pH 5.0 in the presence of 10 mM of an acetate buffer. Under these conditions, the two absorption bands (475 and 505 nm) ascribed to 45 were found to decrease gradually in intensity and to undergo a red-shift to 483 and 533 nm, respectively. Likewise, a strong emission band at 528 nm was observed upon irradiation at 470 nm. The Hg(II) selectivity was investigated by monitoring the extent of quenching efficiency (Io/I at 528 nm) observed upon the addition of 10 equiv. of various metals ions to a solution of 45 (10 μM in H2O–DMSO (90: 10) at pH 5.0 with 10 mM acetate buffer). Under these conditions, Hg(II) was found to be highly efficient as a quencher (quenching efficiency > 1900), whereas all other cations tested (Na+, K+ Mg2+ Ca2+, Co2+, Ni2+, Cu2+, Zn2+, Ag+, Pb2+, and Cd2+) proved ineffectual. More importantly, the change in signal produced by Hg(II) was fairly rapid, being complete within 10 min. In contrast, no response for other metal ions, including Ag(I), Cd(II), and Pb(II), was seen within 24 h. Based on these and related measurements, a detection limit of 7.5 μM was calculated.
In 2007, the Kim group reported a more sensitive Hg(II) indicator.39 This system, 47 (Scheme 20), was obtained by combining a visible azobenzene group with a guanidium-forming reaction group to obtain the thiourea derivative. Treatment with Hg(II) was thus expected to produce 48, a proposal supported by an independent synthesis of 48. Actual sensing experiments were conducted in DMSO–H2O (80: 20, v/v) at room temperature. When 1 equiv. of various metal ions, Al3+, Pb2+, Hg2+, Zn2+, Cu2+, Cd2+, Co2+, Ca2+, Ba2+, Sr2+, Mg2+, K+, Na+, and Cs+, was added to 48 (20 μM), it was found that only the Hg(II) ions induced a spectral change, specifically a blue-shift in the absorbance maximum from 486 nm to 406 nm. This produced a visual color change (from red to yellow) and allowed a detection limit of 1 μM to be calculated. Under dilute conditions, the sensing reaction proved fast enough to be complete in under 1 min.
Scheme 20.

Proposed mechanism for the reaction-based detection of mercury by indicator 47.
In 2008, the Koide group reported a new type of Hg(II) indicator, 49 (Scheme 21), that is based on a clever application of the well-known oxymercuration reaction.40 In the presence of Hg(II), indicator 49 was found to be converted to 50, a transformation that gives rise to a green fluorescence. Evidence in support of this proposed sensing mechanism came from isolating 50 in 61% yield after the reaction, as well as through detection of the other products (e.g., methyl vinyl ketone) by HPLC.
Scheme 21.

Proposed mechanism for the reaction-based detection of mercury by indicator 49.
Tests of indicator 49 were carried out by heating 49 and Hg(II) (1 equiv.) in a pH 7 buffer at 90 °C. This system was characterized by good sensitivity at low concentrations (0.1 μM) both in pure water and in buffer at pH 7 (signal-to-background (S/B) ratio = 3 at 8 ppb Hg(II)). The interference produced by other metal ions was not significant (less than 8%), as deduced by adding 25 μM of another metal ion (Li+, Na+, Mg2+, Ca2+, Ba2+, Ni2+, Zn2+, Cu2+, Cr3+, Co2+, Mn2+, Pb2+, Cd2+, Fe3+, and Ag+) to a mixture of 49 (1 μM) and Hg(II) (2.5 μM).
The Koide group further demonstrated the usefulness of their probe by showing they could detect Hg(II) extracted from salmon tissue or leached from a dental amalgam. For the first of these studies, salmon tissue extracts were treated with a combination of indicator 49 and NCS (N-chlorosuccinimide); this gave rise to a strong fluorescence signal. Here, the NCS acts as an oxidant, producing Hg(II) by oxidizing MeHg(I), the dominant mercury contaminant in salmon. An enhanced fluorescence signal was also seen when 49 was used to test either a Kimwipe that had been soaked with saliva and pressed on an amalgam-filled tooth for 1 min or cysteine solutions that had been exposed to amalgam-filled teeth at 35 °C for 1 h. While constituting a fascinating demonstration of utility, it is important to keep in mind that these studies have yet to be carried out in a quantitative manner.
3.2 Copper
Cu(II) is known to accelerate the hydrolysis of α-amino acid esters.41 This key reactivity feature provides the basis for indicator 51.42 This system also incorporates a rhodamine B subunit, which provides a key signalling group. The relevant chemistry is summarized in Scheme 22. Here, the Cu(II) cation is thought to coordinate to the hydrazide group in 51a. This, in turn, facilitates the equilibrium between 51a and 51b. Water can then react with 51b to generate hydrazine and rhodamine 52. An authentic sample of 52 was prepared and was found to give TLC, electrospray mass spectrometric, absorption and emission spectral data concordant with the product obtained from treating 51 with Cu(II).
Scheme 22.

Proposed copper(II)-based reactions considered relevant to an understanding of indicator 51.
Tests of 51 as an indicator were conducted in buffered aqueous solution (0.01 M HEPES, pH = 7.0). Specifically, 100 equiv. of various cations were added to a solution of 51 and monitored after 1 h by UV-vis spectroscopy. Cations examined included Ag+, Al3+, Ca2+, Cd2+, Co2+, Cr3+, Cu2+, Eu3+, Fe3+, Ga3+, Gd3+, Hg2+, In3+, K+, Li+, Mg2+, Mn2+, Na+, Ni2+, Pb2+, Rb+, Sn4+, Sr2+, U4+, Yb3+, and Zn2+. The addition of Cu(II) and Hg(II) under these conditions produced a reaction. However, under optimized conditions (51: 0.5 μM, buffer–acetonitrile = 80: 20, v/v), the addition of Cu(II) led to complete reaction within 1 min, whereas Hg(II) required 50 h to produce an appreciable change. Indicator 51, at a concentration of 10 μM, was found capable of detecting Cu(II) concentrations of less than 0.1 μM, as inferred from enhancements in the fluorescence emission intensity.
3.3 Palladium and platinum
Palladium catalyzed Trost–Tsuji reactions43 have been widely used in organic synthesis and in the pharmaceutical industry. However, residual palladium contamination is often an issue in these and other Pd catalyzed reactions, especially since the palladium residual in human-grade pharmaceutical products should be less than 10 ppm.44 In spite of the need to monitor and control Pd levels in such products, palladium detection has received little attention within the molecular recognition community.
One important probe for Pd is indicator 53 (Scheme 23), reported by the Koide group.45 These researchers realized that O-alkylated fluoresceins are not fluorescent, while deprotected fluoresceins (including the reaction product 54) are fluorescent, a fact that has been exploited extensively in the biological imaging field. This electronic disparity was paired with the Trost–Tsuji reaction to produce the O-alkylated derivative 53.
Scheme 23.

Palladium-dependent reactions of 53.
To test the selectivity of this putative Pd indicator, several metals, including Pd2+, Pt2+, Fe3+, A2+, Ni2+, Mn3+, Cd2+, Au3+, Rh+, Cu3+, Mg+, K+, Cr3+ Co2+, Hg2+, and Ru3+, were examined in basic aqueous media (borate buffer, pH = 10) in the presence of PPh3. The addition of Pd(II) induced an enhancement in the fluorescence signal, with Pt(II) also producing an enhancement, albeit a level roughly half that of Pd(II). Other metal cations failed to engender an increase in the emission intensity.
To quantify the presence of Pd, indicator experiments were conducted under standard conditions; these involved a 10 μM concentration of 53 in borate buffer and a reaction time of 1 h. Linearity between the fluorescence intensity and the amount of added Pd(II) was observed over the concentration range of 3 to 300 nM.
Receptor 53 was then examined in three experiments designed to probe its potential utility under field conditions. First, a sample of aspirin containing 10 ppm Pd was tested. It was found that the observed intensity from this sample was nearly the same as that observed for a positive control (10 ppm Pd + receptor 53). Second, to test what might be needed operationally under conditions of Pd and Pt mining, where traditionally rock samples are analyzed for Pd–Pt via atomic absorption analysis, typical rock samples were mixed with 53 (in buffer). With a laboratory UV lamp (365 nm), the authors identified two rock samples containing 36 ppm and 120 ppm of Pd–Pt, respectively. In fact, the two samples in question turned green when subjected to such UV illumination. Third, the authors were able to detect Pd residue on a glass surface under conditions designed to mimic the washing procedures routinely used in the organic laboratory (brushing with detergent and washing with water and acetone). Again, efficacy was demonstrated. Thus, taken in concert, these three examples help illustrate the potential utility of this class of reaction-based indicators.
The Koide group also reported an oxidation-specific reaction of indicator 53 (Scheme 24).46 It is based on a different reaction, namely the Claisen reaction, but takes advantage of the same indicator as used for the Pd(0) and Pt(0) detection procedure described above. This new reaction-based approach has the advantage that it can detect Pd(II) or Pt(IV) in the presence of Pd(0) or Pt(0), respectively. Specifically, indicator 53 only detected cationic palladium and platinum species, as inferred from sensing experiments conducted using a range of metal sources, including PdCl2, LiCl, FeCl3, AgNO3, NiCl2, MnCl2, Pb(NO3)2, CdCl2, AuCl3, AuCl, RhCl(PPh3)3, CuCl, CuCl2, MgSO4, KCl, CrCl3, CoCl2, HgCl2, RuCl3, ZnCl2, Pd black, Pd2(dba)2, Pd(PPh3)4, PdCl2(MeCN)2, Pd(acac)2, Pd(OAc)2, and K2PdCl4, and using reaction times of 4 h at 50 °C in 1: 4 DMSO–pH 10 buffer. The detection limit of Pd(II) under these conditions was about 3.9 μM, with a signal-to-background ratio (S/B) of 3. The Pd(II) specificity was specifically examined in the presence of Pd(0) (6 μM) and 50 mg of different selected organic compounds, including thioanisole, cholesterol, 2-carboxy-7-hydroxycoumarin, morphine, indole, and N-methylephedrine. The experiments were duplicated using three different Pd(II) concentrations (60 μM, 6 μM, and 0.6 μM, respectively). Although the observed fluorescent intensity was found not to correlate perfectly with the amount of Pd(II), presumably reflecting changes in the added organic species, nevertheless it was concluded that this protocol could be potentially useful for detecting Pd(II) under conditions where samples are examined in a high throughput manner.
Scheme 24.

Additional palladium-dependent reactions of 53.
The chemistry of Scheme 24 was also used to monitor the progress of the electrochemical reduction of Pt(IV) to Pt(0), thereby mimicking conditions used in Pt(0) manufacturing. In these test experiments, the observed enhanced fluorescent intensity was found to be a linear function of the amount of Pt(IV), as judged from four experimental data points recorded over a reasonably wide range (i.e., [Pt(0)] = 0.5 μM, 5 μM, 50 μM, and 500 μM). The detection limit for Pt(IV) was calculated to be 0.54 nM.
4. Neutral molecule recognition
4.1 Phosgene
Phosgene was first used as a chemical weapon in World War I and its infamy for this purpose lives to this day. Even though there are now many more deadly chemical warfare agents known, phosgene remains one of the easiest of these nefarious species to obtain, due to its use in the chemical industry.47 Accordingly, indicators for phosgene could be potentially beneficial. However, to date, optical sensing systems for phosgene have remained rare. On the other hand, by exploiting a reaction-based approach, the late Rudkevich succeeded in developing a potential phosgene sensor. This system, which takes advantage of the urea-forming reaction between 56 and 57 (a coumarin 343 derivative) and a key fluorescence resonance energy transfer (FRET) process, is illustrated in Scheme 25.48 In this case, FRET is produced within product 58, which is the product generated as the result of the phosgene-induced coupling.
Scheme 25.

Rudkevich’s phosgene-sensing strategy, which relies on the reaction between 56 and 57.
Tests of phosgene sensing were conducted at concentrations of 5 × 10⁻⁴ to 10−2 M−1. In these tests, an equimolar mixture of the two starting compounds (56 and 57) was mixed in CHCl3 in the presence of TEA (10 equiv.). Phosgene was then added to the solution. The solution was diluted to 10−6 M via the addition of CHCl3 and monitored by irradiating at 343 nm. The dilution step proved critical; otherwise, the reaction was very slow at a concentration range of <10−5 M. During the titration, it was observed that the fluorescence intensity at 464 nm increases, which corresponds to the emission of coumarin 343 (i.e., the key fluorophore). In addition, the system was observed to undergo naked eye detectable changes in color when irradiated with a laboratory UV lamp. Although this urea-forming reaction may not give rise to a single product (i.e., 58) due to possible self-coupling reactions, the useful detection limit for phosgene was nevertheless determined to be about 5 × 10⁻⁵ M.
4.2 Hydrogen peroxide
A variety of reactive oxygen species (ROS) are implicated in human biology. One of these is hydrogen peroxide (H2O2/HO2−). Hydrogen peroxide and other ROS have been implicated in a range of human diseases including Alzheimer’s disease, neurodegerative disease, cardiovascular disorders, and cancer.49 The need to sense H2O2 is thus well appreciated. Indeed, several receptors have been developed using ROS-cleavable protecting groups.50
While many of the traditional methods for sensing hydrogen peroxide are enzymatic based,51 recent progress in the area of H2O2 indicators has been made by taking advantage of pure chemical reactions, which do not require enzymatic transformations. In this context, the Lo group developed the first boronate-based probe 59.52 This system relies on a hydroboration process that serves to generate subsequently the signalling compound 60 (Scheme 26). Using this indicator, sensing experiments were carried out by adding hydrogen peroxide (10–50 μM) to a solution of 200 μM of 59 in the presence of 140 mM NaHCO3 (pH 8.3) at 25 °C. The amount of p-nitroaniline released was found to be a linear function of the hydrogen peroxide concentration over the testing range. This allowed its presence to be sensed by observing the increase in the absorbance band at 405 nm. Generally, saturation was observed after 80–90 min. While TBHP was found to react with 59, it did so at a slower rate than hydrogen peroxide (i.e., roughly 2% of the speed). However, cysteine, when tested under the reaction conditions, was found to consume hydrogen peroxide; it is thus a potential interferant.
Scheme 26.

Hydrogen peroxide-sensing reaction of 59.
Receptor 61 (Scheme 27),53 developed by the Chang group, is also noteworthy within the context of hydrogen peroxide sensing. It is based on a process that takes advantage of simple fluorescein chemistry. The starting material, 61, is not fluorescent, whereas the product, 62, produced upon reaction with H2O2, is fluorescent. The identity of the final product 62 was confirmed by comparing the absorption, emission, and electrospray ionization mass data of 62 produced from the reaction and an authentic sample.
Scheme 27.

Hydrogen peroxide-sensing reaction of 61.
Sensitivity towards H2O2 was demonstrated under simulated biological conditions (20 mM HEPES buffer, pH 7). Indicator 61 (5 μM) responds to H2O2, undergoing a fluorescence increase to a level that is over 500 times greater than that originally seen. The response to these ROS was very close to zero when indicator 61 was exposed to other ROS, including TBHP, O2−, NO, or −OCl. However, the signal produced by the highly reactive radical species, •OH, was one third of that produced by H2O2. Likewise, the increase produced by the OtBu radical was 1/15 of that produced by H2O2. Finally, Chang and his group were able to demonstrate a fluorescence enhancement in HEK cells via confocal microscopy. In this experiment, the cells were incubated with 5 μM of indicator 61 for 5 min at 25 °C, after which time H2O2 (10–100 μM) was administered and the expected fluorescence enhancement observed.
Another interesting H2O2 probe, compound 63 (Scheme 28),54 was developed by the Chang group as an improvement over indicator 61. This new probe exploits fluorescence resonance energy transfer (FRET) as a means of enhancing sensitivity. In this case, reaction with H2O2 serves to unmask a FRET cassette 64 that contains a coumarin donor, a fluorescein derivative, and an amide linker.
Scheme 28.

Hydrogen peroxide-induced transformation of indicator 63 into product 64 and the FRET pathway expected in the latter species.
Upon reaction with H2O2, receptor 63 gives rise to a species that is characterized by one major band at 517 nm and a minor band at 461 nm upon irradiation at 420 nm under simulated biological conditions (DPBS buffer, 15 FBS, pH = 7.4). Conversely, prior to treatment with H2O2, an emission at 464 nm is observed. Therefore, the ratio λ517/λ464 could be monitored as an indicator of this particular ROS concentration. After 200 mM H2O2 was added to a solution of 63 at pH 7.4, this ratio was seen to increase from 0.45 to 3.7 over the course of 1 h. Other ROS, such as TBHP−, O2−, NO, NO+, OH radical, TBHP radical, OCl−, O3, and even O2, induced little or no change in this ratio. The observed kinetics for this reaction were found to be pseudo-first-order (Kobs = 2.7 × 10⁻⁴ S−1) under the reaction conditions (1 μM 63, 1 mM H2O2). These results served to highlight the potential utility of this indicator, a conclusion that was supported by showing that probe 63 could be be used to quantify the amount of H2O2 produced by viable mitochondria stimulated with antimycin A.
Further analogues of boronate-based probes have recently been developed and used for cell signaling and subcellular targeting by the Chang group. As a general rule, these indicators also rely on hydroboration.55
4.3 Explosives
The need to detect polynitro compounds has come to the fore lately due to military and civilian defense concerns. The ability to recognize or sense explosives quickly and easily could reduce casualty from improvised explosive devices (IEDs), land mines, and miltary conflicts. Given the need to monitor for untoward release of explosives at, e.g., military storage facilities and at manufacturing sites, there is also a potential environmental benefit. Unfortunately, current colorimetric sensing methods are limited. This is because they have traditionally relied on the monitoring of colored Jackson–Meisenheimer anions produced via the reaction of nucleophiles with the polynitroaromatic compound. The first such reaction was observed by Janowsky in 1891, with the underlying mechanism being proposed independently by Meisenheimer and Jackson and Earle.56
Jenkins and Walsh developed this chemistry as a method for detecting TNT (1,4,6-trinitrotoluene, 65) and DNT (2,4-dinitrotoluene, 66), as summarized in Scheme 29.57 This method was applied to soil samples containing these species. For the tests, samples (25 mL) of a soil extract obtained by shaking a 20 g soil sample for 3 min with 100 mL acetone were prepared. To test for TNT and DNT, 0.2 g of sodium sulfite and a pellet of potassium hydroxide were added to the samples and allowed to react for 3 min and 30 min, respectively. In the sample containing TNT a red-colored Janowsky complex, 67, was formed, whereas in the DNT sample, the blue–purple colored 68 was observed. In both cases, the detection limits proved to be about 1 μg g−1. These same researchers were also able to use a chemical reaction to detect RDX (hexahydro-1,3,5-trinitro-1,3,5-triazine, 69) in a soil sample.57 In this case, a sample obtained as above was pretreated with an anion exchange resin to remove nitrate and nitrite. It was then acidified with acetic acid and reacted with zinc dust. The resulting filtrate was then treated with Griess’ reagent (a Hach NitriVer3 powder pillow: sodium sulfanilate, 4,5-dihydroxy-2,7-naphthalene-disulfonic acid disodium salt, potassium phosphate monobasic, potassium pyrosulfate and trans-1,2-diaminocyclohexanetetraacetic acid trisodium salt) to form an azo dye. This allowed RDX to be detected with a detection limit of about 2 μg g−1.
Scheme 29.

(a) Reactions of TNT and DNT that have traditionally been used for sensing. (b) Reaction of RDX that has been used for the same purpose.
Medary reported a somewhat analogous method for detecting TNT in soil.58 In this case, NaOH in MeOH was used to form a pink–purple Jackson–Meisenheimer anion (65; Scheme 30). The absorbance of this latter species was found to be directly proportional to the concentration of the TNT, allowing for a degree of quantification. The response time was generally less than 3 min, and the detection limit was as low as 4–8 ppm. Interestingly, other nitroaromatic compounds, such as 1,3-dinitrobenzene, 1,3,5-trinitrobenzene, and 2,4-dinitrotoluene, did not provide as clear a response; this was ascribed to longer reaction times and unreliable color changes.
Scheme 30.

A reaction used to detect the presence of TNT.
5. Miscellaneous
There are many examples that lie in the “grey area” that falls between conventional receptors and reaction-based indicators. Most of these systems rely on reactions that, while analyte selective, are actually reversible. Therefore, many such “sensors” thus fall outside the scope of this review. However, to illustrate this somewhat related, but conceptually disparate approach,59 which has been particularly well developed for Pb(II) detection,59 we feel it is appropriate to discuss system 7260 in the context of this tutorial review.
System 72, reported by Nam and Yoon et al., relies on rhodamine B to sense Pb(II) via a process involving chelation-enhanced fluorescence. The reaction mode, illustrated in Scheme 31, was verified by examining the relevant spectral data (IR and NMR, and ESI mass spectrum). For instance, the characteristic lactam peak in the IR spectrum was found to shift from 1689 cm−1 to 1614 cm−1 in the presence of Pb(II). Although the addition of Pb(II) caused a broadening of some peaks in the 1H and 13C NMR spectra, what is most noteworthy is the disappearance of the signal ascribed to the spiro carbon at 64.7 ppm. A peak corresponding to [72 + Pb]+ was also clearly observed in the ESI mass spectrum.
Scheme 31.

Proposed lead-sensing mechanism of 72.
Specific tests of the ability of 72 to act as an indicator for Pb(II) were made by carrying out titrations that involved adding 100 equiv. of various metal ions (Ag+, Ca2+, Cd2+, Co2+, Cs+, Cu2+, Hg2+, K+, Li+, Mg2+, Mn2+, Na+, Ni2+, Pb2+, Rb+, and Zn2+) to solutions of 72 (1 μM in acetonitrile). An intense enhancement in the fluorescence intensity was observed only in the case of Pb(II). However, small changes were induced by Zn(II). Nevertheless, the selectivity for Pb(II) over Zn(II) was greater than 20-fold. Support for this latter result came from quantitative assessments of the association constants for Pb(II) and Zn(II), which were determined to be 19 500 and 900 M−1, in acetonitrile, respectively.
Subsequent to submission of this review, a communication appeared from the Ahn group that describes the use of a rhodamine B derivative for the reaction-based detection of Ag+ ions and silver nanoparticles.61
6. Conclusion and prospects
Reaction-based indicators have been used with increasing success over the last two decades, and especially in the last 2–3 years. Compared to more classic supramolecular systems, the chemistry of reaction-based indicators is still in its infancy. Nevertheless, these generally stoichiometric systems can provide superior selectivity as a result of exploiting specific reactions that are less dependent than traditional receptor systems on the complementarity between the host and the guest. While clearly having antecedents in time-honored qualitative analysis, the idea of using design principles to produce reaction-based indicators represents a paradigm shift in supramolecular chemistry.
In terms of success achieved to date, reaction-based indicators for cyanide and Hg are currently well developed. However, other ions and toxic neutral guests are still challenging targets for reaction-based detection. In this respect, it may prove necessary to develop new reactions that respond to guests specifically. On the other hand, a range of applicable reactions may exist in the literature that are simply awaiting the attention of the indicator development community.
On a different level, there are tremendous opportunities and benefits that would be associated with increasing the detection limit of existing reactions, either by introducing better signal transmitting groups or developing better readout systems that would serve to amplify the analyte- and reaction-induced signal. Such approaches to improving sensitivity have been used to great effect in the area of supramolecular sensor chemistry, and some first examples of implementing this strategy in the context of reaction-based indicators are contained in this review. It is expected that many more will be seen in the years to come.
Acknowledgments
This work was supported by the National Institutes of Health (grant GM 58908 to J.L.S.).
Biographies

Professor Dong-Gyu Cho obtained his PhD in 2008 under the supervision of Professor Jonathan L. Sessler at the University of Texas, where he worked on oligopyrrole-based anion receptors, reaction-based cyanide anion indicators, and sapphyrin syntheses. He moved to the Scripps Research Institute, where he served as a post-doctoral fellow (supervisor: Professor M.G. Finn) while working on a B-cell hunting project that involved the combined use of viruses and click chemistry. In 2009, he started his independent research career as an Assistant Professor at Inha University in South Korea.

Professor Jonathan L. Sessler received a BS degree in chemistry in 1977 from the University of California, Berkeley. He obtained a PhD in organic chemistry from Stanford University in 1982 (supervisor: Professor James P. Collman). He was an NSF-CNRS and NSF-NATO Postdoctoral Fellow with Professor Jean-Marie Lehn at L’Université Louis Pasteur de Strasbourg, France. He was then a JSPS Visiting Scientist in Professor Iwao Tabushi’s group in Kyoto, Japan. In September 1984, he accepted a position as an Assistant Professor of Chemistry at the University of Texas at Austin, where he is currently the Roland K. Pettit Chair. Dr Sessler is a co-founder of two companies, Pharmacyclics, Inc. and Anionics, Inc.
Footnotes
This review is dedicated to one of the most inspirational leaders in the field of supramolecular chemistry, Dr Jean-Pierre Sauvage, on the occasion of his 65th birthday.
Contributor Information
Dong-Gyu Cho, Email: dgcho@inha.ac.kr.
Jonathan L. Sessler, Email: Sessler@mail.utexas.edu.
References
- 1.Arigaand K, Kunitake T. Supramolecular Chemistry: Fundamentals and Applications. Springer; Heidelberg: 2006. [Google Scholar]
- 2.A considerable body of literature exists that deals with this topic. See, for instance: Sessler JL, Gale PA, Cho W-S. Anion Receptor Chemistry. The Royal Society of Chemistry; Cambridge, UK: 2006. Beer PD, Gale PA. Angew Chem, Int Ed. 2001;41:486–516.Valeur B, Leray I. Coord Chem Rev. 2000;205:3–40.
- 3.Cyanohydrin reaction-based indicators differ from most other systems considered in this review in that they are for the most part based on reactions that are reversible.
- 4.Mohr GJ. Chem–Eur J. 2004;10:1082–1090. doi: 10.1002/chem.200305524. [DOI] [PubMed] [Google Scholar]
- 5.Kim YH, Hong JI. Chem Commun. 2002:512–513. doi: 10.1039/b109596j. [DOI] [PubMed] [Google Scholar]; Anzenbacher P, Jr, Tyson DS, Jursíková K, Castellano FN. J Am Chem Soc. 2002;124:6232–6233. doi: 10.1021/ja0259180. [DOI] [PubMed] [Google Scholar]
- 6.Koenig R. Science. 2000;287:1737–1738. doi: 10.1126/science.287.5459.1737. [DOI] [PubMed] [Google Scholar]
- 7.Chung YM, Raman B, Kim DS, Ahn KH. Chem Commun. 2006:186–188. doi: 10.1039/b510795d. [DOI] [PubMed] [Google Scholar]
- 8.Chen CL, Chen YH, Chen CY, Sun SS. Org Lett. 2006;8:5053–5056. doi: 10.1021/ol061969g. [DOI] [PubMed] [Google Scholar]
- 9.Ekmekci Z, Yilmaz MD, Akkaya EU. Org Lett. 2008;10:461–464. doi: 10.1021/ol702823u. [DOI] [PubMed] [Google Scholar]
- 10.Yang YK, Tae J. Org Lett. 2006;8:5721–5723. doi: 10.1021/ol062323r. [DOI] [PubMed] [Google Scholar]
- 11.Happ JW, Janzen EG, Rudy BC. J Org Chem. 1970;35:3382–3389. [Google Scholar]
- 12.Tomasulo M, Sortino S, White AJP, Raymo FM. J Org Chem. 2005;70:8180–8189. doi: 10.1021/jo051417w. [DOI] [PubMed] [Google Scholar]
- 13.Tomasulo M, Sortino S, White AJP, Raymo FM. J Org Chem. 2006;71:744–753. doi: 10.1021/jo052096r. and references cited therein. [DOI] [PubMed] [Google Scholar]
- 14.Lee KS, Kim HJ, Kim GH, Shin I, Hong JI. Org Lett. 2008;10:49–51. doi: 10.1021/ol7025763. [DOI] [PubMed] [Google Scholar]
- 15.Sessler JL, Cho DG. Org Lett. 2008;10:73–75. doi: 10.1021/ol7027306. [DOI] [PubMed] [Google Scholar]
- 16.Cho DG, Kim JH, Sessler JL. J Am Chem Soc. 2008;130:12163–12167. doi: 10.1021/ja8039025. [DOI] [PubMed] [Google Scholar]
- 17.Bonizzoni M, Fabbrizzi L, Taglietti A, Tiengo F. Eur J Org Chem. 2006:3567–3574. [Google Scholar]
- 18.Crystallographic evidence, see: Evans LS, Gale PA, Light MK, Quesada R. Chem Commun. 2006:965–967. doi: 10.1039/b517308f.
- 19.Kim TH, Swager TM. Angew Chem, Int Ed. 2003;42:4803–4806. doi: 10.1002/anie.200352075. [DOI] [PubMed] [Google Scholar]
- 20.Greene TW, Wuts PGM. Protective Groups in Organic Synthesis. 3. Wiley; New York: 1999. pp. 113–148. [Google Scholar]
- 21.Kim SK, Hong JI. Org Lett. 2007;9:3109–3112. doi: 10.1021/ol0711873. [DOI] [PubMed] [Google Scholar]
- 22.Shriver DF, Biallas MJ. J Am Chem Soc. 1967;89:1078–1081. [Google Scholar]; Katz HE. J Am Chem Soc. 1985;107:1420–1421. [Google Scholar]; Katz HE. J Org Chem. 1985;50:5027–5032. [Google Scholar]; Sole S, Gabbaï FP. Chem Commun. 2004:1284–1285. doi: 10.1039/b403596h. [DOI] [PubMed] [Google Scholar]
- 23.Chin CW, Gabbaï FP. J Am Chem Soc. 2006;128:14248–14249. doi: 10.1021/ja0658463. [DOI] [PubMed] [Google Scholar]
- 24.Hudnall TW, Gabbaï FP. J Am Chem Soc. 2007;129:11978–11986. doi: 10.1021/ja073793z. [DOI] [PubMed] [Google Scholar]
- 25.Gunnlaugsson T, Kruger PE, Jensen P, Pfeffer FM, Hussey GM. Tetrahedron Lett. 2003;44:8909–8913. [Google Scholar]
- 26.Christianson DW, Cox JD. Annu Rev Biochem. 1999;68:33–57. doi: 10.1146/annurev.biochem.68.1.33. [DOI] [PubMed] [Google Scholar]
- 27.Yamada K, Nomura Y, Citterio D, Iwasawa N, Suzuki K. J Am Chem Soc. 2005;127:6956–6957. doi: 10.1021/ja042414o. [DOI] [PubMed] [Google Scholar]
- 28.Antonino C, Venerando P. Tetrahedron. 1998;54:15027–15062. [Google Scholar]
- 29.Chae MY, Czarnik AW. J Am Chem Soc. 1992;114:9704–9705. [Google Scholar]
- 30.Zhang G, Zhang D, Yin S, Yang X, Shuai Z, Zhu D. Chem Commun. 2005:2161–2163. doi: 10.1039/b417952h. [DOI] [PubMed] [Google Scholar]
- 31.Liu B, Tian H. Chem Commun. 2005:3156–3158. doi: 10.1039/b501913c. [DOI] [PubMed] [Google Scholar]
- 32.Manimala J, Anslyn E. Eur J Org Chem. 2002:3909–3922. [Google Scholar]; Dahmen S, Bräse S. Org Lett. 2000;2:3563–3565. doi: 10.1021/ol006440c. [DOI] [PubMed] [Google Scholar]
- 33.Arunkumar E, Ajayaghosh A, Daub J. J Am Chem Soc. 2005;127:3156–3164. doi: 10.1021/ja045760e. [DOI] [PubMed] [Google Scholar]
- 34.Ros-Lis JV, Marcos MD, Martínez-Máñez R, Rurack K, Soto J. Angew Chem, Int Ed. 2005;44:4405–4407. doi: 10.1002/anie.200500583. [DOI] [PubMed] [Google Scholar]
- 35.Yang YK, Yook KJ, Tae J. J Am Chem Soc. 2005;127:16760–16761. doi: 10.1021/ja054855t. [DOI] [PubMed] [Google Scholar]
- 36.Wang X, Li Z, Wei B, Yang J. Synth Commun. 2002;32:1097–1103. [Google Scholar]; Zou X, Jin G. J Heterocycl Chem. 2001;38:993–996. [Google Scholar]
- 37.Song KC, Kim JS, Park SM, Chung KC, Ahn S, Chang SK. Org Lett. 2006;8:3413–3416. doi: 10.1021/ol060788b. [DOI] [PubMed] [Google Scholar]
- 38.Choi MG, Ryu DH, Jeon HL, Cha S, Cho J, Joo HH, Hong KS, Lee C, Ahn S, Chang SK. Org Lett. 2008;10:3717–3720. doi: 10.1021/ol8013446. [DOI] [PubMed] [Google Scholar]
- 39.Lee MH, Cho BK, Yoon J, Kim JS. Org Lett. 2007;9:4515–4518. doi: 10.1021/ol7020115. [DOI] [PubMed] [Google Scholar]
- 40.Song F, Watanabe S, Floreancig PE, Koide K. J Am Chem Soc. 2008;130:16460–16461. doi: 10.1021/ja805678r. [DOI] [PubMed] [Google Scholar]
- 41.Kroll H. J Am Chem Soc. 1952;74:2034–2036. [Google Scholar]; Kroll H. J Am Chem Soc. 1952;74:2036–2039. [Google Scholar]; Bender ML, Turnquist BW. J Am Chem Soc. 1957;79:1889–1893. [Google Scholar]
- 42.Dujols V, Ford F, Czarnik AW. J Am Chem Soc. 1997;119:7386–7387. [Google Scholar]
- 43.Kurti L, Czako B. Strategic Applications of Named Reactions in Organic Synthesis. Elsevier Academic Press; London: 2005. [Google Scholar]
- 44.Garrett CE, Prasad K. Adv Synth Catal. 2004;346:889–900. [Google Scholar]
- 45.Song F, Garner AL, Koide K. J Am Chem Soc. 2007;129:12354–12355. doi: 10.1021/ja073910q. [DOI] [PubMed] [Google Scholar]
- 46.Garner AL, Koide K. J Am Chem Soc. 2008;130:16472–16473. doi: 10.1021/ja8065539. [DOI] [PubMed] [Google Scholar]
- 47.Cotarca L. Phosgenation: A Handbook. Wiley-VCH; Cambridge, UK: 2004. [Google Scholar]
- 48.Zhang H, Rudkevich DM. Chem Commun. 2007:1238–1239. doi: 10.1039/b614725a. [DOI] [PubMed] [Google Scholar]
- 49.Barnham KJ, Masters CL, Bush AI. Nat Rev Drug Discovery. 2004;3:205–214. doi: 10.1038/nrd1330. [DOI] [PubMed] [Google Scholar]; Shah AM, Channon KM. Heart. 2004;90:486–487. doi: 10.1136/hrt.2003.029389. [DOI] [PMC free article] [PubMed] [Google Scholar]; Ohshima H, Tatemichi M, Sawa T. Arch Biochem Biophys. 2003;417:3–11. doi: 10.1016/s0003-9861(03)00283-2. [DOI] [PubMed] [Google Scholar]
- 50.Setsukinai K, Urano Y, Kakinuma K, Majima HJ, Nagano T. J Biol Chem. 2003;278:3170–3175. doi: 10.1074/jbc.M209264200. [DOI] [PubMed] [Google Scholar]; Lo LC, Chu CY. Chem Commun. 2003:2728–2729. doi: 10.1039/b309393j. [DOI] [PubMed] [Google Scholar]; Maeda H, Fukuyasu Y, Yoshida S, Fukuda M, Saeki K, Matsuno H, Yamauchi Y, Yoshida K, Hirata K, Miyamoto K. Angew Chem, Int Ed. 2004;43:2389–2391. doi: 10.1002/anie.200452381. [DOI] [PubMed] [Google Scholar]
- 51.Stone JR. Arch Biochem Biophys. 2004;422:119–124. doi: 10.1016/j.abb.2003.12.029. [DOI] [PubMed] [Google Scholar]; Negre-Salvayre A, Augé N, Duval C, Robbesyn F, Thiers JC, Nazzal D, Benoist H, Salvayre R. Methods Enzymol. 2002;352:62–71. doi: 10.1016/s0076-6879(02)52007-3. [DOI] [PubMed] [Google Scholar]
- 52.Lo LC, Chu CY. Chem Commun. 2003:2728–2729. doi: 10.1039/b309393j. [DOI] [PubMed] [Google Scholar]
- 53.Chang MCY, Pralle A, Isacoff EY, Chang CJ. J Am Chem Soc. 2004;126:15392–15393. doi: 10.1021/ja0441716. [DOI] [PMC free article] [PubMed] [Google Scholar]
- 54.Albers AE, Okreglak VS, Chang CJ. J Am Chem Soc. 2006;128:9640–9641. doi: 10.1021/ja063308k. [DOI] [PubMed] [Google Scholar]
- 55.Dickinson BC, Chang CJ. J Am Chem Soc. 2008;130:9638–9639. doi: 10.1021/ja802355u. and references cited therein. [DOI] [PMC free article] [PubMed] [Google Scholar]
- 56.Janowsky JV. Ber Dtsch Chem Ges. 1891;24:971–120. [Google Scholar]; von Meisenheimer J. Liebigs Ann Chem. 1902;323:205–120. [Google Scholar]; Jackson CL, Earle RB. Am Chem J. 1903;29:89–120. [Google Scholar]
- 57.Jenkins TF, Walsh ME. Talanta. 1992;39:419–428. doi: 10.1016/0039-9140(92)80158-a. [DOI] [PubMed] [Google Scholar]
- 58.Medary RT. Anal Chim Acta. 1992;258:341–346. [Google Scholar]
- 59.For Hg(II) selective systems, see: Lee MH, Wu JS, Lee JW, Jung JH, Kim JS. Org Lett. 2007;9:2501–2504. doi: 10.1021/ol0708931. and references cited therein.Zang XQ, Qian ZH, Zheng H, Su BY, Lan Z, Xu JG. Chem Commun. 2008:1859–1861. doi: 10.1039/b719473k.for Fe(III) selective systems, see: Xiang Y, Tong A. Org Lett. 2006;8:907–910. doi: 10.1021/ol060001h.for Cu(II) selective systems, see: Xiang Y, Tong A, Jin P, Ju Y. Org Lett. 2006;8:2863–2866. doi: 10.1021/ol0610340.
- 60.Kwon JY, Jang YJ, Lee YJ, Kim KM, Seo MS, Nam W, Yoon J. J Am Chem Soc. 2005;127:10107–10111. doi: 10.1021/ja051075b. [DOI] [PubMed] [Google Scholar]
- 61.Chatterjee A, Santra M, Won N, Kim S, Kim JK, Kim SB, Ahn KH. J Am Chem Soc. 2009;131:2040–2041. doi: 10.1021/ja807230c. [DOI] [PubMed] [Google Scholar]