

Abstract
Subtelomeric secondary metabolite (SM) gene clusters are frequently surrounded by DNA repeats and transposon-like elements. The A. nidulans penicillin cluster, 30 kb from the telomere of chromosome VI, is bordered by such elements. Deletions of penicillin telomere proximal and distal border regions resulted in decreased penicillin production. A 3.7 kb distal region called PbIa, consisting of the putative transposable element DNA-2, was examined further where its replacement by a pyrG marker presented a similar phenotype as loss of the global SM regulator LaeA, resulting in a decrease in penicillin gene expression and product formation. In contrast, placement of the pyrG marker on either side of PbIa had no effect on penicillin synthesis. A requirement for PbIa in penicillin production was also apparent in a histone deacetylase mutant, ΔhdaA, enhanced for penicillin production. Trans complementation of the PbIa element near and within the terrequinone A cluster on chromosome V did not restore penicillin biosynthesis or increase production of terrequinone A. Taken together, this data provides evidence for transposon involvement in SM cluster regulation.
Keywords: LaeA, HdaA, transposon, Mariner, penicillin, secondary metabolism, Aspergillus, subtelomere
Introduction
Secondary metabolites have a tremendous impact on society; some are exploited for their antibiotic and pharmaceutical activities, others are involved in disease interactions with plants or animals (Fox and Howlett, 2008). Due to this importance, much effort has focused on understanding the genetic regulation of secondary metabolite (SM) gene expression. One significant hallmark of fungal SM biosynthetic genes is their tendency to be clustered (Keller et al., 2005). This finding implies that fungal SMs share a common regulatory mechanism that is dependent on the organization of clustered biosynthetic genes.
In support of this hypothesis, Aspergillus SM gene clusters have been found to be globally regulated by nuclear complexes (Bok and Keller, 2004; Bok et al., 2009; Shwab et al., 2007). First identified was LaeA, a protein positively regulating expression of SM gene clusters in Aspergilli and Penicillium chrysogenum (Bok and Keller, 2004; Amaike and Keller, 2009; Bok et al., 2005; Kosalková et al., 2009). Disruption of this gene resulted in strains with lower levels of several SMs including penicillin in both Aspergillus and Penicillium spp. LaeA physically interacts with another nuclear protein, VeA in what is termed the Velvet complex (Bayrum et al., 2008) and disruptions of veA also resulted in decreased production of many SMs, again including penicillin (Kato et al., 2003; Myung et al., 2009; Dreyer et al., 2007). The mechanism by which the Velvet complex and/or its components regulate secondary metabolism is unknown but is speculated to work through chromatin remodeling.
Chromatin based regulation of SM clusters is supported by the finding that known histone modifying proteins regulate SM in Aspergillus (Bok et al., 2009; Shwab et al., 2007). For example, the histone deacetylase, HdaA, performs an opposing role to LaeA in regulating secondary metabolism in A. nidulans. Deletion of hdaA results in early and increased gene expression of biosynthetic genes for sterigmatocystin and penicillin. Additionally, hdaA partially remediates the ΔlaeA phenotype in A. nidulans, however seems to function in an independent pathway (Shwab et al., 2007). Deletion of hdaA also leads to altered production of certain SM in A. fumigatus (Lee et al., 2009). Chemical inhibition of histone deacetylases (HDACs) also increases production of SMs in several fungal species, suggesting that the regulatory function of HDACs in SM production may be conserved in filamentous fungi (Shwab et al., 2007; Williams et al., 2008). HDAC regulation of genes in other organisms is commonly associated with subtelomeric regions of chromosomes, a region characterized by repeated DNA sequences and transposable elements (TEs) or transposon-like (TL) elements (Lander et al. 2001; Pryde, 1997).
SM clusters in Aspergillus species also tend to be located near the telomeres of chromosomes (Perrin et al., 2007). One hypothesis is that chromatin mediated regulation of some of these SM clusters may hinge on location or numbers of these repeat/TL elements that interact in some matter with global regulators such as LaeA or histone modifying complexes. To assess this hypothesis, we have examined the role of several repeat/TL elements surrounding the subtelomeric penicillin gene cluster. This cluster is suggested to be horizontally transferred from bacteria and is surrounded by multiple repetitive sequence elements. The repetitive elements include putative transposons and transposable relics that contain low GC content. Here we present data supporting a positive role for several boundary elements in penicillin gene expression and product formation in both wild type and ΔhdaA backgrounds.
Materials and methods
Fungal strains and culture conditions
The strains used in the study are listed in Table 1. All strains were propagated at 37°C on glucose minimum medium (GMM) (Shimizu and Keller, 2001) with appropriate supplements and maintained as glycerol stocks at −80 °C.
Table 1.
Genotypes of A. nidulans strains and plasmids used in this study
| Strains and plasmids | Genotype |
|---|---|
| RDIT9.32 | veA |
| RJMP1.49 | pyrG89; pyroA4, ΔnkuA::argB; veA |
| RJMP1.19 | pyroA4, ΔnkuA::argB; veA |
| TMSI2 | pyrG89,pyroA4, ΔPbI::A. parasiticus pyrG, Δnku::argB, veA |
| TMSII2.4 | pyrG89,pyroA4, ΔPbII::A. parasiticus pyrG, Δnku::argB, veA |
| TMSIa1 | pyrG89,pyroA4, ΔPbIa::A. parasiticus pyrG, Δnku::argB, veA |
| TMSIb1 | pyrG89,pyroA4, ΔPbIb::A. parasiticus pyrG, Δnku::argB, veA |
| TMSIap9 | pyrG89,pyroA4, A. parasiticus pyrG proximal PbIa, Δnku::argB, veA |
| TMSIad1 | pyrG89,pyroA4, A. parasiticus pyrG distal PbIa, Δnku::argB, veA |
| pJW24 | Plasmid: A. parasiticus pyrG in p. blue script background |
| pMSII16 | Plasmid: 3′ flank of PbII in pJW24 |
| pMSII23 | Plasmid: 3′ and 5′ flank of PbII in pJW24 |
| RMS1 | ΔPbIa, veA |
| RMS1.1 | ΔPbIa, hdaA, veA |
| RMS1.2 | ΔPbIa, laeA, veA |
| RMS1.3 | A. parasiticus pyrG proximal to PbIa, veA |
| RMS1.4 | A. parasiticus pyrG distal to PbIa, veA |
| RJW 41.A | ΔlaeA, veA |
| RMS1.22 | ΔhdaA, veA |
| TJMP45.2 | ΔnkuA, veA |
| TJMP41.1 | ΔPbIa, nkuA, veA |
| TJMP42.3 | ΔPbIa, AfpyroA::TQ locus A, nkuA, veA |
| TJMP42.4 | ΔPbIa, AfpyroA::TQ locus A, nkuA, veA |
| TJMP46.4 | ΔPbIa, AfpyroA::PbIa TQ locus A, nkuA, veA |
| TJMP46.7 | ΔPbIa, AfpyroA::PbIa TQ locus A, nkuA, veA |
| TJMP43.3 | ΔPbIa, AfpyroA::TQ locus B, ΔnkuA, veA |
| TJMP43.4 | ΔPbIa, AfpyroA::TQ locus B, ΔnkuA, veA |
| TJMP47.12 | ΔPbIa, AfpyroA::PbIa TQ locus B, ΔnkuA, veA |
| TJMP47.13 | ΔPbIa, AfpyroA::PbIa TQ locus B, ΔnkuA, veA |
| TJMP44.3 | ΔPbIa, AfpyroA::TQ locus C, ΔnkuA, veA |
| TJMP44.4 | ΔPbIa, AfpyroA::TQ locus C, ΔnkuA, veA |
| TJMP48.8 | ΔPbIa, AfpyroA::PbIa TQ locus C, ΔnkuA, veA |
| TJMP48.9 | ΔPbIa, AfpyroA::PbIa TQ locus C, ΔnkuA, veA |
| TJW65.7 | pyroA4, pyrG89, ΔtdiB::pyroG, veA1 |
| Strains for sexual crosses: | |
| H4 | ΔhdaA::pyrG; chaA1; yA3; riboB2; veA1 |
| RJW135.1,2,3 | ΔlaeA,pyrG89,veA |
| RAMC22.1 | biA1, veA |
Generation of transformation cassettes and genetic manipulations
The constructs deleting PbI, PbIa and PbIb were generated by the double-joint PCR strategy (Yu et al., 2004) and ΔPbII mutants were obtained using plasmid construct MSII23 as described below. All the deleted areas are shown in Figure 1.
Figure 1. Diagram of penicillin chromosomal region and description of boundary regions.

Panel A. Schematic of the subtelomeric region of chromosome VI illustrates the penicillin gene cluster as well as the boundary elements PbI and PbII. For reference, Shwab et al. 2007 used AN2647 as a gene that was located outside of the penicillin biosynthetic gene cluster region. Automated gene calls from AspGD are depicted from the PbI region as well as transposable elements located in PbIa and PbIb regions. Both of these regions contain low GC content compared to the average of the A. nidulans genome. Diagram is drawn to scale.
Panel B. In order to investigate the roles of the repetitive elements Mariner-4, DNA-3, Mariner-1 and DNA-2 identified in PbI, two areas (PbIa and PbIb) were deleted using a gene replacement cassette harboring the A. parasiticus pyrG gene (depicted in gray). In order to rule out the phenotype was due to incorporation of the A. parasiticus pyrG gene into this genomic region, additional mutants were made by inserting A. parasiticus pyrG either proximally or distally to the PbIa region (PbIap and PbIad). Diagram is drawn to scale.
For the fusion PCR fragments, two amplified flanking fragments, 1–1.5 kb upstream and downstream of the targeted region, were amplified from genomic A. nidulans DNA by PCR. Primers and the created fragments used in this study are listed in Table 2. A fusion PCR reaction was set up for each of the three disruption cassettes PbI, PbIa and PbIb, with the two amplified flanking sequences and the A. parasiticus pyrG selectable marker. The A. parasiticus pyrG fragment was amplified from the plasmid vector pJW24 (Calvo et al, 2004). The fragments were fused into a single molecule and amplified with the external primers. The double-joint cassettes were confirmed by digestion with restriction enzymes and once confirmed, gel purified for fungal transformation.
Table 2.
PCR primer sets used in this study.
| Name of the primer | Oligonucleotide sequence (5′ to 3′) | Uses and Features |
|---|---|---|
| Region 1–5′ Flank For | GTACGGACTTCAACAATCCAC | 3′flank PbI |
| Region 1–5′ Flank Rev | CGATGATAAGCTGTCAAACATGAGAATTCGCTCCCCTTCATTCAATACCC | 3′flank PbI |
| Region 1–3′ Flank For | CCGTCCTGTGGATCCACTAGTTCTAGAGCGCTTATCTCAGGCCGTGTTCG | 5′flank PbI and 5′flank PbIb |
| Region 1–3′ Flank Rev | AACGCGTTTACATAGCTGCC | 5′flank PbI and 5′flank PbIb |
| A. para. pyrG For | CGAATTCTCATGTTTGACAGC | A. parasiticus pyrG marker |
| A. para pyrG Rev | CGCTCTAGAACTAGTGGATCC | A. parasiticus pyrG marker |
| Region 2–5′ Flank (EcoRI) For | TAAGGAATTCTAGTTAGGGGACAGCC | 5′flank PbII |
| Region 2–5′ Flank (EcoRI) Rev | GGACGAATTCCAGTGGCATCCTTGAGG | 5′flank PbII |
| Region 2–3′ Flank (BamHI) For | GAACGGATCCTGAGCCCACCACATTG | 3′flank PbII |
| Region 2–3′ Flank (XbaI) Rev | CTGATCTAGACCCAAACTATGTCCTATC | 3′flank PbII |
| 5 Reg 1 (a) For | CGTACTCCCAATGTACAAACCA | 3′flank PbIa and 3′flank PbIad construct. |
| 5 Reg 1 (a): Rev | CGATGATAACTGTCAAACATGAGAATTCGAATAACAGCACACTCCTCCTGC | 3′flank PbIa and 3′flank PbIad construct. |
| 3 Reg 1 (a) For: | GTCCTGTGGATCCACTAGTTCTAGAGCGGATGTCTGGGTAAAGGCGCCAT | 5′flank PbIa, 5′PbIap construct, 5′flank Southern probe of ΔPbIa and 5′PbIap. |
| 3 Reg 1 (a): Rev | GCTGATTAGCGCTAGGAGCAAG | 5′flank PbIa, 5′PbIap construct and PCR screening progeny of ΔPbIa. |
| Reg. 1 (b) For | ACTGTATGGTGAGATACCAGAG | 3′flank PbIb |
| Reg. 1 (b) Rev | CGATGATAAGCTGTCAAACATGAGAATTCGAAGGTGCTACCTACCCTCCTCA | 3′flank PbIb |
| Pre Reg. (I) For. | GCTAGAGAGCCTTAGGATCCTA | PCR screening of the ΔPbI PCR screening of the ΔPbI, 5′ |
| Mid. Reg. (I) Rev | TACCTAGCGAATACCTTCTGCG | flank Southern probe ΔPbIa and PbIap. |
| Pre Reg. (I, a) For | GCAACGTGGGAACGCATTACTT | PCR screening of the ΔPbIa |
| Pre Reg. (I, b) For. | CCTCGATACGCAATCCTCAAAG | PCR screening of the ΔPbIb |
| Pre Reg. (II) For. | GAGGTGGATGTAATCCAGCAAG | PCR screening of the ΔPbII |
| JP A Para PyrG short Rev HindIII | TACGGAAGCTTATACGAACAGATGG | PCR screening of ΔPbI, ΔPbII, ΔPbIa, ΔPbIb, PbIap and screening progeny of PbIad. |
| JP gpdA internal For. | GAAGGGTGGTGCCAAGAAG | PCR of gpdA |
| JP gpdA internal Rev. | CAACGGAGACGTTGGAGGT | PCR of gpdA |
| Reg.I prob. F | TCAAGTCTAAGCAGACAGAGGC | 3′Flank Southern probe ΔPbI |
| Reg.I prob. R. | CACAGCCACTTAAGCCTATACC | 3′flank Southern probe ΔPbI |
| I(a) 5 For Prob | GCCTTGAATCAAGCGGTTAG | 3′flank Southern probe ΔPbIa and PbIad. |
| I(a) 5 Rev Prob | TTAGGCTTCACTGCTGACAG | 3′flank Southern probe ΔPbIa and PbIad |
| Reg.I (b) prob. F. | GTTGAGAGGGTAATGTACCAGC | 3′flank Southern probe ΔPbIb |
| Reg.I (b) prob. R. | GCTATAGCCTGGATCGTGGTTA | 3′flank Southern probe ΔPbIb |
| Reg.II. prob. F. | ATTTCAACGTGCCTGGAGCAAC | 3′flank Southern probe ΔPbII |
| Reg.II. prob. R. | AGCTCTGAGCAGTGTTAGTTGC | 3′flank Southern probe ΔPbII |
| Reg (I) 3′For. Prob | AGTGCATCCCTAGTGGCTAC | 5′flank Southern probe ΔPbI and PbIb |
| Reg (I) 3′Rev. Prob | GACACAGTGCACCTTTAGGG | 5′flank Southern p robe ΔPbI and PbIb |
| Reg (II) 3′For. Prob: | CTTGTCTGGCTCTGCTGGTG | 5′flank Southern probe ΔPbII |
| Reg (II) 5′Rev. Prob (2) | TGCTGACCAAACTAGCTGGCAC | 5′flank Southern probe ΔPbII |
| PyrG (1KB) F | GTTTGTGATGGGATTCGTCTCG | pyrG probe and screening progeny PbIad |
| PyrG (R): | ATAGTGGCTCCAAGTAGCGAAG | PyrG probe |
| Sp Ia for | CTAATGCAAGCTCGACCTACAG | Screening progeny for ΔPbIa and PbIap. |
| 3′PyrG-Ia. F | GTCCTGTGGATCCACTAGTTCTAGAGCGAAACTACTAATAACATGGTGC | 5′ flank PbIad construct. |
| 3′PyrG-Ia. R | TACCAACAACCTTAGTAATAGTCC | 5′ flank PbIad construct and screening progeny of PbIad. |
| 5′ Ia-PyrG. F | GGACAGGTCTGACTTAGACTGG | 3′ flank PbIap construct |
| 5′ Ia-PyrG. R | ATGATAAGCTGTCAAACATGAGAATTCGAACGGGCTGATTGGGCAGCC | 3′ flank PbIap construct |
| LaeA1 | ATCTACCTTTCTGGGCTCCTGG | Screening progeny for ΔlaeA |
| LaeA2 | CGTGAAGAACTTGGCGTTGTAG | Screening progeny for ΔlaeA |
| HdaA for | GATGACATCGAATCAACCAGGC | Screening progeny for ΔhdaA |
| HdaA Rev | TACATGCACTTCCAGTAGTCGG | Screening progeny for ΔhdaA |
| Int NK for | GACGTGAGTACAGTTCCTGC | Screening progeny for ΔnkuA |
| Int NK rev. | CCAAGAACTGGACTAGCAGC | Screening progeny for ΔnkuA |
| VeA+for | TGTGTTATCCCATCAAGAGG | Screening progeny for VeA |
| VeA+ rev | CTTGGCGCTGTAGACGATAA | Screening progeny for VeA |
| IPNA for | ATGGGTTCAGTCAGCAAAGCC | ipnA probe |
| IPNA rev | CTCCTCTTTGCCTAATGCCAAG | ipnA probe |
| penDEF | ACGAATCCGGTTGGCATCGGC | penDE probe |
| penDER | TGAGCTCTGTGACCTGCTGGC | penDE probe |
| JP A fumi pyroA For | CGGAGTATTGACATTGCATTGG | Amplification of AfpyroA |
| JP A fumi pyroA Rev | TCAGGGTGTGTATTCAAGTTCG | Amplification of AfpyroA |
| JP PbIa Comp For | CTACTAATAACATGGTGCAAATTCTG | Amplification of PbIa |
| JP PbIa Comp Rev | TTTACCCAGACATCAACGGG | Amplification of PbIa |
| JP PbIa/Pyro Marker Rev | CAGAATTTGCACCATGTTATTAGTAGTCAGGGTGTGTATTCAAGTTCG | Fusion of PbIa/AfpyroA |
| JP PbIa/Pyro Marker For | CGAACTTGAATACACACCCTGACTACTAATAACATGGTGCAAATTCTG | Fusion of PbIa/AfpyroA |
| JP TQ Insert A 5′ Flank For | AGTGCTCGTTTCGAGTCAGC | 5′ Flank Insert A |
| JP TQ Insert A 5′ Flank Rev | GCTTCCCCAATGCAATGTCAATACTCCGGGATAGGCATCCCATATGAG | 5′ Flank Insert A |
| JP TQ Insert A 3′ Flank For | CCAATCAGCCCGTTGATGTCTGGGTAAACCTATCCTGAAGGTGCCAAC | 3′ Flank Insert A |
| JP TQ Insert A (pyroA) 3′ Flank for | AACGCCGAACTTGAATACACACCCTGACCTATCCTGAAGGTGCCAAC | 3′ Flank Insert A |
| JP TQ Insert A 3′ Flank Rev | CAAGGAACAGCTGGAGATCC | 3′ Flank Insert A |
| JP TQ Insert B 5′ Flank For | TCAGTCCACCTGATCGAACAG | 5′ Flank Insert B |
| JP TQ Insert B 5′ Flank Rev | GCTTCCCCAATGCAATGTCAATACTCCGGGCTATTCTGGGATACGAAGC | 5′ Flank Insert B |
| JP TQ Insert B 3′ Flank For | CCAATCAGCCCGTTGATGTCTGGGTAAAAACATTTATCCGGAGACTCGC | 3′ Flank Insert B |
| JP TQ Insert B (pyroA) 3′ Flank for | AACGCCGAACTTGAATACACACCCTGAAACATTTATCCGGAGACTCGC | 3′ Flank Insert B |
| JP TQ Insert B 3′ Flank Rev | CTCAGGCTACTACTACCATG | 3′ Flank Insert B |
| JP TQ Insert C 5′ Flank For | CGGACGATGGACTAAGCTTAC | 5′ Flank Insert C |
| JP TQ Insert C 5′ Flank Rev | GCTTCCCCAATGCAATGTCAATACTCCGTGAGGTACTCCGAATAGAG | 5′ Flank Insert C |
| JP TQ Insert C 3′ Flank For | CCAATCAGCCCGTTGATGTCTGGGTAAACTCGAAGGGTAAAGCTCAGCG | 3′ Flank Insert C |
| JP TQ Insert C (pyroA) 3′ Flank for | AACGCCGAACTTGAATACACACCCTGACTCGAAGGGTAAAGCTCAGCG | 3′ Flank Insert C |
| JP TQ Insert C 3′ Flank Rev | ACACTCCAAGACGGTCGAAG | 3′ Flank Insert C |
| JP TQ Insert A 5′ Flank QC For | GATTACGCCAAGCTATTTAGGTGACACAGTGCTCGTTTCGAGTCAGC | Quick Change 5′ Flank Insert A |
| JP TQ Insert B 5′ Flank QC For | GATTACGCCAAGCTATTTAGGTGACACTCAGTCCACCTGATCGAACAG | Quick Change 5′ Flank Insert B |
| JP TQ Insert C 5′ Flank QC For | GATTACGCCAAGCTATTTAGGTGACACCGGACGATGGACTAAGCTTAC | Quick Change 5′ Flank Insert C |
To examine the possibility of marker gene and location effect for the PbIa region, A. parasiticus pyrG was also inserted telomere proximal and telomere distal of PbIa. The insertion cassettes were generated by double joint PCR with the two amplified flanking sequences 5′ flank and 3′ flank of the insertion point and the A. parasiticus pyrG selectable marker to create PbIad (distal) and PbIap (proximal) mutants (Fig. 1B). The double-joint cassettes were confirmed by digestion with restriction enzymes, gel purified for fungal transformation.
Plasmid pMSII23 was constructed for the disruption of the PbII region. The 3′ and 5′ flanking regions (1.4 kb) of PbII were amplified from A. nidulans DNA by PCR using primers designated in Table 2. The 3′ flank was ligated into HindIII/XbaI site of the pJW24 vector to create pMSH16. The 5′ flank fragment was then ligated into the EcoRI site of pMSH16 to create the final PbII deletion plasmid pMSHII23.
Fungal transformation was carried out according to Miller et al. (1985) using A. nidulans strain RJMP1.49 as the recipient host. Five μg of the double joint PCR cassettes were used to i) delete regions PbI, PbIa and PbIb, ii) insert pyrG upstream and downstream of Ia regions and 10 μg of the plasmid pMSII23 was used to delete the PbII region. Putative deletion strains were verified by PCR and Southern blot analysis. Southern blot analysis was performed using 5′ flank, 3′ flank and pyrG probes for each mutant (Fig. 3, Fig. 4A, Fig. 4B). All of the Pb regions contained multiple repeats throughout the genome thus eschewing their use for Southern analysis.
Figure 3. Deletion of the penicillin boundary regions decreases penicillin production and penicillin gene expression.

Panel A. Histogram showing relative production of penicillin by isogenic wild type, PbI and ΔPbII mutants (RJMP1.19, TMSI2 and TMSII2.4 respectively). Penicillin was extracted from 72 hrs liquid shake cultures in triplicate according to standard cultural conditions, with or without addition of uracil and uridine and quantified using a bacterial growth inhibition assay. Wild type production levels were assigned a value of 100%, and all other production levels are presented relative to the wild type. The error bars represent the standard error. Different letters above the bars represent statistical differences at P ≤ 0.05 according to Tukey-Kramer.
Panel B. Wild type, ΔPbI and ΔPbII mutants (RJMP1.19, TMSI2 and TMSII2.4 respectively) were grown on GMM supplemented with pyridoxine with and without addition of uracil and uridine. Addition of uracil and uridine partially remediates growth and developmental deficiencies of Delta;PbII. MM = glucose minimal medium without addition of uracil and uridine, UU+ = addition of uracil and uridine.
Panel C. Histogram showing relative production of penicillin by wild type, ΔPbI, ΔPbII, ΔPbIa and ΔPbIb mutants (RJMP1.19, TMSI2, TMSII2.4, TMSIa1 and TMSIb1 respectively). Penicillin was extracted from 72-hrs liquid shake cultures in triplicate and quantified using a bacterial growth inhibition assay. For the histograms, wild type production levels were assigned a value of 100%, and all other production levels are presented relative to the wild type. The error bars represent the standard error. Different letters above the bars represent statistical differences at P ≤ 0.05 according to Tukey-Kramer.
Panel D. Northern blots showing expression of the penicillin cluster genes ipnA (wild type = RDIT9.32 and ΔPbIa = RMS1) and penDE (WT = RDIT9.32 and ΔPbIa = RMS1). RNA was extracted after 24, 48, and/or 72 hrs of growth in liquid shake cultures. Only the 48 hr time point is shown for penDE expression. Ethidium bromide-stained rRNA is shown as a loading control.
Figure 4. Schematic representation and Southern blot for the insertion of the marker gene A. parasiticus pyrG telomere proximal and distal of the PbIa region and the lack of the effect of insertion on penicillin production.

Panel A. To determine the insertion of pyrG telomere proximal of PbIa (PbIap mutants), genomic DNAs were digested with XbaI where the expected hybridization band patterns using A. parasiticus pyrG as a probe; no band is expected in the wild type strain and a 4.5 kb band for PbIap mutants. Upon using probe 1, the wild type shows 7.5 and 2.65 kb bands and the PbIap transformants shows 7.5 and 1.2 kb bands.
Panel B. For insertion of pyrG distal of PbIa (PbIad mutants), the expected hybridization band patterns by a NcoI digestion using a 794 bp fragment (probe 2) are a 11.3 kb band for the wild type strain and a 7.1 kb band for PbIad strains. When A. parasiticus pyrG was used as a probe, no band is expected in the wild type strain and 5.9 and 1.1 kb bands for PbIad mutants.
Panel C. Penicillin was extracted from 72 hrs liquid shake cultures in triplicate and quantified using a bacterial growth inhibition assay. For the histograms, wild type production levels were assigned a value of 100%, and all other production levels are presented relative to the wild type. The error bars represent the standard error. Different letters above the bars represent statistical differences at P ≤ 0.05 according to Tukey-Kramer multiple comparison test.
For panels A and B the probes are indicated by horizontal lines. Marker ladder is in the right most lane of figures in panels A and B. WT = wild type, pyrG = Aspergillus parasiticus pyrG.
Complementation of the PbIa region was conducted by inserting the A. fumigatus pyroA gene fused to the PbIa sequence at three locations near the terrequinone A cluster (Fig. 5A). Using fusion PCR, the PbIa sequence was fused independently to the three 3′ flanking regions (corresponding to insertion A, B, and C) and subsequently cloned into pCR Blunt II TOPO (Invitrogen). Resulting intermediate plasmids pJMP25, pJMP26, and pJMP27 respectively, were subjected to quick change PCR mutagenesis (Stratagene) to insert the corresponding 5′ flanking region fused to A. fumigatus pyroA. The resulting plasmids containing full-length insertion cassettes pJMP28, pJMP29, and pJMP30 were used for template DNA for PCR of the full-length transformation cassette. Standard double-joint PCR was used to generate identical insertion cassettes that contained only the A. fumigatus pyroA gene. These constructs were transformed into A. nidulans TMS1a1 and were subsequently confirmed by Southern analysis. Construction of isogenic lines harboring the nkuA allele were created by transforming RJMP1.19 and TMS1a1 with pJW53, which contains of the pyroA gene from A. nidulans. Subsequent transformants were isolated, TJMP45.2 (ΔnkuA, veA+) and TJMP41.1 (ΔPbIa, ΔnkuA, veA+), and used for comparison of these strains.
Figure 5. PbIa complementation at the terrequinone A locus does not restore penicillin production.

Panel A. Schematic of the terrequinone A cluster located on chromosome V. Insertion of the PbIa fragment (3.7 kb) was done at three locations: the flanking region before the cluster (A), in the middle of the cluster (B), and the flanking region after the cluster (C). This was accomplished by fusing the A. fumigatus pyroA gene to the PbIa fragment in addition to 5′ and 3′ flanking regions to target the construct to the desired location. Control strains were constructed that only contained the A. fumiagtus pyroA gene inserted at the same locations. Insertional complementation mutants were confirmed by Southern analysis by using wild type DNA as a probe. Expected banding patterns of a NcoI digestion for the A insertion were: WT – 2.7 kb, ΔPbIa – 2.7 kb, TJMP42 – 3.3 kb and 2.2 kb, and TJMP46 – 6.0 kb and 3.3 kb. A NcoI digestion for insertion B resulted in the following expected bands: WT – 2.3 kb, ΔPbIa 2.3 kb, TJMP43 – 3.0 kb and 2.2 kb, TJMP47 – 6.0 kb and 3.0 kb. Expected banding patters of a BamHI digestion for insertion C were: WT – 3.7 kb, ΔPbIa – 3.7 kb, TJMP44 – 4.0 kb and 2.4 kb, TJMP48 – 7.8 kb and 2.4 kb.
Panel B. A bioassay for penicillin production was done with extracts from 72 hr liquid shake cultures in GMM supplemented with pyridoxine and uracil/uridine. Histograms represent the zone of inhibition normalized to wild type levels. None of the complementation mutants restored penicillin production. (WT = TJMP45.2, ΔPbIa = TJMP41.1)
Panel C. Terrequinone A production was assayed by a chloroform extract 4-day cultures grown on Champs solid media. Subsequent extracts were analyzed via think layer chromatography using hexane:ethyl acetate (4:1) as a solvent system. A ΔtdiB strain (TJW65.7) was used to determine the spot corresponding to terrequinone A.
Sexual crosses of A. nidulans strains were conducted according to standard methods (Pontecorvo et al., 1953). Strain genotypes were identified by PCR amplification of the correct allele.
Penicillin bioassay and terrequinone A analysis
Aspergillus nidulans control and mutants were inoculated (106 spores/ml) into 50 ml of liquid shake GMM at 250 rpm and grown at 37°C. After 3 days, 10 ml were lyophilized and then resuspended in 1 ml of distilled water where 100 μl were used to assess for penicillin activity towards Micrococcus spp. according to Bok et al. (2004). For the PbIa complementation assay (Fig. 5), the penicillin assay was conducted as above except for GMM was supplemented with 1 ml/L of 0.1% pyridoxine-HCl and 5 mM uracil and uridine. Terrequinone A was analyzed via thin layer chromatography (TLC) of chloroform extracts from four day old point inoculated cultures grown on Champs solid media (20 g glucose, 5 g yeast extract, 1 ml trace elements, 1 ml 0.1% pyridoxine HCl, 5 mM uridine, 5 mM uracil, 15 g agar in 1 liter). Hexane:ethyl acetate (4:1) was used as a solvent for TLC and a null mutant of tdiB was used to determine the spot corresponding to terrequinone A.
Nucleic acid analysis
DNA extraction, digestion with restriction enzyme, gel electrophoresis, blotting, hybridization, and probe preparation were performed by standard methods (Sambrook and Russell, 2001).
mRNA studies
Extractions were made from mycelia of cultures (106 spores/ml) grown in 50 ml liquid GMM at 37°C for 24 and 48 hrs with shaking at 250 rpm. Mycelium was harvested at various developmental stages (24, 48 and/or 72hrs) and lyophilized. RNA was extracted using Trizol (Invitrogen) according to the manufacturer’s instructions approximately 30 μg of total RNA was used for RNA blot analysis. RNA blots were hybridized with ipnA and penDE and the PbIa DNA fragment which were generated by PCR using gene-specific primers as shown in Table 2. All experiments were performed in duplicate or triplicate.
Statistical analysis
For statistical analyses, Excel data analysis package was used to calculate the mean, standard variation of the mean and standards error. Data were analyzed using the JMP software package (version 0.0.8; SAS Institute, Inc, Cary, NC, U.S.A.). Mean comparisons of the effect of the different mutants on the production of penicillin were calculated according to the Tukey-Kramer multiple comparison test at P ≤ 0.05. Mean values with different letters are significant.
Results
Deletion of proximal and distal boundary regions decrease penicillin production
The boundaries of the penicillin gene cluster, PbI (penicillin boundary I) and PbII, were obtained from the Aspergillus comparative database (www.broad.harvard.edu/annotation/genome/aspergillus_group/). Previous work had not detected gene expression, other than the penicillin biosynthetic genes, in these regions under the growth conditions used in this study (Shwab et al. 2007). Deletion of the PbI (35 kb) and PbII (30 kb) loci were obtained by the replacement of both regions by A. parasiticus pyrG as schematically represented in Fig. 1. The correct gene replacement transformants, as determined by DNA fragment patterns in Southern blot analysis, confirmed replacement of the two loci with A. parasiticus pyrG (Fig. 2A and 2B). The two transformants used for this study were named TMSI2 (ΔPbI) and TMSII2.4 (ΔPbII).
Figure 2. Schematic representation and Southern blot for the replacement of the PbI, PbII, PbIa and PbIb regions with the A. parasiticus pyrG selectable marker.
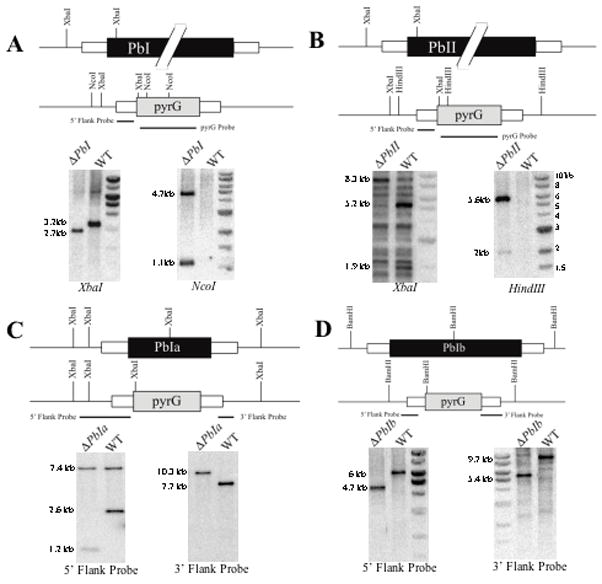
Panel A. To determine deletion of PbI, genomic DNAs were digested with XbaI and NcoI where the expected hybridization band patterns by XbaI digestion using the 5′ PbI flank as a probe are a 3.2 kb band for the wild type strain and a 2.7 kb band for ΔPbI transformants. When A. parasiticus pyrG was used as a probe, there is no expected hybridization band pattern by NcoI digestion of the wild type strain and 4.7 and 1.1 kb fragments for ΔPbI mutants.
Panel B. To determine deletion of PbII, expected hybridization band patterns by XbaI digestion using the 5′ PbII flank as a probe are 5.2 and 1.9 kb bands for the wild type strain and a 8.3 kb band for ΔPbII strains. When A. parasiticus pyrG was used as a probe, the expected hybridization band patterns by HindIII digestion are no band for the wild type strain and 5.6 and 2 kb bands for ΔPbII mutants. It was not possible to find unique DNA sequences in the region of the genome and hence the presence of multiple hybridization fragments. PCR analysis supported the deletion of this region (data not shown).
Panel C. To determine deletion of PbIa, genomic DNAs were digested with XbaI where the expected hybridization band patterns using the 5′ PbIa flank as a probe are 7.4 and 2.6 kb bands for the wild type strain and 7.4 kb and 1.2 kb bands for ΔPbIa strains. When the 3′ flank was used as a probe, the expected hybridization band patterns by XbaI digestion are 7.7 kb for the wild type strain and 10.3 kb for ΔPbIa mutants.
Panel D. To determine deletion of PbIb, expected hybridization band patterns by BamHI digestion using the 5′ PbIb flank as a probe are a 6 kb band for the wild type strain and a 4.7 kb band for ΔPbIb strains. When the 3′ PbIb flank was used as a probe, the expected hybridization band patterns by BamHI digestion are 9.7 kb band for the wild type strain and 5.4 kb for ΔPbIb mutants.
For all panels the probes are indicated by horizontal lines. Marker ladder is in the right most lane of most figures but left most in the second figure in Panel D and not shown in Panel C. WT = wild type, pyrG = Aspergillus parasiticus pyrG.
Both ΔPbI and ΔPbII produced less penicillin than the isogenic control (RJMP1.19, Fig. 3A). The PbI mutant displayed an indistinguishable growth phenotype from the control but the PbII mutant showed a reduction of growth and altered pigment production under standard culture conditions (Fig. 3B). Addition of uracil and uridine to the growth medium had no effect on the PbI mutant or wild type but did partially restore wild type growth, although not penicillin synthesis, to ΔPbII (Fig. 3) thus indicating that the reduction in growth of the ΔPbII mutant is a result of lower pyrG expression.
PbIa and PbIb loss reduces penicillin production
Due to the morphological aberrancies of ΔPbII that could affect penicillin production, further study was directed to the PbI region as the ΔPbI mutant demonstrated only a penicillin phenotype with no detectable morphology alteration. In order to refine the regions of PbI affecting penicillin production, we created two PbI internal replacement strains deleted for 3.7 Kb (ΔPbIa) and 11.2 Kb (ΔPbIb) respectively. These regions were chosen as they consisted of repeats and TE/TL elements (Fig. 1A). PbIa contains a transposon relic known as DNA-2 (Kapitonov and Jurka 2003a). This region has a very low GC content (36%) and thus unlikely to be transcribed. There are two locations in the genome with greater than 90% homology to this entire region with other smaller areas of homology in other regions of the genome. PbIb contains a MATE-4 element that is flanked by two apparently intact Mariner transposases (Clutterbuck 2004; Kapitonov and Jurka 2003c; Kapitonov and Jurka 2003d). This latter entire region is referred to as DNA-3 based on Repbase database (Kapitonov and Jurka, 2003b), and similar to PbIa is low in GC content (42%). The A. nidulans genome has an average of 50% GC content (Wortman et al., 2008).
The correct gene replacement transformants were screened with PCR and confirmed by Southern analysis (Fig. 2C and 2D). Five transformants of each genotype were examined for penicillin production and all transformants gave the same result, a decrease in penicillin production (Fig. 3C). Focusing on the smallest segment, one PbIa deletant (TMSIa1) was crossed to RAMC22.1 to generate a prototrophic strain lacking only the 3.7 kb fragment (strain RMS1). Bioassays again demonstrated a significant decrease in penicillin production compared to wild type (Fig. 4B). Furthermore, Northern blot analysis showed that the expression of the ipnA and penDE genes were decreased in RMS1 as compared to the wild type (Fig. 3D), thus confirming the penicillin assay results.
Insertion of pyrG upstream and downstream of PbIa does not affect penicillin production
We considered it possible that the decrease in penicillin could be due to marker gene effect, e.g. the placement of pyrG at this location in the genome. To examine this possibility, A. parasiticus pyrG was inserted immediately telomere proximal (PbIap) and distal (PbIad) of PbIa generating the transformants TMSIap9 (proximal) and TMSIad1 (distal) (Fig. 1B and Fig. 4A and 4B). These transformants were sexually crossed with RAMC22.1 to generate prototrophic strains RMS1.3 (PbIap) and RMS1.4 (PbIad) respectively. A comparison of penicillin production between wild type RDIT9.32, ΔPbIa, PbIap, and PbIad showed that only the PbIa mutant was significantly reduced in penicillin production (Fig. 4C).
PbIa trans-complementation does not restore penicillin production
We also attempted to validate the observation that loss of PbIa results in decreased penicillin production by positionally complementing the ΔPbIa lesion by reinsertion of the PbIa fragment. However, despite repeated efforts, we were unable to place PbIa back at the native locus. Using a standard complementation approach, we were, however, able to re-insert the PbIa fragment at three locations at the terrequinone A gene cluster, the flanking region before the cluster (A), in the middle of the cluster (B) and the flanking region after the cluster (C) (Fig. 5A). None of the resulting complementation mutants were able to restore PN production (Fig. 5B). To assess any affect that PbIa might have on the terrequinone A cluster, we analyzed terrequinone A via thin layer chromatography (Fig. 5C). While terrequinone A levels were slightly higher in the ΔPbIa mutant compared to wild type, insertion of the PbIa fragment did not alter production of terrequinone A when compared to the ΔPbIa strain.
Effect of loss of PbIa on penicillin production in ΔlaeA and ΔhdaA backgrounds
LaeA is a global regulator of SM cluster activation and loss of laeA leads to a repression of SM production (Bok and Keller, 2004). This loss of SM production is partially remediated by deletion of the histone deacetylase HdaA, however appears to work independent of LaeA (Shwab et al., 2007). In A. nidulans, HdaA is involved in regulation of the telomere-proximal penicillin and sterigmatocystin gene clusters. The hdaA deletion strain produces higher amounts of penicillin than wild type (Shwab et al., 2007).
To determine if PbIa is important in LaeA or HdaA function, we examined penicillin production in double mutant backgrounds. As expected, a double ΔPbIa;ΔlaeA mutant produced no detectable penicillin production (Fig. 6C), nor was ipnA or penDE expressed in this strain (Fig. 6A). As all three mutants (both single deletants as well as double deletant ΔPbIa;ΔlaeA) did not produce penicillin in our comparison assay, it was not possible to determine if there was an additive negative effect of these two deletions in the same background. However, deletion of PbIa statistically reduced penicillin production in the ΔhdaA background (Fig. 6C). Examination of ipnA and penDE expression in the ΔPbIa;ΔhdaA double mutant compared to ΔhdaA single mutant showed a detectable decrease in the expression of ipnA but not penDE in the double mutant (Fig. 6B), the former correlating with the penicillin assay.
Figure 6. Penicillin production and gene expression in global regulatory mutants.
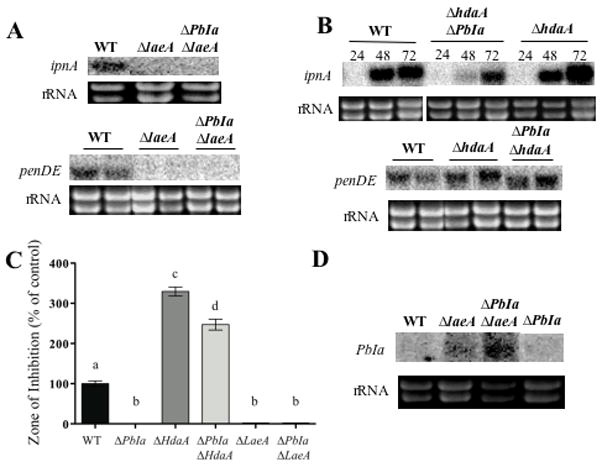
Panel A. Northern blots showing expression of the penicillin cluster genes ipnA and penDE by wild type (WT), ΔlaeA and ΔPbIa;ΔlaeA mutants (RDIT9.32, RJW41.A and RMS1.2 respectively) at 48 hrs of growth in liquid shake cultures. Ethidium bromide-stained rRNA is shown as a loading control.
Panel B. Northern blots showing expression of the penicillin cluster genes ipnA and penDE by wild type (WT), ΔPbIa, ΔhdaA and ΔhdaA mutants (RDIT9.32, RMS1.1 and RMS1.22 respectively). RNA was extracted after 24, 48, and/or 72 hrs of growth in liquid shake cultures. Only the 48 hr period is shown for the penDE gene. Ethidium bromide-stained rRNA is shown as a loading control.
Panel C. Penicillin was extracted from 72-hrs liquid shake cultures in triplicate and quantified using a bacterial growth inhibition assay. For the histograms, WT production levels were assigned a value of 100%, and all other production levels are presented relative to the WT. The error bars represent the standard error. Different letters (a, b, c and d) above the bars represent statistical differences at P ≤ 0.05 according to Tukey-Kramer multiple comparison test.
Panel D. Probing with the 3.7 kb PbIa fragment shows no expression in WT and the ΔPbIa mutant strain (RDIT9.32 and RMS1 respectively) in liquid shake culture for 48 hr. However, a transcript is expressed in ΔlaeA and ΔPbIa;ΔlaeA mutants. Ethidium bromide-stained rRNA is shown as a loading control.
Finally, Northern analysis of the PbIa region was performed to discount any effect on penicillin production by a putative gene located in this region. As seen in Figure 5D, there was neither transcript in wild type nor ΔPbIa. Interestingly however, both of the two strains containing a ΔlaeA allele showed the presence of a small transcript. This was interpreted to mean that LaeA negatively regulated regions in the genome bearing DNA-2 sequences. Since there are at least three repeats of the DNA-2 element in the genome, we were unable to determine which areas are actively transcribed in this mutant.
Discussion
Secondary metabolites are of intense interest to humankind due to their pharmaceutical and toxic properties. The regulation of secondary metabolism in fungi is complex, involving multiple proteins and complexes that respond to various environmental and host stimuli. Great efforts have been made to understand these processes in the model fungus A. nidulans. The clustering of biosynthetic and regulatory genes and the genetic connection linking secondary metabolite biosynthesis through a global regulation pathway (Keller et al., 2005) suggest that the boundary of these clusters may carry regulatory elements that affect the production of SMs. The identification of such regulatory elements would contribute to a broader understanding of molecular mechanisms by which secondary metabolites are regulated. Here we focused on examining the boundaries of the penicillin gene cluster and their effects on penicillin production in A. nidulans. We find that the deletion of both distal and proximal regions to the penicillin cluster is associated with a decrease in penicillin production. A common feature of all of these regions was the presence of multiple repetitive, transposable (TE) or transposon-like (TL) elements (Fig. 1A).
Genome sequencing projects have revealed that TEs/TLs account for a startlingly large proportion of genetic material in eukaryotes. TEs for example encode up to 45% of the human genome (Lander et al., 2001) and even more in some plants (SanMiguel et al., 1996). Repeated sequences are also frequently encountered in eukaryotic genomes. In particular tandem repeats commonly appear in the centromeric, telomeric and subtelomeric regions which can be comprised of hundreds or thousands of repeats. Several studies suggest that these repeated sequences may play an important role in organismal response to environmental cues, determination of phenotypic characters and gene regulation (Kubis et al., 1998; Ugarkovic and Plohl, 2002). Many of the fungal secondary metabolite clusters are located subtelomerically and embedded in repeated DNA sequences and TE/TL regions (Perrin et al. 2007). A striking example includes the penicillin gene cluster located within 30 Kb of the telomere on chromosome VI of A. nidulans.
All four of the deleted regions (PbI, PbIa, PbIb and PbII) contributed to penicillin production. Whereas deletions in the telomere distal regions (PbI series) had no effect on colony growth, the ΔPbII deletant showed decreased growth and aberrant development (Fig. 3B). Growth defects could be remediated by addition of uracil and uridine to the medium, suggesting repression of the pyrG marker gene in this region. This is reminiscent of the phenomenon known as telomere position effect (TPE) that has been shown in several model organisms and recently demonstrated on chromosome III in A. nidulans (Palmer, Keller, and Mirabito, unpublished results). However, because uracil and uridine amendment did not restore penicillin production in the ΔPbII mutant, it appears that PbII is important for penicillin production.
Deletions in the telomere distal regions presented a clearer case for regulation of the penicillin gene cluster. All deletants showed normal growth but with a statistical reduction in penicillin production and delayed and reduced penicillin gene expression. A focus on region PbIa showed it contained the transposon relic termed DNA-2 (Fig. 1A). A near perfect repeat of this region is found in chromosome 1 and chromosome 5, the latter placed within 20 kb of the terrequinone A gene cluster (Bouhired et al., 2007). Additionally, smaller segments of homologous DNA-2 sequence are present in other areas of the genome.
The insertion of A. parasiticus pyrG upstream and downstream of PbIa without a significant effect on penicillin production indicates that the decrease of penicillin production in the ΔPbIa mutants is due to actual loss of this fragment, not through the placement of the pyrG marker gene in this region. Northern blot analysis of the wild type strain did not show any detectable transcript in the PbIa region during penicillin production (Fig. 6D), thus supporting a possible physical, chromatin-based role for this region in secondary metabolism. Expanding on these data, we complemented the PbIa fragment at three locations near the terrequinone A cluster (one area inside the cluster and two areas flanking the cluster). None of the PbIa complemented strains were able to restore penicillin production. Additionally, we assayed terrequinone A levels and show that none of the complementation strains altered product formation compared to the ΔPbIa mutant. We note that a PbIa partial repeat is located ca. 20 kb from the terrequinone cluster and future work will investigate any role for this region in terrequinone regulation.
We postulated that PbIa elements may work through interactions with putative chromatin remodeling complexes including the LaeA - Velvet complex or HDAC complexes. Although the precise mechanism of LaeA regulation of secondary metabolite gene clusters is not known, its deletion blocks the expression of metabolic gene clusters in Aspergillus and Penicillium spp. including the sub-telomerically located A. nidulans penicillin cluster (Bok and Keller, 2004, Kale et. al. 2008, Perrin et al. 2007; Kosalková et al., 2009). Moreover, laeA deletion precisely defines the borders of many secondary metabolite clusters, including that of penicillin, without affecting expression of genes in border regions (Bok et al., 2006; Bouhired et al., 2007; Shwab et al., 2007). Deletion of the A. nidulans histone deacetylase, HdaA, demonstrates a similar precise regulation of penicillin cluster genes, although in an opposing role to LaeA deletion (Shwab et al., 2007). HDAC regulation of subtelomeric regions is well known for several organisms. In S. cerevisiae Hda1, a homologue of HdaA, regulates clusters of subtelomeric genes, known as HAST (Hda1-affected subtelomeric) domains (Robyr et al., 2002). HDAC-mediated regulation of var gene clusters of the malaria agent Plasmodium falciparum allows the protozoan to vary antigen display on the surface of infected host cells, thus evading the immune response (Freitas-Junior et al., 2005). Similarly, subtelomeric EPA gene clusters of Candida glabrata, involved in biofilm formation and essential for pathogenicity, are regulated epigenetically by the NAD+-dependent HDAC Sir2p (De Las Penas et al. 2003).
Since loss of PbIa – transposable element DNA-2 – led to a decrease in penicillin gene expression and product formation, we investigated whether PbIa might function by interfering with and/or activating heterochromatin formation. We postulated that the ΔPbIa phenotype would be rescued by HdaA loss. Indeed penicillin production was increased in the double mutant compared to ΔPbIa but not to the level of ΔhdaA (Fig. 6A). This difference in penicillin production between double mutant ΔPbIa;ΔhdaA compared to ΔhdaA alone was similar to that between ΔPbIa compared to wild type, thus suggesting that PbIa may not directly affect HdaA regulatory activity. A role for PbIa in LaeA regulation remains inconclusive as examination of deletion of the double ΔPbIa;ΔlaeA mutant yielded little information. Interestingly, however, a hint of LaeA regulation of regions with DNA-2 homology was noted by transcript analysis in both ΔlaeA and ΔPbIa;ΔlaeA mutants (Fig. 6D), possibly indicative of active transposase activity by this element.
Here we present evidence for repeated DNA and/or TE/TL elements in positive regulation of the penicillin gene cluster with possible suppression of their activity by LaeA. These elements frequently border SM gene clusters and are hypothesized as potential driving forces in SM gene cluster evolution (Perrin et al. 2007, McDonagh et al. 2008). Regardless of mechanism, this work represents an advance toward understanding the complex regulation of secondary metabolite production and provides a platform for investigating a role for chromatin dynamics in SM diversity.
Supplementary Material
Acknowledgments
All thanks and appreciation to Jin Woo Bok, Saori Amaike, E. Keats Shwab and all Keller lab members for help and support. This work was funded by the Egyptian Government as a joint mission scholarship No. JS2456 to M.S. and NIH 1 R01 Al065728-01 to N.P.K.
Footnotes
Publisher's Disclaimer: This is a PDF file of an unedited manuscript that has been accepted for publication. As a service to our customers we are providing this early version of the manuscript. The manuscript will undergo copyediting, typesetting, and review of the resulting proof before it is published in its final citable form. Please note that during the production process errors may be discovered which could affect the content, and all legal disclaimers that apply to the journal pertain.
References
- Amaike S, Keller NP. Distinct roles for VeA and LaeA in development and pathogenesis of Aspergillus flavus. Eukaryotic Cell. 2009;8:1051–1060. doi: 10.1128/EC.00088-09. [DOI] [PMC free article] [PubMed] [Google Scholar]
- Bayram Ö, Krappmann S, Ni M, Bok JW, Helmstaedt K, Valerius O, Braus-Stromeyer S, Kwon N, Keller NP, Yu J, Braus GH. VelB/VeA/LaeA complex coordinates light signal with fungal development and secondary metabolism. Science. 2008;320:1504–1506. doi: 10.1126/science.1155888. [DOI] [PubMed] [Google Scholar]
- Bok JW, Balajee SA, Marr KA, Andes D, Nielsen KF, Frisvad JC, Keller NP. LaeA, a regulator of morphogenetic fungal virulence factors. Eukaryotic Cell. 2005;4:1574–1582. doi: 10.1128/EC.4.9.1574-1582.2005. [DOI] [PMC free article] [PubMed] [Google Scholar]
- Bok JW, Chiang YM, Szewczyk E, Reyes-Domingez Y, Davidson AD, Sanchez JF, Lo HC, Watanabe K, Strauss J, Oakley BR, Wang CC, Keller NP. Chromatin-level regulation of biosynthetic gene clusters. Nat Chem Biol. 2009;17:462–464. doi: 10.1038/nchembio.177. [DOI] [PMC free article] [PubMed] [Google Scholar]
- Bok JW, Keller NP. LaeA, a regulator of secondary metabolism in Aspergillus spp. Eukaryotic Cell. 2004;3:527–535. doi: 10.1128/EC.3.2.527-535.2004. [DOI] [PMC free article] [PubMed] [Google Scholar]
- Bok JW, Hoffmeister D, Maggio-Hall L, Murillo R, Keller NP. Genomic mining for Aspergillus natural products. Chemistry & Biology. 2006;13:31–27. doi: 10.1016/j.chembiol.2005.10.008. [DOI] [PubMed] [Google Scholar]
- Bouhired S, Weber M, Kempf-Sontag A, Keller NP, Hoffmeister D. Accurate prediction of Aspergillus natural product gene cluster boundaries using the transcriptional regulator LaeA. Fungal Genet Biol. 2007;44:1134–1145. doi: 10.1016/j.fgb.2006.12.010. [DOI] [PubMed] [Google Scholar]
- Calvo AM, Bok JW, Brooks W, Keller NP. VeA is required for toxin and sclerotial production in Aspergillus parasiticus. Appl Environ Microbiol. 2004;70:4733–4739. doi: 10.1128/AEM.70.8.4733-4739.2004. [DOI] [PMC free article] [PubMed] [Google Scholar]
- Clutterbuck AJ. MATE transposable elements in Aspergillus nidulans: evidence of repeat-induced point mutation. Fungal Genet Biol. 2004;41:308–316. doi: 10.1016/j.fgb.2003.11.004. [DOI] [PubMed] [Google Scholar]
- De Las Penas A, Pan SJ, Castano I, Alder J, Cregg R, Cormack BP. Virulence-related surface glycoproteins in the yeast pathogen Candida glabrata are encoded in subtelomeric clusters and subject to RAP1- and SIR-dependent transcriptional silencing. Genes Dev. 2003;17:2245–2258. doi: 10.1101/gad.1121003. [DOI] [PMC free article] [PubMed] [Google Scholar]
- Dreyer J, Eichhorn H, Friedlin E, Kürnsteiner H, Kück U. A homologue of the Aspergillus velvet gene regulates both cephalosporin C biosynthesis and hyphal fragmentation in Acremonium chrysogenum. Appl Environ Microbiol. 2007;73:3412–22. doi: 10.1128/AEM.00129-07. [DOI] [PMC free article] [PubMed] [Google Scholar]
- Fox EM, Howlett BJ. Secondary metabolism: regulation and role in fungal biology. Current Opinion Microbiol. 2008;11:481–487. doi: 10.1016/j.mib.2008.10.007. [DOI] [PubMed] [Google Scholar]
- Freitas-Junior LH, Hernandez-Rivas R, Ralph SA, Montiel-Condado D, Ruvalcaba-Salazar OK, Rojas-Meza AP, Mancio-Silva L, Leal-Silvestre RJ, Gontijo AM, Shorte S, Scherf A. Telomeric heterochromatin propagation and histone acetylation control mutually exclusive expression of antigenic variation genes in malaria parasites. Cell. 2005;121:25–36. doi: 10.1016/j.cell.2005.01.037. [DOI] [PubMed] [Google Scholar]
- Gottschling DE, Aparicio OM, Billington BL, Zakian VA. Position effect at S. cerevisiae telomeres: Reversible repression of Pol II transcription. Cell. 1990;63:751–762. doi: 10.1016/0092-8674(90)90141-z. [DOI] [PubMed] [Google Scholar]
- Kale SP, Milde L, Trapp MK, Frisvad JC, Keller NP, Bok JW. Requirement of LaeA for secondary metabolism and sclerotial production in Aspergillus flavus. Fungal Genet Biol. 2008;45:1422–1429. doi: 10.1016/j.fgb.2008.06.009. [DOI] [PMC free article] [PubMed] [Google Scholar]
- Kapitonov VV, Jurka J. DNA-2_AN, a family of nonautonomous DNA transposons in the Aspergillus nidulans genome. Repbase Reports. 2003a;3:204. [Google Scholar]
- Kapitonov VV, Jurka J. DNA-3_AN, a family of nonautonomous DNA transposons in the Aspergillus nidulans genome. Repbase Reports. 2003b;3:205. [Google Scholar]
- Kapitonov VV, Jurka J. Mariner-1_AN, a family of nonautonomous DNA transposons in the Aspergillus nidulans genome. Repbase Reports. 2003c;3:194. [Google Scholar]
- Kapitonov VV, Jurka J. Mariner-4_AN, a family of nonautonomous DNA transposons in the Aspergillus nidulans genome. Repbase Reports. 2003d;3:212. [Google Scholar]
- Kato N, Brooks W, Calvo AM. The expression of sterigmatocystin and penicillin genes in Aspergillus nidulans is controlled by veA, a gene required for sexual development. Eukaryotic Cell. 2003;2:1178–1186. doi: 10.1128/EC.2.6.1178-1186.2003. [DOI] [PMC free article] [PubMed] [Google Scholar]
- Keller NP, Turner G, Bennett JW. Fungal secondary metabolism-from biochemistry to genomics. Nat Rev Microbiol. 2005;3:937–947. doi: 10.1038/nrmicro1286. [DOI] [PubMed] [Google Scholar]
- Kosalková K, García-Estrada C, Ullán RV, Godio RP, Feltrer R, Teijeira F, Mauriz E, Martín JF. The global regulator LaeA controls penicillin biosynthesis, pigmentation and sporulation, but not roquefortine C synthesis in Penicillium chrysogenum. Biochimie. 2009;91:214–225. doi: 10.1016/j.biochi.2008.09.004. [DOI] [PubMed] [Google Scholar]
- Kubis S, Schmidt T, Heslop-Harrison JS. Repetitive DNA as a major component of plant genomes. Annals Bot. 1998;82:45–55. [Google Scholar]
- Kyrion G, Liu K, Liu C, Lustig AJ. RAP1 and telomere structure regulate telomere position effects in Saccharomyces cerevisiae. Genes Dev. 1993;7:1146–1159. doi: 10.1101/gad.7.7a.1146. [DOI] [PubMed] [Google Scholar]
- Lander ES, Linton LM, Birren B, et al. Initial sequencing and analysis of the human genome. Nature. 2001;409:860–921. doi: 10.1038/35057062. [DOI] [PubMed] [Google Scholar]
- Lee I, Oh JH, Shwab KE, Dagenais TR, Andes D, Keller NP. HdaA, a class 2 histone deacetylase of Aspergillus fumigatus, affects germination and secondary metabolite production. Fungal Genet Biol. 2009;46:782–790. doi: 10.1016/j.fgb.2009.06.007. [DOI] [PMC free article] [PubMed] [Google Scholar]
- McDonagh A, Fedorova ND, Crabtree J, Yu Y, Kim S, Chen D, Loss O, Cairns T, Goldman G, Armstrong-James D, Haynes K, Haas H, Schrettl M, May G, Nierman WC, Bignell E. Sub-telomere directed gene expression during initiation of invasive aspergillosis. PLoS Pathog. 2008;4:e1000154. doi: 10.1371/journal.ppat.1000154. [DOI] [PMC free article] [PubMed] [Google Scholar]
- Miller BL, Miller KY, Timberlake WE. Direct and indirect gene replacements in Aspergillus nidulans. Mol Cell Biol. 1985;5:1714–1721. doi: 10.1128/mcb.5.7.1714. [DOI] [PMC free article] [PubMed] [Google Scholar]
- Myung K, Li S, Butchko RA, Busman M, Proctor RH, Abbas HK, Calvo AM. FvVE1 regulates biosynthesis of the mycotoxins fumonisins and fusarins in Fusarium verticillioides. J Agric Food Chem. 2009;57:5089–5094. doi: 10.1021/jf900783u. [DOI] [PMC free article] [PubMed] [Google Scholar]
- Perrin RM, Fedorova ND, Bok JW, Cramer RA, Wortman JR, Kim HS, Nierman WC, Keller NP. Transcriptional regulation of chemical diversity in Aspergillus fumigatus by LaeA. PLoS Pathog. 2007;3:508–517. doi: 10.1371/journal.ppat.0030050. [DOI] [PMC free article] [PubMed] [Google Scholar]
- Pontecorvo G, Roper JA, Hemmons LM, Macdonald KP, Bufton AWJ. The genetics of Aspergillus nidulans. Adv Genet. 1953;5:141–238. doi: 10.1016/s0065-2660(08)60408-3. [DOI] [PubMed] [Google Scholar]
- Pryde FE, Gorham HC, Louis EJ. Chromosome ends: all the same under their caps. Curr Opin Genet Dev. 1997;7:822–828. doi: 10.1016/s0959-437x(97)80046-9. [DOI] [PubMed] [Google Scholar]
- Robyr D, Suka Y, Xenarios I, Kurdistani SK, Wang A, Suka N, Grunstein M. Microarray deacetylation maps determine genome-wide functions for yeast histone deacetylases. Cell. 2002;109:437–446. doi: 10.1016/s0092-8674(02)00746-8. [DOI] [PubMed] [Google Scholar]
- Sambrook J, Russell DW. Molecular cloning: a laboratory manual. 3. Cold Spring Harbor Laboratory Press; Cold Spring Harbor, NY: 2001. [Google Scholar]
- SanMiguel P, Tikhonov A, Jin YK, Motchoulskaia N, Zakharov D, Melake-Berhan A, Springer PS, Edwards KJ, Lee M, Avramova Z, Bennetzen JL. Nested Retrotransposons in the Intergenic Regions of the Maize Genome. Science. 1996;274:765–768. doi: 10.1126/science.274.5288.765. [DOI] [PubMed] [Google Scholar]
- Shimizu K, Keller NP. Genetic involvement of a cAMP dependent protein kinase in a G protein signaling pathway regulating morphological and chemical transitions in Aspergillus nidulans. Genetics. 2001;157:591–600. doi: 10.1093/genetics/157.2.591. [DOI] [PMC free article] [PubMed] [Google Scholar]
- Shwab EK, Bok JW, Tribus M, Galehr J, Graessle S, Keller NP. Histone deacetylase activity regulates chemical diversity in Aspergillus. Eukaryotic Cell. 2007;6:1656–1664. doi: 10.1128/EC.00186-07. [DOI] [PMC free article] [PubMed] [Google Scholar]
- Ugarkovic D, Plohl M. Variation of satellite DNA profiles causes and effects. EMBO J. 2002;21:5955–5959. doi: 10.1093/emboj/cdf612. [DOI] [PMC free article] [PubMed] [Google Scholar]
- Williams RB, Henrikson JC, Hoover AR, Lee AE, Cichewicz RH. Epigenetic remodeling of the fungal secondary metabolome. Org Biomol Chem. 2008;7:1895–1897. doi: 10.1039/b804701d. [DOI] [PubMed] [Google Scholar]
- Wortman JR, Gilsenan JM, et al. The 2008 update of the Aspergillus nidulans genome annotation: A community effort, Fungal Genet. Biol. 2008;25:2–13. doi: 10.1016/j.fgb.2008.12.003. [DOI] [PMC free article] [PubMed] [Google Scholar]
- Yu JH, Hamari Z, Han KH, Seo JA, Reyes-Dominguez Y, Scazzocchio C. Double-joint PCR: a PCR-based molecular tool for gene manipulations in filamentous fungi. Fungal Genet Biol. 2004;41:973–981. doi: 10.1016/j.fgb.2004.08.001. [DOI] [PubMed] [Google Scholar]
Associated Data
This section collects any data citations, data availability statements, or supplementary materials included in this article.