Abstract
Ion channels are part of nature's solution for regulating biological environments. Every ion channel consists of a chain of amino acids carrying a strong and sharply varying permanent charge, folded in such a way that it creates a nanoscopic aqueous pore spanning the otherwise mostly impermeable membranes of biological cells. These naturally occurring proteins are particularly interesting to device engineers seeking to understand how such nanoscale systems realize device-like functions. Availability of high-resolution structural information from X-ray crystallography, as well as large-scale computational resources, makes it possible to conduct realistic ion channel simulations. In general, a hierarchy of simulation methodologies is needed to study different aspects of a biological system like ion channels. Biology Monte Carlo (BioMOCA), a three-dimensional coarse-grained particle ion channel simulator, offers a powerful and general approach to study ion channel permeation. BioMOCA is based on the Boltzmann Transport Monte Carlo (BTMC) and Particle-Particle-Particle-Mesh (P3M) methodologies developed at the University of Illinois at Urbana-Champaign. In this paper we briefly discuss the various approaches to simulating ion flow in channel systems that are currently being pursued by the biophysics and engineering communities, and present the effect of having anisotropic dielectric constants on ion flow through a number of nanopores with different effective diameters.
Keywords: Ion channel, Monte Carlo simulation, Molecular dynamics, Drift-diffusion simulation, Boltzmann Poisson equation
1 Introduction
Part of nature's solution to the ion transportation problem across cell membrane is ion channels, which are a class of membrane proteins that build a nanoscale water-filled pathway facilitating the diffusion of ions across the impermeable lipid membrane [1]. The intriguing aspect of ion channels is that evolution has generated an endless variety of different channels with equally different sensing and actuating capabilities, which we have only begun to catalog and understand. There are many types of ion channels and they are usually classified based upon their ion selectivity, gating mechanism, or sequence similarity. Gating is the conformational change that opens or closes the channel, typically in response to an external stimulus [1]. From a physiological point of view, ion channels regulate the transport of ions to maintain the internal ion composition vital for cell survival and functionality. They are in charge of electrical signaling in the nervous system, and as a result malfunctioning ion channels are associated with many diseases; thereby studying and understanding different aspects of these proteins is of great pharmaceutical importance [2].
To a device specialist, ion channels are of extreme interest; because they realize on the nanoscale single agent detection functions like gating/switching or selectivity/discriminating between different species and have stimulated the engineering community to design novel bio-devices [3]. Two distinctive features of ion channels, in comparison to solid-state nanoscale devices, are the advantage of self-assembly and almost perfect structure duplication. Furthermore, modern biology offers the tools for channel reengineering to alter channel functions [4, 5].
A comprehensive hierarchy of methodologies and device simulation approaches has been implemented and tested to approach and study different systems in biology at the molecular level. There has been a keen interest in adapting the approaches and methods realized to study electronic charge transport in semiconductor materials and devices to describe the behavior of ion channels from a device perspective. On the other hand, a variety of physical approaches have been implemented by the biophysics community in order to simulate and explain the behavior of such systems [6, 8].
The most popular simulation approach relies on Molecular Dynamics (MD), where the trajectory and evolution of the whole system, ions, protein and lipid atoms, and water molecules contained in the simulation domain, is followed in great detail. Yet the major challenge with Molecular Dynamics is its high computational cost, which still prohibits practical applications for simulation times necessary to resolve biological problems, such as current flow in ion channels [7]. In using Molecular Dynamics, current flow estimates cannot accurately be obtained since ion traversal through the channel is a rare event, and studying such macroscopic behaviors often demand simulation times lasting several hundred nanoseconds or even several μ seconds [6]. On the other hand, short-range interactions between atoms can be very strong and demand femto-second scale evolution of trajectories. Though Molecular Dynamics simulations provide essential knowledge on protein dynamics and mechanisms of ion conduction, the computational cost to study steady-state ion current through the channel is still very high, even on massively parallel supercomputers.
2 Ion channels as nanodevices
It is useful to firstly compare the similarities and differences between ion channels as soft matter nanodevices and semiconductor devices as solid state ones from a charge transport point of view. The main issues are illustrated schematically in Table 1.
Table 1.
Differences and similarities between simulating charge transport in solid-state devices and electrolyte systems
| Ion channels | Solid state devices |
|---|---|
| Water solution | Crystal band structure |
| Carriers are ions with relatively large mass and finite volume | Carriers are quasi-particles with a small effective mass |
| Ions are scattered by interacting with water molecules | Carriers are scattered by phonons |
| Channel structures (either wild type or stable mutants) are always perfect replicas | Ultra nano-scaled structures are troubled with fluctuations of doping and sizes |
While ions as the charge carriers in an electrolyte environment have specific mass, volume, and interact strongly with polar water molecules; the charge carriers in a semiconductor system are quite different in nature. The quasi-particles in solid state environments (electrons and holes) move as if in a continuum or vacuum with an effective mass derived from the band structure. Ions are thermalized or scattered mainly by water molecules, where as in semiconductors, the vibration of atoms from their ideal crystal structure, modeled in terms of phonon modes, interact with mobile charges through different scattering mechanisms. Furthermore, the effective mass and phonons together determine the mobility of quasi-particles.
While a semiconductor system can withstand relatively high temperatures, it is becoming increasingly difficult for designers to scale integrated circuit further because of the increased thermal dissipation, which eventually might even risk melting the chip. Another problem in scaling devices to the nanoscale is caused by fluctuations in geometry and doping which are becoming very difficult to control [7]. In contrast, the wet biological systems seem to process information very efficiently, temperature can be readily controlled and the molecular structure of the components is replicated and self-assembled almost perfectly. This is indeed astounding, given the complexity and variety of molecular structures of proteins that form the channel pores. What's more, with the help of modern biology, ion channel proteins could be mutated, altering channels selectivity, gating, or other functionalities [4, 5].
3 Computational issues
While the inter-atomic collisions happen in the time scale of about 10−15 second, ion channel functions follow much slower biological time scales on the order a few microseconds. In the relatively small number of channels for which the molecular structure is well known, the protein strands can have anywhere from a few hundred atoms as in gramicidin, an early antibiotic, to several thousand atoms as in α-Hemolysin (α-HL), a toxin protein (Fig. 1). The electronic charge distribution on the protein could vary considerably by different factors in the surrounding electrolyte, like pH or salt concentration. Some protein residues could undergo protonation or de-protonation, adding or loosing a proton (H+) respectively. At the same time, the pore is not a rigid structure and it may undergo significant conformational changes and fluctuations over time.
Fig. 1.
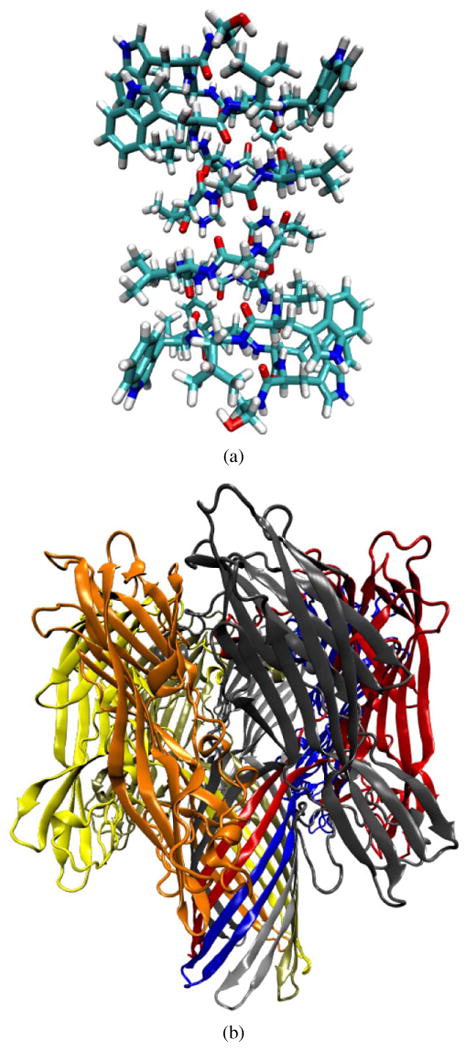
(a) Gramicidin A (1 mag), a very small and well-studied toxin ion channel. Gramicidin is a cation selective channel and is very small and size and dimensions in comparison to α-Hemolysin (b), a hepta-mer ion channel with a relatively wide pore and slightly selective towards anions
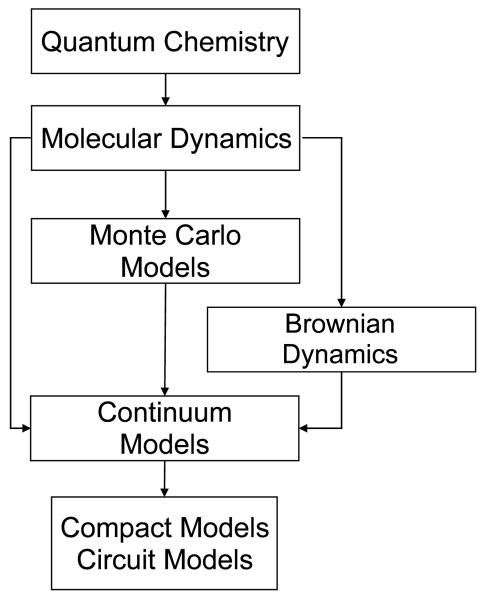
Simulation of ion channels poses a multiscale problem in time, therefore it is desirable to have available a hierarchy of simulation approaches of decreasing complexity to probe the relevant time scales of interest. Figure 2 shows a diagram of the simulation hierarchy of different methods and how each one could provide part of the input parameters fed to other techniques.
Fig. 2.
This figure shows a hierarchy of different approaches, starting from the very ab initio Quantum Chemistry methods to the very high-level compact models, and also how they provide input parameters for other approaches
3.1 Quantum chemistry
Based on quantum mechanics and quantum field theory, quantum chemistry describes the electronic behavior of atoms and molecules, light absorption, transfer of energy, as well as electrons and protons. Such quantum calculations could also provide force-field parameters such as charge distribution; bond angles, energy parameters, and atom radii used in classical physics methods like Molecular Dynamics simulations. Due to the very high computational cost of such calculations, quantum chemistry could be used to study and examine only a very small number of atoms (i.e. a single amino acid, 10–20 atoms) and has to ignore its dynamics [9].
3.2 Molecular dynamics
Based on Newtonian physics, Molecular Dynamics follows the dynamics of every single atom, at the highest level of detail, in the system [6, 8, 10]. However, the resulting complexity makes the computational cost very high. The overwhelming burden in MD simulations arises from the need to compute trajectories for all the atoms in the system.
Although it is possible to evaluate the charge distribution residing on the protein with quantum chemistry techniques, these can only be performed as stand alone calculations—a coupling to a dynamic simulation is well beyond what is manageable today. Force-field parameters are derived either from quantum chemistry and/or experimental data. Some Molecular Dynamics packages come with their own force-fields, e.g., CHARMM [11–13], AMBER [14, 15], GROMOS [16], while other force-fields are available as stand-alone parameter sets, e.g., OPLS [17, 18] and PARSE [19].
Nonetheless, since ion channel systems typically comprise hundreds of thousands of particles, MD simulations are currently limited to timescales of the order of 100 ns even on massively parallel machines. This may be sufficient to evaluate certain thermodynamic and transport parameters, but cannot resolve measurable current flow.
3.3 Coarse-grained simulations
Coarse-grained or reduced particle methods are designed to reduce the computational cost by making approximations to the description of the membrane and protein, as well as to the transport model of the electrolyte. In such methods the dynamics of the protein and lipid are ignored and instead a static configuration is chosen. The protein structure could be taken from the crystallographic measurements, though MD simulations are often used to relax the crystal structure to a more plausible conformation for specific physiological conditions. To resolve even longer time scales, the protein and lipid structures could be modeled as continuum regions delimited by hard wall boundaries, and characterized electrically by an average permittivity and static charge distribution.
For the simulation of the electrolyte, the main computational expense arises from tracking the individual water molecules. The first major approximation involves replacing thousands of water molecules with a continuum background, also electrically characterized by an average permittivity, while a suitable scattering model is introduced to account for the interaction between mobile ions and water [7].
Rather than computing the Coulomb field directly as is done in MD simulations, the forces are evaluated in space by solving the Poisson equation on a grid covering the simulation domain, where one maps the permittivities and the local distribution of fixed and mobile charges. The use of Poisson equation is very appealing to describe ion channels as device systems, because it is relatively easy to formulate boundary conditions on the electrostatic potential that represent the actual application of bias voltages across the membranes that are used in electrophysiology experiments. Also, image charges induced at dielectric interfaces are implicitly accounted for by the model. Furthermore, to capture the charge-charge interactions at close proximity, particle-particle schemes may be applied locally in addition to the particle-mesh scheme of the Poisson equation [24].
Brownian Dynamics simulations in particular, have become increasingly popular to obtain macroscopic information with respect to channels conductance and selectivity [21, 22, 29]; nonetheless, representing ion-water interactions with a single friction coefficient and a random stochastic force may be an over-simplification in narrow regions of the channel where more complicated ion scattering mechanisms could exist [20]. The Biology Monte Carlo (BioMOCA), an alternative coarse-grained model for ion channels, has been developed based on Boltzmann Transport Monte Carlo (BTMC) methodology. Since a comprehensive description of BioMOCA has been furnished elsewhere [7, 20], we will describe the model very briefly here, and address some of the advantages and drawbacks of this approach.
3.4 Continuum simulations
At the other end of the simulation hierarchy, continuum models based on Poisson-Nernst-Plank (PNP), or drift-diffusion theory, have also been implemented to study macroscopic ion currents in ion channels and nanopores [3, 30, 31]. The assumption of a charged fluid implies that the finite size and discrete nature of the charge of the ions are neglected. For nanoscale pores, this may lead to charges entering very narrow regions, where actual ions would be excluded, and at certain locations the model may yield ion densities that are higher than would be physically possible when the finite volume occupied by each ion is considered. A possible approach for the classical ion fluid is to add a correction potential that considers the finite ion size (in terms of geometry and charge distribution) to prevent unphysical bunching of charges in restricted spaces, particularly if a strong fixed attractive field is present as in pores with highly charged protein walls [32, 33].
3.5 BioMOCA—Boltzmann Transport Monte Carlo code
Monte Carlo simulations use a range of stochastic methods that use pseudo-random numbers to generate a particular statistical distribution. They have been used to study charge transport in solid state and plasma devices for about four decades now. In an ion channel system, the collection of ions in the electrolyte baths and channel lumen represents an ensemble of particles, where for typical physiological salt concentrations, interact mostly with the water molecules. Such interactions could be modeled as scattering events that interrupt ion free flights. Such features make the ion channel system an interesting application of Monte Carlo techniques.
BioMOCA has been developed at the University of Illinois at Urbana-Champaign to simulate ion transport in an electrolyte environment through ion channels or nano-pores embedded in membranes [20]. It is based on two methodologies, namely the Boltzmann Transport Monte Carlo (BTMC) [23] and particle-particle-particle-mesh (P3M) [24]. The first one uses Monte Carlo method to solve the Boltzmann equation, while the later splits the electrostatic forces into short-range and long-range components. To reduce computational cost, the protein, membrane, and water are treated as continuum media with given permittivities. Ions are the only particles in motion; they move according to Newtonian physics, and are dampened by frequent scattering events with water molecules.
The electrostatic potential is computed at regular time intervals by solving the Poisson's equation
| (1) |
where ρions (r, t) and ρperm (r) are the charge density of ions and permanent charges on the protein, respectively. ε(r) is the local dielectric constant or permittivity, and ϕ(r, t) is the local electrostatic potential. Solving this equation provides a self-consistent way to include applied bias and the effects of image charges induced at dielectric boundaries.
The ion and partial charges on protein residues are assigned to a finite rectangular grid using the cloud-in-cell (CIC) scheme [24]. Solving the Poisson equation on the grid counts for the particle-mesh component of the P3M scheme. However, this discretization leads to an unavoidable truncation of the short-range component of electrostatic force, which can be corrected by computing the short-range charge-charge Coulombic interactions.
To prevent ions from overlapping each other, the Lennard-Jones 6–12 potential has been employed to mimic the ionic core repulsion.
3.6 Dielectric coefficient
Assigning the appropriate values for dielectric permittivity of the protein, membrane, and aqueous regions is of great importance. The dielectric coefficient determines the strength of the interactions between charged particles and also the dielectric boundary forces (DBF) on ions approaching a boundary between two regions of different permittivity. However, in nano scales the task of assigning specific permittivity is problematic and not straightforward. The protein or membrane environment could respond to an external field in a number of different ways [20]. The issue of protein dielectric coefficients is addressed in detail elsewhere [25–27]. On top of that, the water molecules inside ion channels could be very ordered due to tapered size of the pore, which is often lined with highly charged residues, or hydrogen bond formation between water molecules and protein [8]. As a result, the dielectric constant of water inside an ion channel could be quite different from the value under bulk conditions.
3.7 Ion size
The finite size of ions is accounted for in BioMOCA using pairwise repulsive forces derived from the 6–12 Lennard-Jones potential. A truncated-shifted form of the Lennard-Jones potential is used in the simulator to mimic ionic core repulsion. The modified form of the Lennard-Jones pairwise potential that retains only the repulsive component is given by
| (2) |
Here, εLJ is the Lennard-Jones energy parameter and σij = (σi + σj)/2 is the average of the individual Lennard-Jones distance parameters for particles and. Using a truncated form of the potential is computationally efficient while preventing the ions from overlapping or coalescing, something that would be clearly unphysical.
3.8 Ion-protein interaction
Availability of high-resolution X-ray crystallographic measurements of complete molecular structures provide information about the type and location of all atoms that form the protein. BioMOCA uses this information in the PQR (Position-Charge-Radius) format to map the protein system onto a rectangular grid, and partition the simulation domain into continuous regions based on Adaptive Poisson Boltzmann Solver (APBS) scheme [28].
Ions are deemed to have access to protein and lipid regions. If any point within the finite-size of ionic sphere crosses the protein or membrane boundary, a collision is assumed and the ion is reflected diffusively [20].
3.9 Ion-water interactions
As a reduced particle approach, BioMOCA replaces the explicit water molecules with continuum background and handles the ion-water interactions using BTMC method. Ion trajectories are randomly interrupted by scattering events that account for the ions' diffusive motion in water [20]. In between these scattering events, ions follow the Newtonian forces. The free flight times, Tf, are generated statistically from the total scattering rate according to
| (3) |
where r is a random number uniformly distributed on the unit interval. λ, a function of momentum, is the total scattering rate for all collision mechanisms. At the end of each free flight, the ion's velocity is reselected randomly from a Maxwellian distribution. Even though BioMOCA is equipped to handle multiple scattering processes, for this work we have assumed a mechanism based on the ion's space-dependent diffusion coefficient in water.
The high ion-water scattering rates (total scattering rate in bulk with bulk diffusivity for K+ and Cl− ions are λK+ ≅ 3.23 × 10¹³ s−1, λCl− ≅ 3.46 × 10¹³ s−1) necessitate a short-range ion trajectory integration time-step (i.e. Δt = 10 fs). Having said that, the ion motion is highly damped that the charge density assigned to the mesh nodes changes relatively slowly with regard to the ion integration time-step, which gives the green light to relax the frequency of successive solutions of the Poisson equation. Benchmark calculations on ion-ion pair correlation functions for the salt concentrations and scattering rates of interest imply that the Poisson equation can be resolved as infrequently as every few picosecond (i.e. 1∼10 picosecond) before any significant distortion in ion radial distribution function is evident [20]. Yet the recurrent solution of Poisson equation on the mesh to update the electrostatic potential is accountable for most of the computational cost. To reduce the computational cost of solving Poisson equation, a grid focusing scheme has been implemented in BioMOCA that allows the use of a coarse mesh spanning the entire domain and a finer mesh on a sub-domain containing the channel region simultaneously in a computationally efficient way. This methodology also allows multiple fine mesh sub-domains, which can be useful for channels with multiple pores like ompF porin or an array of channels sharing common bath regions. Poisson's equation is first solved on the coarse mesh. Boundary conditions for the fine mesh are then obtained by interpolation from the coarse mesh solution along with some additional calculations to account for the short-range component of electrostatic potential.
Another approach in reducing the computational cost of solving Poisson equation is a full multi-grid implementation, which is being developed and tested. In the grid-focusing scheme the fine mesh is used only for solving Poisson equation with higher accuracy; where as in the full multi-grid method the finest grid is used both for solving Poisson equation and also representing the whole system in greater detail.
3.10 Hydration shells
In addition to having a diffusive effect on ion transport, water molecules also form hydration shells around individual ions due to their polar nature. The hydration shell not only shields the charge on ions from other ions but also modulates the ion radial distribution function causing the formation of peaks and troughs. The average minimum distance between two ions is increased as there is always at least one layer of water molecules present between them, acting as a physical deterrent preventing two ions from getting too close to each other, in a manner that is similar to the short-range repulsive component of the Lennard-Jones potential.
The theory of hydration shells is well developed in the physical chemistry literature however we seek a simple model that captures the essential effects with as little computational overhead as possible. For this purpose we have implemented the same pairwise potential discussed by Im and Roux [34] to include the effect of hydration shells.
| (4) |
The coefficients ci were determined empirically for a 1 M KCl solution, using MD simulations to benchmark the ion radial distribution functions against Equilibrium Monte Carlo simulations. The effect of hydration shells was found to be important in simulations at higher salt concentrations where the conductance of many ion channels, porin among them, is observed to saturate as the salt concentration in the electrolyte baths is further increased. Earlier simulations that did not include a model of hydration shells did not reproduce the conductance saturation behavior. This suggests an additional repulsive potential acting to prevent ion crowding, and hence limiting the concentration of ions and current density in the confined space of the pore even at high bath salt concentration. When the repulsive potential in (4) was included moderate channel conductance was observed.
3.11 Boundary conditions
The electrical and physiological properties of ion channels are experimentally measured by inserting the channel into a lipid membrane separating two baths containing solutions of specific concentrations. A constant electrostatic bias is applied across the channel by immersing the electrodes in the two baths. Formulating boundary conditions that accurately represent these contact regions may require enormously large bath regions and is a challenging task. In our approach, we assume that beyond a Debye length from the membrane the electrostatic potential and ion densities do not vary appreciably. This assumption has been supported by the results of continuum results presented earlier [35]. For typical salt concentrations used in ion channel simulations, the Debye length is of the order of 10 Å. Using the assumption, we impose Dirichlet boundary conditions on the potential at the two domain boundary planes that are transverse to the channel, taking care that these planes are sufficiently far from the membrane.
The other problem in duplicating the experimental conditions is the problem of maintaining fixed charge density in the two baths. We treat this problem by maintaining the specified density in two buffer regions extending from the boundary plane toward the membrane. The number of ions needed to maintain the density in the two buffer regions is calculated at the start of the simulations. The count of the ions in these buffers is sampled throughout the simulation and an ion is injected whenever a deficit is observed. The initial velocity of the injected particle is decided according to Maxwellian distribution. It should be noted that the ions can leave the system only by exiting through the two Dirichlet boundary planes and we do not remove an ion artificially from these buffer regions. The reflections from the Neumann boundary planes are treated as elastic reflections.
4 Anisotropic permittivity
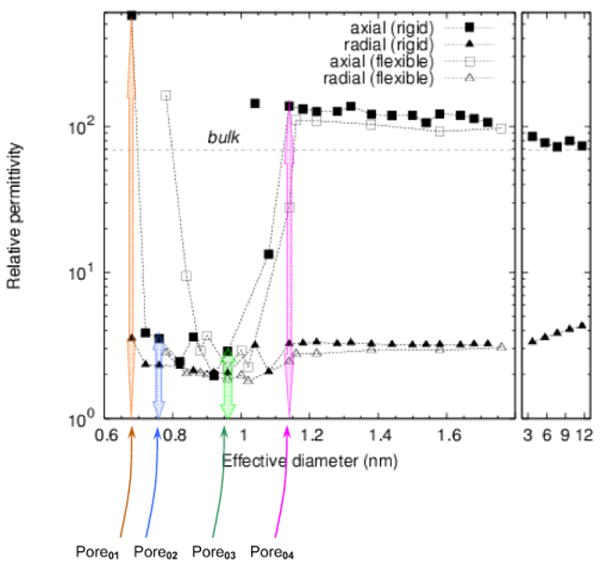
It has become evident that the macroscopic properties of a system do not necessarily extend to the molecular length scales. In a recent research study carried by R. Jay Mashl, and Eric Jakobsson at the University of Illinois, Urbana-Champaign (personal communications), they used Molecular Dynamics simulations to study the properties of water in featureless hydrophobic cylinders with diameters ranging from 1 to 12 nm. This study showed that water undergoes distinct transitions in structure, dielectric properties, and mobility as the tube diameter is varied. In particular they found that the dielectric properties in the range of 1 to 10 nm is quite different from bulk water and is in fact anisotropic in nature. Figure 3 below shows the relative anisotropic permittivity of water in such effectively infinitely long nano-tubes.
Fig. 3.
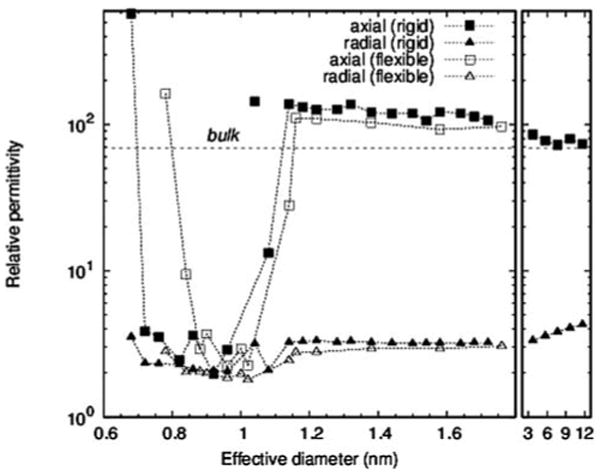
Relative axial or radial permittivities for effectively infinite hydrophobic nanotubes; effective diameter is essentially the diameter that the water molecules occupy, and is slightly smaller than the pore diameter
Though, such featureless hydrophobic channels do not represent actual ion channels and more research has to be done in this area before one could use such data for ion channels, it is evident that water properties like permittivity inside an ion channel or nano-pore could be much more complicated that it has been thought before. While a high axial dielectric constant shields ion's electrostatic charges in the axial direction (along the channel), low radial dielectric constant increases the interaction between the mobile ion and the partial charges, or the dielectric charge images on the channel, conveying stronger selectivity in ion channels.
The anisotropic permittivity into the Poisson solver has been incorporated into BioMOCA using the box integration method [36], which has been briefly addressed in Appendix.
4.1 Case Study: nano pores
To further realize the effect of the anisotropic permittivity values given in Fig. 3, we have constructed four nano pores with diameters of 6.75, 7.6, 9.6, and 10.4 nm and named them Pore01 through Pore04 respectively. The corresponding relative axial and radial permittivity values are listed in Table 2. Figure 4 also schematically shows the four pore selections.
Table 2.
Approximate axial and radial relative permittivities for each of the four pore with their given diameters. These values were approximated from Fig. 3
| Diameter | Relative axial permittivity | Relative radial permittivity | |
|---|---|---|---|
| Pore01 | 6.75 | 600 | 3.5 |
| Pore02 | 7.6 | 3.5 | 2.5 |
| Pore03 | 9.6 | 2.9 | 2 |
| Pore04 | 10.4 | 130 | 3.2 |
Fig. 4.
Selections of pores 01 through 04 are highlighted
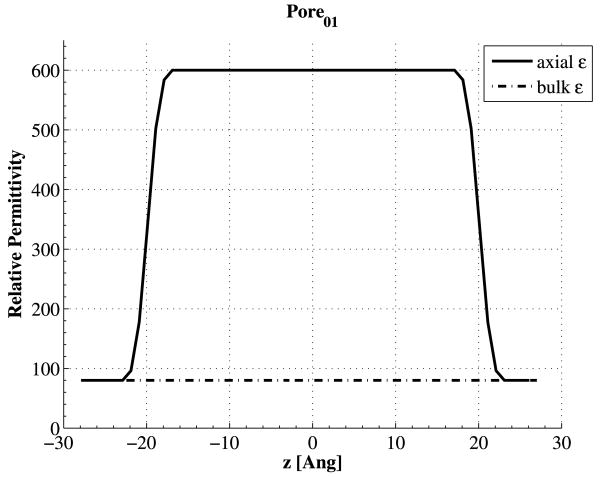
A box of size Lx × Ly × Lz = 20 × 20 × 70 Å was chosen for all pores with 0.5 Å grid spacing in each dimension resulting in a Nx × Ny × Nz = 40 × 40 × 140 mesh. A pore of length 40 Å was then inserted along the z-direction at the center of the box. The pore was then wrapped in a membrane with dielectric constant of 5. We chose the value of 5, as it is often the value chosen for protein permittivity in coarse-grained or continuum models. If an ion runs into the pore walls, it will be reflected diffusively, as it has run into protein. Figure 5 schematically shows the system design. Simulations were carried out with 1 molar K+Cl− concentration on each side (baths left and right), 1 volt bias, and a total simulation time of 100 ns with 10 fs Monte Carlo time steps. For each pore we ran two simulations, one with isotropic relative permittivity of 80 for all the aqueous regions (baths, and channel), and the other one with the given anisotropic dielectric constants inside the channels while having an isotropic permittivity of 80 for the baths. For the case of anisotropic permittivities, we have smoothed out the axial values at the border of bulk and channel entrance so the electric field along the z-axis does not change so abruptly, but gradually. Figure 6 shows the relative axial permittivity for Pore01.
Fig. 5.
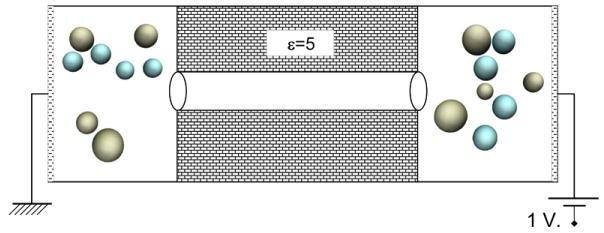
Illustration of the system setup for BioMOCA transport simulations
Fig. 6.
Comparison of relative axial permittivity to the bulk value of 80 in Pore01; the axial permittivity has been changed from bulk value of 80 to the channel value of 600 in a gradual way
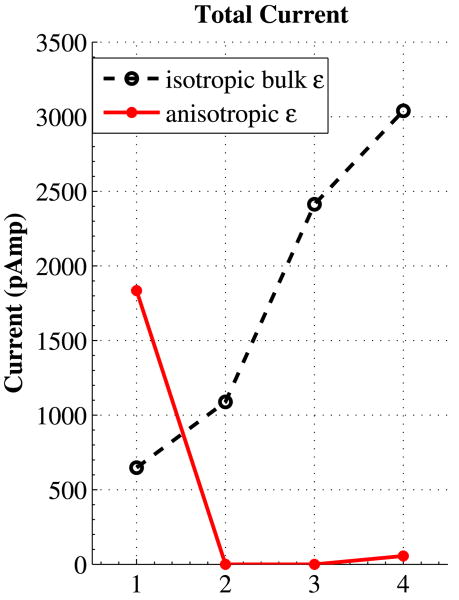
The total crossings of both ion species are counted as they traverse the pore midpoint (across the pore at z = 0 plane). The total counting for 100 ns simulation run time has been shown in Table 3. In this table the number of crossings counts only for potassium ions from the right bath to the left one, and the opposite direction counts only for the chloride ions; as the strong 1 volt bias applied almost excludes the traversal of potassium ions from left to the right and chloride ions from right to left. Figure 7 shows the total current in pico-amperes for the pores.
Table 3.
Ion crossing counts over the course of 100 ns for each of the four pores and either of anisotropic or isotropic dielectric constants inside the channel
| Anisotropic pores | Isotropic pores | |||
|---|---|---|---|---|
| Cl− | K+ | Cl− | K+ | |
| (left → right) | (right → left) | (left → right) | (right → left) | |
| Pore01 | 409 | 736 | 195 | 209 |
| Pore02 | 0 | 0 | 330 | 349 |
| Pore03 | 0 | 0 | 767 | 739 |
| Pore04 | 20 | 15 | 960 | 937 |
Fig. 7.
(Color online) Total current for each of the four pores (marked from 1 to 4); dashed black line is the current when we use bulk dielectric constant inside the channels, while the solid red line represents the total current with given anisotropic dielectric constants inside the channels
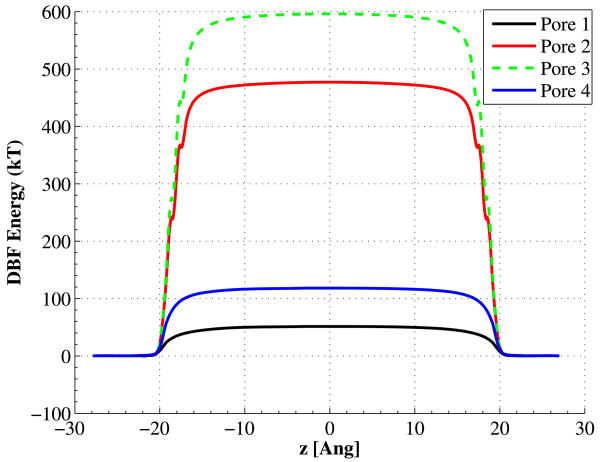
As expected, in the pores with isotropic bulk permittivity, the flow of charges increases in a linear fashion, as the pore diameter does increase. However, the current flow in pores with anisotropic permittivity has a completely different behavior. Pores 02 and 03, with very low relative permittivities (both radial and axial) do not observe any crossings over the course of 100 ns. In other words, no ions happened to have enough kinetic energy to overcome the energy barrier due to the dielectric boundary forces (DBF), and enter the pores in these simulations. Relatively higher axial permittivity in Pore04, counts for the small current observed here. Pore01 shows an outstanding high current, due its very high axial permittivity. Computing the DBF potential energy could enlighten part of this nonlinear behavior in pores with anisotropic dielectric constants.
4.2 Dielectric boundary force measurements
To compute the DBF related potential energy, we steered an ion (i.e. K+) through the center of the pore from z = −10 Å to z = +10 Å, with 0.1 Å steps and computed the potential energy with formula
| (5) |
The electric field (.) is computed at the position of ion as we drag it through the pore. Figure 8, schematically shows the charge steering process.
Fig. 8.
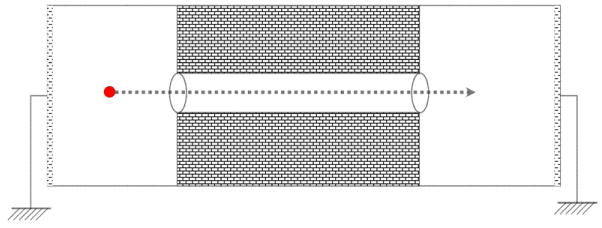
Illustration of how an ion is being steered through the pore, in absence of an applied field (i.e. bias = 0)
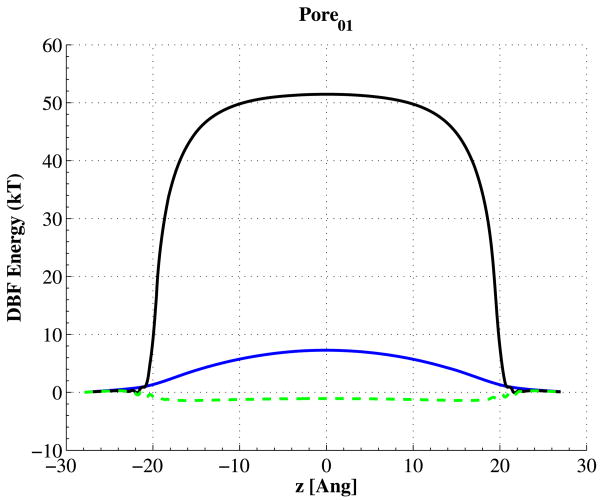
The potential energy barriers of Pore01 are shown in Fig. 9. In this figure, the solid blue curve is the energy barrier when we have an isotropic dielectric constant of 80 in all the aqueous regions. Changing the radial component of permittivity from 80 to 600, while keeping the radial part same as bulk, would actually produce a potential well for charged particles, as shown with dashed green curve. Setting the radial component of the permittivity to a very low value of 3.5, would shoot up the potential barrier to about 50 kT (solid black curve). Figure 10 shows all the DBF potential energies for all four pores with the given anisotropic permittivities. As is seen in this figure, Pore01 has the lowest potential barrier, while, Pores 02 and 03 have the highest ones, which explains why they have no ion flux.
Fig. 9.
(Color online) The DBF potential energy for Pore01; solid blue: potential barrier when we use bulk relative permittivity of 80 inside the pore, dashed green: potential well, as a result of setting the axial relative permittivity to 600 inside the channel, while keeping 80 in either of x- or y-directions, solid black: potential barrier with axial relative permittivity of 600, and radial one of 3.5
Fig. 10.
(Color online) Comparison of all DBF potential energies for each of the four pores with the given anisotropic permittivities
Pore01 with anisotropic permittivity has to be further investigated, as it has a higher potential barrier compared to the one with isotropic bulk dielectric constant (∼50kT compared to ∼7kT); yet it manages to have an ion flux of almost 3 times bigger in size. To do so, we may look at the ion trajectories at every single step inside the channel and measure their density, average velocity, or displacement. Following the trajectory of ions inside the channel reveals that ions in the pore with isotropic bulk permittivity move in the z-direction an average of 8.6 times faster than the pore with anisotropic permittivity. However the number of ions inside the pore with anisotropic permittivity is more than 18 times larger. Table 4 has briefed the average velocity and number of ions inside the pore for the two case studies. Figure 11 also shows two snapshots of the trajectories visualized with VMD software [37]. This explains why there is larger flux in the Pore01 with anisotropic permittivity than the corresponding pore with bulk value dielectric constant, even though the DBF potential barrier is quite larger in the first one. High axial permittivity shields the ion charges from each other in the axial direction, allowing many of them trailing along the channel.
Table 4.
Average estimates of pore occupancy and ion speeds inside the pore, over a 10 ns trajectory analysis
| Average velocity of ions inside the channel | Average number of ions inside the channel | |
|---|---|---|
| Pore01 (isotropic ε) | 18.2601 (m/s) | 0.741 |
| Pore01 (anisotropic ε) | 2.11361 (m/s) | 13.622 |
Fig. 11.
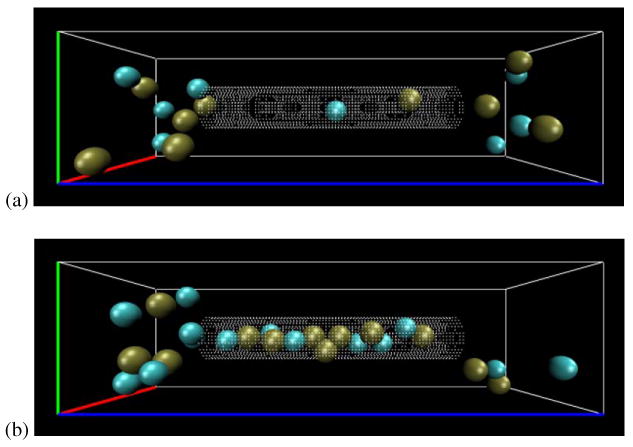
Two snapshots of the pore occupancy; (a) Pore01, with isotropic dielectric constant (bulk value), (b) Pore01, with the given anisotropic dielectric constants
5 Discussions
At first it might seem that such anisotropic permittivity values for nanopores are incoherent. However, MD simulations on electrolyte transport through carbon nanotubes suggests otherwise [38]. Sony Joseph et al. showed that for a number of uncapped carbon nanotubes of various diameters ranging from 8.1 Å to 21.7 Å, in a solution of K+Cl−, with zero bias applied, over the course of 3 ns, the ion occupancy was observed to be largely 0 or 1. Moreover, they found that the ions that enter the tube from either side do not travel across the length of the tube [38]. In fact, transport of ions in ion channels is stabilized by polar interactions with surrounding residues, which is a feature missing in hydrophobic nanotubes. Zero to very low ionic permeation in pores 02, 03, and 04 does agree with these MD simulations, and that naively assigning bulk dielectric constants to the water inside hydrophobic nanopores is quite debatable.
6 Conclusions
In conjunction with Molecular Dynamics, the transport simulation tools adapted from computational electronics provide a hierarchy of methods to describe ionic permeation in nanoscale biological systems such as ion channels. While the use of an implicit water model inherits its own limitations, biological time scales can be resolved thus enabling one to explore current flow, selectivity, and gating mechanisms. The availability of these faster simulations tools could be particularly valuable in predicting the behavior of different mutant structures of a given ion channel, and provide guidance for the experimentalists before initiating costly laboratory procedures.
What's more, water molecules could surprise us in nanoscale confinements, showing very distinct structural conformations, and affect the ionic permeation and selectivity drastically; demanding careful attention in assigning physical properties such as dielectric constant to the implicit water in coarse-grained approaches. Moreover, simple DBF or EMF potential energies computed from single ion steering, though useful in putting light on some physics of the channel, are not enough to describe a channels behavior, as was shown for the case of nanopores with very high axial permittivity.
Acknowledgments
This work was supported by the NIH Roadmap National Center for The Design of Biomimetic Nanoconductors, under The Nanomedicine Development Center Program (http://www.nanoconductor.org/), and also by nanoHUB (http://nanohub.org/).
Appendix: box integration discretization
In order to use box integration for discretizing a D-dimensional Poisson equation
| (A.1) |
with ε̱ being a diagonal D × D tensor, we have to reformulate this differential equation as an integral equation. Integrating (A.1) over a D-dimensional region Ω, and using Gauss theorem, we then get the integral formulation
| (A.2) |
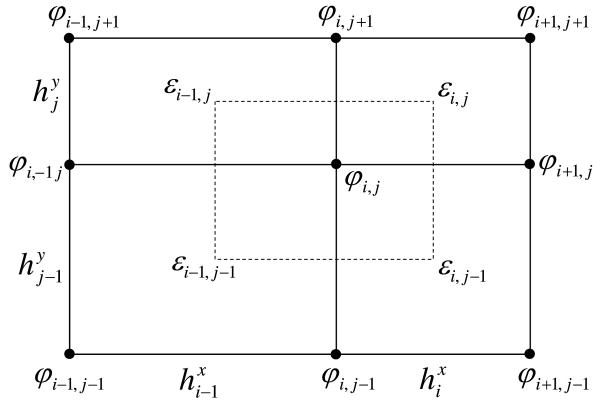
In this appendix we have assume a two-dimensional case. Upgrading to a three-dimensional system would be straightforward and legitimate as the Gauss theorem is also valid for the one and three dimensions. We assume that ε̱ is given on the rectangular regions between nodes, while φ is defined on the grid nodes (as illustrated on Fig. 12). The integration regions Ω are then chosen as rectangles centered around node and extending to the 4 nearest neighbor nodes. We then approximate the gradient ∇φ using centered difference normal to the boundary of the integration region Ω, and average ε̱ over the integration surface ∂Ω. This approach allows us to approximate the left-hand side of the Poisson equation (A.2) in first order as
Fig. 12.
Box integration for a two-dimensional tensor product grid. The integration region is indicated by the dashed rectangle. Charges are assumed to be given on the same nodes as potential
| (A.3) |
where εx and εy are the two components of the diagonal of the tensor ε̱.
Discretizing the right-hand side of equation (A.2) is fairly simple. We discretize ρ on the same grid nodes, as we did for φ.
| (A.4) |
References
- 1.Hille B. Ionic Channels of Excitable Membranes. Sinauer; Sunderland: 2001. [Google Scholar]
- 2.Ashcroft FM. Ion Channels and Disease. Academic Press; New York: 1999. [Google Scholar]
- 3.Eisenberg B. J Comput Electron. 2003;2:245. [Google Scholar]
- 4.Sambrook J, Russell DW. Molecular Cloning: A Laboratory Manual. 3rd. Cold Spring Harbor; New York: 2001. [Google Scholar]
- 5.Watson JD, Baker TA, Bell SP, Gann A, Levine M, Losick R. Molecular Biology of the Gene. 5th. Benjamin-Cummings; Redwood City: 2003. [Google Scholar]
- 6.Tieleman DP, Biggin PC, Smith GR, Sansom MS. Q Rev Biophys. 2001;34:473. doi: 10.1017/s0033583501003729. [DOI] [PubMed] [Google Scholar]
- 7.van der Straaten TA, Kathawala G, Ravaioli U. J Comput Theor Nanosci. 2006;3:1. [Google Scholar]
- 8.Roux B, Allen T, Berneche S, Im W. Q Rev Biophys. 2004;37:15. doi: 10.1017/s0033583504003968. [DOI] [PubMed] [Google Scholar]
- 9.Pauling L, Wilson EB., Jr . Introduction to Quantum Mechanics with Applications to Chemistry. Dover; New York: 1985. [Google Scholar]
- 10.Guillet V, Roblin P, Werner S, Coraiola M, Menestrina G, Monteil H, Prevost G, Mourey L. J Biol Chem. 2004;279:41028. doi: 10.1074/jbc.M406904200. [DOI] [PubMed] [Google Scholar]
- 11.MacKerell AD, Jr, Bashford D, Bellott M, Dunbrack RL, Jr, Evanseck J, Field MJ, Fischer S, Gao J, Guo H, Ha S, Joseph D, Kuchnir L, Kuczera K, Lau FTK, Mattos C, Michnick S, Ngo T, Nguyen DT, Prodhom B, Reiher WE, III, Roux B, Schlenkrich M, Smith J, Stote R, Straub J, Watanabe M, Wiorkiewicz-Kuczera J, Yin D, Karplus M. J Phys Chem B. 1998;102:3586. doi: 10.1021/jp973084f. [DOI] [PubMed] [Google Scholar]
- 12.MacKerell AD, Jr, Brooks B, Brooks CB, III, Nilsson L, Roux B, Won Y, Karplus M. CHARMM: the energy function and its parametrization with an overview of the program. In: Schleyer PvR, Allinger NL, Clark T, Gasteiger J, Kollman PA, Schaefer HF, III, Schreiner PR., editors. Encyclopedia of Computational Chemistry. Vol. 1. Wiley; Chichester: 1998. p. 271. [Google Scholar]
- 13.MacKerell AD, Jr, Bashford D, Bellott M, Dunbrack RL, Jr, Field MJ, Fischer S, Gao J, Guo H, Ha S, Joseph D, Kuchnir L, Kuczera K, Lau FTK, Mattos C, Michnick S, Ngo T, Nguyen DT, Prodhom B, Roux B, Schlenkrich M, Smith J, Stote R, Straub J, Wiorkiewicz-Kuczera J, Karplus M. FASEB J. 1992;6:A143. [Google Scholar]
- 14.Cornell WD, Cieplak P, Bayly CI, Gould IR, Merz KM, Jr, Ferguson DM, Spellmeyer DC, Fox T, Caldwell JW, Kollman PA. J Am Chem Soc. 1995;117:5179. [Google Scholar]
- 15.http://amber.scripps.edu/doc8/amber8.pdf, and references within
- 16.http://www.igc.ethz.ch/gromos/
- 17.Jorgensen WL. OPLS force fields. In: Schleyer PvR., editor. The Encyclopedia of Computational Chemistry. Wiley; Athens: 1998. [Google Scholar]
- 18.Jorgensen WL, Tirado-Rives J. J Am Chem Soc. 1988;110:1657. doi: 10.1021/ja00214a001. [DOI] [PubMed] [Google Scholar]
- 19.Sitkoff D, Sharp KA, Honig B. J Phys Chem. 1994;98:1978. [Google Scholar]
- 20.van der Straaten TA, Kathawala G, Trellakis A, Eisenberg RS, Ravaioli U. Mol Simul. 2005;31:151. [Google Scholar]
- 21.Li SC, Hoyles M, Kuyucak S, Chung SH. Biophys J. 1998;74:37. doi: 10.1016/S0006-3495(98)77764-1. [DOI] [PMC free article] [PubMed] [Google Scholar]
- 22.Chung SH, Hoyles M, Allen TW, Kuyucak S. Biophys J. 1998;75:793. doi: 10.1016/S0006-3495(98)77569-1. [DOI] [PMC free article] [PubMed] [Google Scholar]
- 23.Jacoboni C, Lugli P. The Monte Carlo Method for Semiconductor Device Simulation. Springer; New York: 1989. [Google Scholar]
- 24.Hockney R, Eastwood J. Computer Simulation Using Particles. McGraw-Hill; New York: 1981. [Google Scholar]
- 25.Warshel A, Russell ST. Q Rev Biol. 1984;17:283. doi: 10.1017/s0033583500005333. [DOI] [PubMed] [Google Scholar]
- 26.Schutz CN, Warshel A. Proteins. 2001;44:400. doi: 10.1002/prot.1106. [DOI] [PubMed] [Google Scholar]
- 27.Warshel A, Papazyan A. Curr Opin Struct Biol. 1998;8:211. doi: 10.1016/s0959-440x(98)80041-9. [DOI] [PubMed] [Google Scholar]
- 28.Baker NA, Sept D, Holst MJ, McCammon JA. IBM J Res Dev. 2001;45:427. [Google Scholar]
- 29.Corry B, Kuyucak S, Chung SH. Biophys J. 2000;78:2364. doi: 10.1016/S0006-3495(00)76781-6. [DOI] [PMC free article] [PubMed] [Google Scholar]
- 30.Chen DP, Lear J, Eisenberg RS. Biophys J. 1997;72:97. doi: 10.1016/S0006-3495(97)78650-8. [DOI] [PMC free article] [PubMed] [Google Scholar]
- 31.Noskov SY, Im W, Roux B. Biophys J. 2004;87:2299. doi: 10.1529/biophysj.104.044008. [DOI] [PMC free article] [PubMed] [Google Scholar]
- 32.Rosenfeld Y. J Chem Phys. 1993;98:8126. [Google Scholar]
- 33.Gillespie D, Nonner W, Eisenberg RS. J Phys, Condens Matter. 2002;14:12129. [Google Scholar]
- 34.Im W, Roux B. J Mol Biol. 2002;322:851. doi: 10.1016/s0022-2836(02)00778-7. [DOI] [PubMed] [Google Scholar]
- 35.van der Straaten TA, Tang JM, Ravaioli U, Eisenberg RS, Aluru N. J Comput Electron. 2003;2:29. [Google Scholar]
- 36.Selberherr S. Analysis and Simulation of Semiconductor Devices. Springer; New York: 1984. [Google Scholar]
- 37.http://www.ks.uiuc.edu/Research/vmd
- 38.Joseph S, Mashl RJ, Jakobsson E. Nano Lett. 2003;3(10):1399. [Google Scholar]


