

SUMMARY
Gsα, the G protein which mediates receptor-stimulated cAMP generation, has been implicated as a regulator of adipogenesis and adipose tissue function. Heterozygous Gsα mutations lead to obesity in Albright hereditary osteodystrophy (AHO) patients and in mice. In this study we generated mice with adipose-specific Gsα deficiency. Heterozygotes had 50% loss of Gsα expression in adipose tissue and no obvious phenotype, suggesting that adipose-specific Gsα deficiency is not the cause of obesity in AHO. Homozygotes (FGsKO) had severe adipose tissue deficiency, indicating that Gsα is required for adipogenesis. Although FGsKO mice had impaired cold tolerance and reduced responsiveness of brown adipose tissue (BAT) to sympathetic signaling, diet-induced thermogenesis and fatty acid oxidation in skeletal muscle were increased. In normal mice high-fat diet raised sympathetic nerve activity in muscle but not in BAT. Our results show that cold- and diet-induced thermogenesis may occur in separate tissues, especially when BAT function is impaired.
INTRODUCTION
Obesity is becoming increasingly prevalent with major public health consequences. Understanding adipogenesis and the role of adipose tissue in energy balance is required to identify therapeutic targets. One signaling molecule which regulates energy metabolism is the ubiquitously expressed G protein α-subunit Gsα which couples hormone and neurotransmitter receptors to the generation of intracellular cAMP (Weinstein et al., 2004). Although it is generally considered that Gsα/cAMP pathways are potent stimulators of adipogenesis (Farmer, 2006), some studies have suggested that Gsα is a negative regulator of adipogenesis (Liu et al., 1998; Wang et al., 1992).
Gsα also mediates sympathetic nervous system (SNS)- and hormone-stimulated lipolysis in adipose tissue (Holm, 2003), and SNS stimulation of thermogenesis in brown adipose tissue (BAT) (Puigserver and Spiegelman, 2003). These processes contribute to adaptive thermogenesis, the increase in energy expenditure in response to environmental changes such as cold environment to maintain body temperature (cold-induced thermogenesis; CIT), or to increased caloric intake to maintain energy balance (diet-induced thermogenesis; DIT). Adaptive thermogenesis requires SNS stimulation of β adrenergic receptors in metabolically active tissues (Bachman et al., 2002). BAT plays an important role in CIT due to its high capacity for heat generation caused by uncoupling of lipid oxidation from ATP generation via uncoupling protein UCP1 (Sell et al., 2004). The tissues involved in DIT are less well defined.
Both human and mouse genetic models show that Gsα plays an important role in regulating energy balance and adiposity. Heterozygous Gsα gene mutations in Albright hereditary osteodystrophy (AHO) patients (Long et al., 2006) and in mice (Chen et al., 2005a; Germain-Lee et al., 2005) only lead to obesity when the mutation is on the maternal allele. This is due to the fact that the Gsα gene undergoes genomic imprinting with Gsα being preferentially expressed from the maternal allele in specific tissues (Weinstein et al., 2004). Although one study suggested that Gsα has preferential maternal expression in adipose tissue (Yu et al., 1998), subsequent studies showed no evidence for allele-specific Gsα expression in this tissue (Germain-Lee et al., 2005; Mantovani et al., 2004).
In this study we generated mice with adipose-specific Gsα deficiency (FGsKO) and show that Gsα plays a critical role in adipogenesis in vivo. Heterozygotes had no obvious phenotype, suggesting that Gsα deficiency in adipose tissue is not the cause of obesity in AHO. Notably FGsKO homozygotes had impaired cold tolerance and lack of SNS stimulation of BAT, but were resistant to diet-induced obesity and had increased DIT with evidence for increased oxidative capacity in skeletal muscle. Studies in normal mice showed specific SNS activation in muscle but not BAT in response to high fat diet (HFD). Overall our results suggest that while BAT is required for CIT, DIT may occur in other tissues.
RESULTS
Gsα is Required for Adipogenesis
FGsKO mice were generated by mating mice with Gsα exon 1 floxed mice (E1fl) (Chen et al., 2005a; Chen et al., 2005b) to aP2-cre mice (Abel and Kahn, 2001). Most FGsKO mice were severely affected being very small and having only a 42% survival at 14 weeks. Immunoblotting showed that adipocytes from epididymal white adipose tissue (WAT) and interscapular brown adipose tissue (BAT) of severely affected FGsKO mice had almost no detectable levels of Gsα protein, while no differences in Gsα expression were observed in liver, kidney, or skeletal (soleus) muscle (Figure 1A).
Figure 1. Gsα Deficiency Impairs Adipogenesis In Vivo and In Vitro.

(A) Isolated WAT (epididymal) and BAT adipocytes and other tissues from E1+/+ (wild-type, WT), E1fl/fl:aP2-cre− (Gsαflox/flox), and severely affected FGsKO mice were immunoblotted with a Gsα antibody. The doublet represents the long and short forms of Gsα produced by alternative splicing.
(B) Perirenal, epididymal, mesenteric, inguinal (bottom panel, black arrows), and subcutaneous (bottom panel, red arrows) fat pads from a control and severely affected FGsKO mouse.
(C) Histology of inguinal, epididymal, and mesenteric fat pads from a control and a severely affected FGsKO mouse at 25X and 200X magnification (H & E). Areas shown at 200X magnification are indicated with an arrow and box in the 25X fields. Only a portion of the control WAT pads are shown in the 25X fields.
(D) Adipogenic conversion of E12.5 d mouse embryonic fibroblasts from control and FGsKO mice as determined by oil red O staining.
(E) Quantification of oil red O staining from panel F (n = 3/group) *p < 0.05 vs. controls; mean ± SEM.
Perirenal, epididymal, mesenteric, inguinal, and subcutaneous WAT pads were almost completely absent in severely affected FGsKO mice (Figure 1B). Histological examination confirmed an almost complete absence of mesenteric and epididymal fat in FGsKO mice (Figure 1C). FGsKO mice had a very small strip of inguinal WAT containing very few adipocytes which were smaller than those in controls. Therefore severe Gsα deficiency in WAT pads leads to a profound loss of adipogenesis in vivo.
To determine if the virtual absence of WAT observed in severely affected FGsKO mice may be due to an cell-autonomous effect on adipogenesis, fibroblasts isolated from E12.5d FGsKO and littermate control embryos were treated with isobutylmethylxanthine, dexamethasone, insulin, and rosiglitazone (Ge et al., 2002) to induce adipogenic conversion. Cells from FGsKO embryos had a significantly reduced ability to undergo adipogenesis based upon both the number of cells with lipid droplet formation and total lipid accumulation (Figures 1D, 1E). Overall both our in vivo and in vitro results show that Gsα is required for normal adipogenesis.
Reduced Adipocity in FGsKO Mice is Not Due to Abnormal Energy Balance
The majority of mice were sick and died prematurely and therefore difficult to use in metabolic studies. We therefore concentrated our further studies on less severely affected FGsKO mice which survived into adulthood (3 months of age). This cohort of FGsKO mice had more variable Gsα protein levels in WAT adipocytes (mean expression ~10% of controls but with levels in some mice as high as 30% of controls) presumably due to incomplete cre-mediated recombination (Figure 2A, 2B). Similar levels were also observed in FGsKO BAT (data not shown). Whether this indicates that less recombination leads to greater survival or that Gsα-expressing adipocytes have a growth advantage and increase their proportion over time is unknown. Consistent with the reduced Gsα expression in adipocytes, WAT adipocytes from surviving FGsKO mice had reduced lipolytic responses to maximal isoproterenol stimulation (43% of control, n = 9/group, p<0.05). In addition, surviving FGsKO mice had similarly reduced in vivo metabolic responsiveness (resting O2 consumption at 30°C) to a maximal dose of the β3-adrenergic agonist CL316243 (Bloom et al., 1992), which specifically stimulates metabolism in adipose tissue (Gavrilova et al., 2000) (41% of control, n = 7/group, p<0.05). E1fl/+:aP2-cre+ heterozygotes (Hets) had a 47% reduction of Gsα protein levels in WAT adipocytes with little variation between individual mice (Figures 2A, 2B).
Figure 2. Energy Balance in Adult Mice.

(A) Adipocytes isolated from epididymal and inguinal fat pads of adult control, heterozygous, and FGsKO mice were immunoblotted with Gsα and β-actin antibodies.
(B) Quantification of data from panel A expressed as Gsα/β-actin (n = 5/group).
(C-E) (C) Body weight and length, (D) fat and lean mass as % body weight, and (E) relative organ weights as % body weight in 3 month-old male control and FGsKO mice (n = 5-8/group). BAT, interscapular BAT; Epid: epididymal WAT; Retrop, retroperitoneal WAT; Inguin: inguinal WAT.
(F-I) (F) Food intake, (G) resting and total energy expenditure rate (O2 consumption), (H) resting and total respiratory exchange ratio (RER; vCO2/vO2), and (I) ambulatory and total activity levels measured over 24 hr at 23°C in 3 month old male control and FGsKO mice (n = 8/group).
(J) Body weights of 3 week old female control, heterozygous (E1fl/+:aP2-cre+; Het), and FGsKO offspring of reciprocal E1fl/fl:aP2-cre− × Elfl/+:aP2-cre+ crosses generating heterozygotes with adipose-specific deletion of the maternal (n = 9-28/group) and paternal (n = 8-12/group) Gsα allele, respectively. Similar results were obtained with males.
*p<0.05 or **p<0.01 vs. controls. ##p<0.01 vs. Hets; mean ± SEM. See Figure S1.
Surviving FGsKO mice (3 months old) had significantly reduced weight and body length, with a marked reduction in relative fat mass and WAT pad weights and increased relative lean mass (Figures 2C, 2D, 2E). In contrast, relative weights of interscapular BAT, liver, kidney, and heart were unaffected. Consistent with their reduced adiposity, serum leptin levels were also markedly reduced in FGsKO mice. We found no change in serum adiponectin levels (Table 1).
Table 1.
Serum and Tissue Chemistriesa
| Control | FGsKO | |
|---|---|---|
| Glucose (mg/dl) | 209 ± 8 | 143 ± 6** |
| Insulin (ng/ml) | 2.73 ± 0.76 | 0.40 ± 0.10* |
| Triglycerides (mg/dl) | 209 ± 21 | 123 ± 7* |
| Free fatty acids (mM) | 0.49 ± 0.06 | 0.27 ± 0.07* |
| Leptin (ng/ml) | 9.45 ± 2.24 | 2.39 ± 0.23* |
| Adiponectin (μg/ml) | 5.93 ± 0.53 | 7.50 ± 1.06 |
| Free thyroxine (T4) (ng/dl) | 0.45 ± 0.05 | 0.33 ± 0.06 |
| Thyrotropin (TSH) (ng/dl) | 0.67 ± 0.05 | 0.58 ± 0.02 |
| Corticosterone (ng/ml) | 164 ± 37 | 3.01 ± 0.82 |
| Interleukin 2 (IL-2) (pg/ml) | 4.32 ± 0.70 | 430 ± 133* |
| Tumor necrosis factor-α (TNF-α) (pg/ml) | 4.90 ± 2.81 | 3.85 ± 0.91 |
|
| ||
| Muscle triglyceride content (μmol/g tissue) | 24.2 ± 1.4 | 19.1 ± 1.5* |
| Liver triglyceride content (μmol/g tissue) | 15.1 ± 1.9 | 8.6 ± 1.7* |
Measured in non-fasted 3 mo.-old male mice (n = 6-10/group
p<0.05
p<0.01 vs. controls). Data are expressed as mean ± SEM.
Possible mechanisms for reduced adiposity in FGsKO mice would be reduced food intake, increased energy expenditure, or both. However we found no differences in food intake, energy expenditure (resting and total O2 consumption), or respiratory exchange ratio (RER; vCO2/vO2, resting and total) between FGsKO and control mice when measured at ambient temperature (23°C) and normalized to body weight to account for the large disparity in body size between the two groups (Figures 2F, 2G, 2H). Body weight vs. food intake plot of individual mice showed a similar relationship between these parameters in FGsKO and control mice (Figure S1A). Similarly plots of body weight or lean mass vs. resting or total energy expenditure at either 23°C or 30°C (thermoneutrality) showed no differences in the relationships between these parameters in FGsKO and control mice (Figures S1B, S1C). These results therefore provide no evidence for energy imbalance in FGsKO mice while on a regular diet. FGsKO mice had significantly lower activity levels as compared to controls (Figure 2I).
FGsKO Mice Have Improved Glucose Tolerance and Insulin Sensitivity
Although reduced adiposity is often associated with improved glucose tolerance and insulin sensitivity, lipodystrophic models in which adiposity is severely reduced may result in insulin resistance and diabetes. FGsKO mice were hypoglycemic and hypoinsulinemic under basal fed conditions (Table 1). In addition, FGsKO mice had improved glucose tolerance and insulin sensitivity compared to controls on both regular diet and HFD (Figures 3A-D). Tissue triglyceride accumulation is negatively correlated with insulin sensitivity (Hulver and Dohm, 2004), and increased triglyceride concentration in non-adipose tissue is believed to be a major contributor to impaired insulin sensitivity in lipodystrophy (Simha and Garg, 2006). FGsKO mice had reduced serum triglyceride and free fatty acid levels and tissue (liver and muscle) triglyceride (Table 1), consistent with improved glucose tolerance and insulin sensitivity in these mice.
Figure 3. Glucose and Insulin Tolerance Tests in Adult Mice.
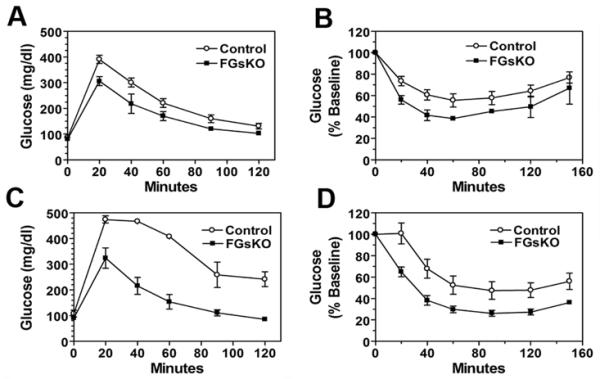
(A-B) (A) Glucose (n = 6-10/group) and (B) insulin tolerance tests (n = 5-8/group) performed on 3 month old male mice on regular diet.
(C-D) (C) Glucose and (D) insulin tolerance tests performed on 4-5 month old female mice after 9 weeks on HFD (n = 6-11/group; mean ± SEM).
Although aP2-cre may also lead to Gsα deficiency in macrophages and inflammatory changes in WAT may affect insulin sensitivity, FGsKO mice had no decrease in WAT macrophage infiltration (Figure 4B), WAT macrophage and inflammatory gene expression (Figure 4C) or circulating levels of the cytokines interleukin-2 and tumor necrosis factor-α (Table 1) that could account for increased insulin sensitivity. FGsKO mice had increased corticosterone levels (Table 1), probably in response to hypoglycemia or other stresses or to reduced inhibition of the hypothalamic-pituitary-adrenal axis due to the presence of lower leptin levels. Increased corticosterone levels however would be expected to lead to increased adiposity and insulin resistance, and therefore do not explain the FGsKO metabolic phenotype. FGsKO mice had normal thyroid function (thyrotropin, free T4) (Table 1). Overall, FGsKO mice have a lean phenotype with improved glucose metabolism, rather than lipodystrophic diabetes.
Figure 4. Histology and Gene Expression in BAT and WAT of Adult Mice.
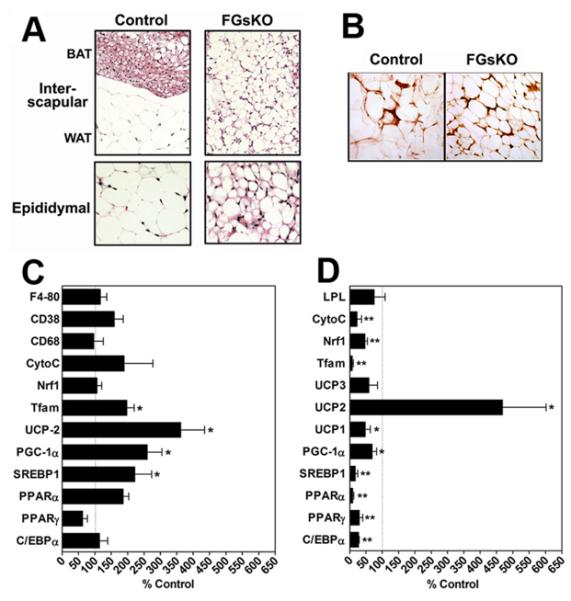
(A) Histological section (H & E) of interscapular (above) and epidydimal (below) fat pads from control (left) and an adult (surviving) FGsKO (right) mouse. Interscapular fat normally consists of distinct BAT and WAT regions (indicated in control) which are indistinguishable in FGsKO mice.
(B) Epididymal WAT from adult control and FGsKO mouse were immunostained with a macrophage marker antibody.
(C-D) Gene expression in (C) epididymal WAT and (D) BAT from FGsKO mice expressed as percent of paired control littermates. Ucp1 mRNA was undetectable in WAT from FGsKO mice. C/EBPα, CCAAT/enhancer-binding protein α; PPARα and -γ, peroxisome proliferator activated receptor-α and-γ; CREB, cAMP responsive element binding protein; SREBP1, sterol regulatory element binding protein 1; PGC-1α, PPAR-γ coactivator 1α; UCP1, 2, and 3, uncoupling protein 1, 2, and 3; Tfam, transcription factor A mitochondrial; Nrf1, nuclear respiratory factor 1; Cyto C, cytochrome C; LPL, lipoprotein lipase. (n = 5-6 pairs)
*p<0.05 or **p<0.01 vs, controls; mean ± SEM.
FGsKO Heterozygotes Show No Evidence for Gsα Imprinting in Adipose Tissue
Gsα is imprinted in a tissue-specific manner (Weinstein et al., 2004), which explains why heterozygous Gsα mutations in AHO patients (Long et al., 2006) or mice (Chen et al., 2005a; Germain-Lee et al., 2005) only lead to obesity when the maternal allele is mutated. If this parent-of-origin effect was due to Gsα imprinting in adipose tissue, then it would be expected that FGsKO heterozygotes with disruption of the Gsα maternal allele should have a phenotype reminiscent of mice with the maternal germline Gsα mutation, while paternal FGsKO heterozygotes should remain unaffected. Heterozygotes had a 47% reduction in WAT adipocyte Gsα protein levels compared to controls with little variation between individual mice (Figures 2A, 2B), consistent with lack of Gsα imprinting in WAT. In addition, there was no significant phenotype in terms of survival, body weight, or adiposity in either maternal or paternal heterozygous FGsKO mice (Figure 2J). These results indicate that the metabolic phenotype resulting from germline disruption of the maternal Gsα allele in mice (and most likely in AHO patients as well) is not due to Gsα imprinting in adipose tissue.
Differential Effects on Lipid Accumulation in WAT and BAT in FGsKO Mice
Consistent with surviving FGsKO mice having smaller WAT pads (Figures 2C, 2E), FGsKO mice had small adipocytes of varying size with reduced lipid accumulation in epididymal WAT (Figure 4A). These cells were functional adipocytes as they secreted adiponectin (Table 1) and had similar insulin-stimulated glucose uptake responses (63%) as those of control adipocytes (76%). Uncoupling protein 1 (Ucp1) mRNA was absent in WAT of FGsKO mice, indicating that WAT did not convert to BAT. Except for increased expression of the sterol-responsive element binding protein-1 (SREBP-1), peroxisome proliferator activated receptor γ coactivator-1α (PGC-1α), UCP2, and the mitochondrial Tfam genes, expression of most WAT genes involved in adipogenesis (eg. C/EBPα, PPARγ), adipocyte function, or inflammation (CD68, CD38, F4-80) were unchanged in FGsKO mice (Figure 4C), although it must be stressed that these findings are in less severely affected mice which developed significant although reduced amounts of WAT and in which Gsα expression was not fully lost in adipocytes.
BAT in adult FGsKO mice showed changes opposite to those of WAT. Unlike WAT fat pads, the interscapular BAT fat pad was not reduced in overall weight in FGsKO mice (Figure 2E). While interscapular fat in controls had distinct regions of WAT and BAT, in FGsKO mice this fat pad contained only adipocytes with a unilocular lipid droplet of intermediate size between WAT and BAT (Figure 4A). This tissue was BAT, as Ucp1 was expressed although at reduced levels (Figure 4D).
Opposite Effects on Cold Tolerance and DIT in FGsKO Mice
FGsKO mice were cold intolerant as they had significantly reduced body temperature at 23°C and, unlike controls, failed to maintain their body temperature in a 4°C environment (Figure 5A) even though they shivered more vigorously based upon visual inspection (data not shown). Cold exposure leads to increased SNS stimulation of BAT which signals through β-adrenergic/Gsα pathways to acutely induce Ucp1 expression. Prior studies showed cold tolerance to be both BAT- and UCP1-dependent and that mice lacking UCP1 lower their body temperature within hours after cold exposure, indicating that CIT in BAT plays an important role in maintaining normal body temperature immediately after cold exposure (Enerback et al., 1997; Lowell et al., 1993). We cannot rule out the possibility that the small size of FGsKO mice may have contributed to their cold intolerance.
Figure 5. Thermogenesis in Adult Mice.

(A) Mouse rectal temperature in FGsKO (■) and contol (○) mice at room temperature (time 0) and hourly after being placed at 4°C (n = 5/group). Differences were significant at all time points.
(B) Ucp1 mRNA levels normalized with β-actin mRNA in BAT of control and FGsKO mice at room temperature (RT) and after 4 hr at 4°C (Cold) (n = 4-6/group).
(C) Growth curves of control and FGsKO mice maintained on regular diet (RD, open symbols) or HFD (filled symbols) (n = 6-8/group).
(D-E) (D) Resting energy expenditure rate and (E) total activity levels at 30°C measured over 4 days before (RD) and after placement on HFD (n = 5/group).
(F) Urinary dihydroxyphenylglycol (DHPG), norepinephrine (NE), and epinephrine (Epi) excretion in control and FGsKO mice normalized to creatinine (n = 5-6/group).
(G) Fatty acid oxidation rates in soleus muscle isolated from control and FGsKO mice (n = 7/group).
(H) Quadriceps muscle from control (left) and FGsKO (right) mice were immunostained with a COXIV antibody. Perinuclear regions (arrows) are shown at higher magnification in inserts. Original magnification 40x and 100x (inserts).
*p<0.05 or **p<0.01 vs. control in panels B, E, and F and vs. regular diet in panel D. #p<0.05 vs. RT in panel B; mean ± SEM.
Ucp1 expression in BAT increased 75% after 4 hours of cold exposure in control mice, while cold exposure had no effect on BAT Ucp1 expression in FGsKO mice (Figure 5B), confirming that BAT in FGsKO mice is unresponsive to the effects of cold due to resistance to SNS stimulation, and this likely contributes to the cold intolerance in these mice. Resistance of BAT to SNS stimulation in FGsKO mice is also consistent with their abnormal BAT histology and reduced expression of genes involved in lipid oxidation and thermogenesis (PGC-1α, UCP1, and mitochondrial genes) (Figures 4A, 4D),. These genes are known to be induced by SNS stimulation (Puigserver and Spiegelman, 2003) and our findings confirm that Gsα/cAMP pathways play a direct role in regulation of these genes in BAT. Ucp2 was upregulated in BAT of FGsKO mice, which was also observed in another model with impaired UCP1-dependent thermogenesis (Enerback et al., 1997).
While controls clearly gained weight when placed on a HFD, FGsKO mice had minimal weight gain and were therefore resistant to diet-induced obesity (Figure 5C). DIT was assessed by measuring resting energy expenditure in the same mice for 4 days on regular diet followed by 4 days on HFD while being maintained at a thermoneutral temperature (30°C) when CIT is minimized. While both control and FGsKO mice significantly increased their resting energy expenditure on HFD, the increase was 3-fold more pronounced in FGsKO mice (FGsKO 60 ± 12% vs. control 18 ± 3% increase, p<0.05) (Figure 5D). Therefore, even in the absence of BAT thermogenesis and an probable absence of CIT, DIT was maintained and even enhanced in FGsKO mice, indicating that in FGsKO mice these two forms of adaptive thermogenesis are independent processes that likely occur in different tissues (CIT in BAT, DIT in tissue other than BAT). Total and ambulatory activity levels were not significantly altered by HFD in either FGsKO mice or controls, although there was a tendency for higher total activity levels on HFD in controls (Figure 5E and data not shown).
To determine if increased SNS activity contributes to the lean phenotype and resistance to diet-induced obesity, we measured catecholamine excretion normalized to urine creatinine to correct for variations in urine collection and lean body mass (Figure 5F). Excretion of norepinephrine and its metabolite dihydroxyphenylglycol (DHPG), which reflect SNS activity (Goldstein, 1995), was significantly increased in FGsKO mice. Epinephrine excretion, which primarily reflects adrenomedullary secretion, was also higher, although not significantly. Therefore FGsKO mice have increased SNS activity, which may be a compensatory response to maintain body temperature or to other stress.
Increased SNS activity may prime FGsKO mice to metabolize excess fatty acids delivered by HFD and prevent weight gain. Given the impaired SNS responsiveness of BAT, increased lipid accumulation and reduced expression of lipid oxidizing genes in BAT in FGsKO mice, BAT is not the likely site for excess lipid metabolism. A more likely site is skeletal muscle, as muscle has a normal complement of Gsα and should be fully sensitive to SNS input. Consistent with this, fatty acid oxidation rates were increased by ~35% in isolated soleus muscles from FGsKO mice (Figure 5G). Moreover, quadriceps muscles (type 2 muscle) from FGsKO mice had increased perinuclear staining for the mitochondrial oxidative enzyme cytochrome C oxidase subunit IV, consistent with increased capacity for oxidative metabolism (Figure 5H).
Differential Effects of Cold and High Fat Diet on SNS Activity in Normal Mice
Our observations in FGsKO mice suggest that CIT and DIT are independent processes that occur in different tissues in these mice. Since both forms of adaptive thermogenesis are driven by SNS stimulation of peripheral tissues, we hypothesized that cold environment and increased caloric intake may normally lead to different patterns of SNS stimulation of specific tissues. To test this hypothesis and to determine if our observations in FGsKO mice may be relevant to normal physiology, we examined the acute effects of cold and HFD on SNS activity in specific tissues of wild-type female mice. In these experiments SNS activity was assessed in interscapular BAT, quadriceps muscle, heart, and liver by measuring accumulation of dihydroxyphenylalanine (DOPA) after administration of the L-aromatic amino acid decarboxylase inhibitor NSD1015, which indicates the rate of catecholamine synthesis (Pacak et al., 1995).
Compared to regular diet, 4 days of HFD led to significantly greater DOPA accumulation in skeletal muscle with no effect of diet in BAT, heart or liver (Figure 6A). These findings show that HFD specifically induces SNS activity in skeletal muscle and is consistent with muscle being a major site of DIT in normal mice. To examine the effects of cold environment, mice were placed at 4°C for 30 minutes, injected with NSD1015, and maintained at 4°C for 2 more hours prior to tissue collection. Mice maintained in the cold showed evidence for increased SNS activity in BAT, muscle, heart, and liver (Figure 6B). Therefore HFD led to a specific increase in SNS activity in muscle but not BAT, while cold environment led to an increase in both BAT and muscle (as well as heart and liver). This differential effect of HFD and cold on BAT SNS activity is consistent with the observation that during these experiments BAT PGC-1α mRNA expression increased 15-fold after exposure to cold but showed only a minimal change after HFD (data not shown). Interestingly although SNS activity increased similarly in BAT and muscle in response to cold, induction of PGC-1α expression was much more dramatic in BAT than skeletal muscle (data not shown).
Figure 6. Cold- and High-Fat Diet-Induced Changes in Tissue Sympathetic Nervous System Activity in Normal Mice.
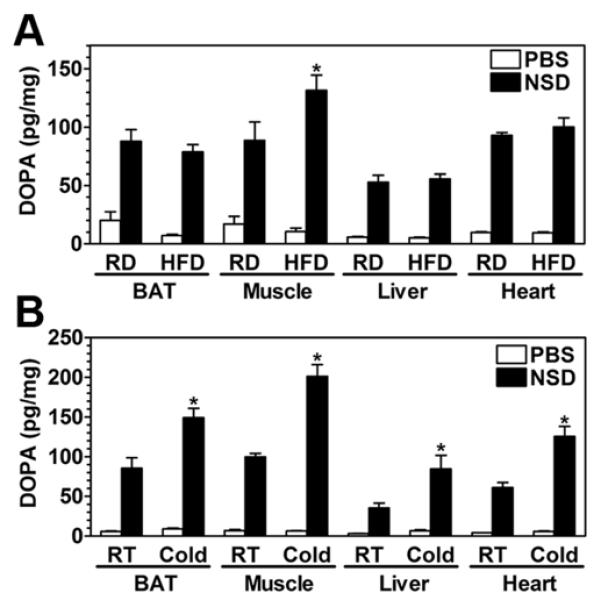
(A) Wild-type female mice were injected with vehicle (PBS) or NSD1015 (NSD) after 4 days of regular (RD) or high fat diet (HFD) and DOPA was measured in interscapular BAT, quadriceps muscle, liver, and heart at 2 hr post-injection (n = 3-5/group).
(B) Similar studies as panel A were performed except mice were maintained at room temperature (RT; 23°C) or were placed at 4°C (Cold) 30 min prior to NSD injection and maintained at 4°C until sacrifice at 2 hr post-injection (n = 5-6/group)
*p < 0.05 vs. RD or vs. 23°C;. mean ± SEM.
DISCUSSION
Although Gsα/cAMP has been generally considered an important promoter of adipogenesis, this role has been questioned by studies in 3T3L1 preadipocytes showing that Gsα repression using antisense oligonucleotides leads to increased adipogenesis and that Gsα expression falls significantly upon adipocyte differentiation (Liu et al., 1998; Wang et al., 1992). This effect of Gsα on adipogenesis of 3T3L1 cells was shown to be independent of cAMP but rather due to direct binding of Gsα to Syk, a tyrosine kinase required for adipogenesis (Wang and Malbon, 1999). This group found that adipose-specific expression of constitutively activated Gsα in mice had little effect on adipogenesis, although this was ascribed to compensatory mechanisms lowering cAMP (Huang et al., 2002). In the present study we show in an in vivo mouse model that in fact Gsα is required for adipogenesis as mice with adipose-specific Gsα deficiency had almost no adipose tissue. This finding was also supported by in vitro studies showing reduced adipogenic conversion of mouse embryonic fibroblasts derived from FGsKO mice. The effect of Gsα to induce adipogenesis probably requires multiple parallel protein kinase A-dependent and -independent pathways. Protein kinase A is known to phosphorylate the transcription factor cAMP response element binding protein (CREB) to induce adipogenic genes like Kruppel-like factor 4 (KLF4) and CEBPβ (Birsoy et al., 2008) and to suppress genes which inhibit adipogenesis like Wnt10b (Bennett et al., 2002). In addition recent studies indicate that adipogenesis may also require activation of cAMP-activated guanine nucleotide exchange factors for Rap1 (Epac’s) (Martini et al., 2008; Petersen et al., 2008).
Unlike mice with homozygous Gsα deletion in adipose tissue, heterozygous mice showed no significant phenotype. Heterozygous germline mutations of the maternal Gsα allele lead to obesity in both AHO patients (Long et al., 2006) and in mice (Chen et al., 2005a; Germain-Lee et al., 2005) due to the fact that Gsα is imprinted with preferential expression from the maternal allele in a small number of tissues. It has been suggested that obesity in AHO patients results from Gsα deficiency in adipose tissue leading to reduced SNS-stimulated lipolysis (Carel et al., 1999) and one study suggested that Gsα is expressed primarily from the maternal allele in adipose tissue (Yu et al., 1998). If these suggestions are correct, heterozygous FGsKO with deletion on the maternal allele should develop obesity, and the absence of this finding in our study suggests that adipose tissue does not contribute to the obesity observed in AHO patients or germline Gsα knockount mice. We also found no molecular evidence for Gsα imprinting in adipose tissue as the heterozygotes showed a 50% decrease in adipose tissue Gsα protein levels with little variation between animals. Consistent with our findings, subsequent studies have also shown no evidence for Gsα imprinting in adipose tissue (Chen et al., 2005a; Germain-Lee et al., 2005; Mantovani et al., 2004). Moreover, we have recently shown that Gsα imprinting in the central nervous system underlies the metabolic effects resulting from germline Gsα mutations and primarily involve reduced energy expenditure rates due to reduced SNS activity (Chen et al., 2009).
One striking feature of FGsKO mice was cold intolerance. Cold intolerance may result from a defect in shivering or non-shivering thermogenesis (CIT). Ucp1-deficient mice with loss of BAT thermogenesis drop their temperature rapidly within hours (Enerback et al., 1997), indicating that BAT is an important site for CIT and contributes to the maintenance of body temperature soon after exposure to cold environment. Several lines of evidence suggest that impaired CIT resulting from an inability of Gsα-deficient BAT to respond to SNS input significantly contributes to the cold intolerance of FGsKO mice. When placed in cold environment FGsKO mice shivered much more vigorously than control mice. Moreover, while Ucp1 expression was rapidly induced in BAT of controls upon cold exposure (a response to increased SNS input that is required for induction of BAT thermogenesis), this response to cold was absent in FGsKO mice. Whatever the contribution of impaired CIT to the cold intolerance of FGsKO mice, the failure of BAT to respond to cold environment and the histological and gene expression abnormalities of FGsKO BAT all point to BAT being dysfunctional and resistant to SNS stimulation in FGsKO mice.
However, even in the absence of normally functioning BAT, FGsKO mice were resistant to diet-induced obesity and had increased DIT. Resistance to diet-induced obesity and/or increased DIT has been observed in several other mouse models with impaired BAT function and cold intolerance, including mice with knockout of thyroid hormone receptor α (Thra), Ucp1, or both Ucp1 and the mitochondrial glycerol-3-phosphate dehydrogenase (Gdm) gene (Anunciado-Koza et al., 2008; Enerback et al., 1997; Liu et al., 2003; Pelletier et al., 2008). In addition, humans with lipodystrophy were also shown to have increased DIT (Savage et al., 2005). Therefore resistance to diet-induced obesity and increased DIT may be a common feature in models with BAT dysfunction. It has been suggested that in the absence of UCP1-mediated thermogenesis in BAT, alternative pathways in other tissues that require more energy utilization to generate the same amount of heat are harnessed to maintain normal body temperature in environments below thermoneutral temperature, and this leads to reduced metabolic efficiency (Anunciado-Koza et al., 2008; Enerback et al., 1997; Feldmann et al., 2009; Liu et al., 2003; Pelletier et al., 2008). This is supported by the observation that the effect on obesity and DIT in these models was dependent on the mice being maintained in temperatures below thermoneutrality. However another model with partial BAT tissue ablation developed hyperphagia and obesity (Lowell et al., 1993). We speculate that feedback mechanisms between BAT and the central nervous system may lead to increased sympathetic activity and energy expenditure in the presence of metabolically inactive BAT.
Potential sites for increased DIT in FGsKO mice include WAT and skeletal muscle. Although thermogenesis has been shown to be increased in WAT of UCP1 knockout mice (Anunciado-Koza et al., 2008; Granneman et al., 2003; Ukropec et al., 2006), high fat diet has recently been shown to induce skeletal muscle mitochondrial content, oxidative metabolism, and thermogenesis in both humans and mice (Hancock et al., 2008; Kus et al., 2008). Given the relatively small amount of WAT in FGsKO mice and the reduced capacity of WAT adipocytes to respond to SNS stimulation due to Gsα deficiency, it is likely that WAT is not a major contributor to the increased DIT in FGsKO mice. Rather we showed skeletal muscle to have increased mitochondrial content and fatty acid oxidative capacity, suggesting that this is the major site for increased DIT in FGsKO mice. Skeletal muscle being the site for DIT would explain why DIT is absent in mice with germline mutation of all β-adrenergic receptors (Bachman et al., 2002) but present in FGsKO mice, in which β-adrenergic/Gsα pathways were disrupted only in adipose tissue.
In order to examine the sites of CIT and DIT in normal mice, we examined the increase in SNS activity (norepinephrine synthesis rate) in various tissues after acute cold exposure or 4 days of HFD. In response to HFD, SNS activity increased in skeletal muscle with no change in BAT, heart, or liver, consistent with SNS-mediated DIT occurring in skeletal muscle but not BAT. The lack of increase of BAT SNS activity after HFD is similar to previous findings (Butler et al., 2001; Sakaguchi et al., 1989; Young et al., 1994), although older studies suggested that oxidative capacity in BAT increases after longer term HFD, particularly in leptin-deficient ob/ob mice (Himms-Hagen et al., 1986; Mercer and Trayhurn, 1987). Although SNS activity increased in all four tissues during acute cold exposure, BAT is unique in its ability to acutely generate heat due to the presence of UCP1, although skeletal muscle may develop the capacity to generate heat upon more chronic cold exposure (Arruda et al., 2008). Overall, our results provide evidence that adaptive thermogenesis consists of independent processes occurring in separate tissues depending upon the environmental stimulus.
EXPERIMENTAL PROCEDURES
Generation of FGsKO Mice
Mice with loxP sites surrounding Gsα exon 1 (E1fl/fl) (Chen et al., 2005a; Chen et al., 2005b) were serially mated with aP2-cre mice (Abel and Kahn, 2001) to generate E1fl/fl:aP2-cre+ (FGsKO) and heterozygous (E1fl/+:aP2-cre+; Het) mice. Maternal and paternal Hets were generated by reciprocal matings of E1fl/fl: aP2-cre− and E1fl/+: aP2-cre+ mice. E1+/+ or aP2-cre− littermates were used as controls. Mice were genotyped by PCR of mouse tail DNA as described (Chen et al., 2005b). Gsα deletion was assessed by immunoblotting with a Gsα antibody (Simonds et al., 1989). Animals were maintained on 12 hr light/dark cycle (6 AM/6 PM) and standard pellet diet (NIH-07, 5% fat by weight). HFD (Bio-Serv) consisted of 59.4 kcal% fat, 16.2 kcal% protein and 24.5 kcal% carbohydrate. Animal experiments were approved by the NIDDK Animal Care and Use Committee. Except when noted, all studies were performed in 10-12 week old male mice.
In Vitro Adipogenesis
Adipogenesis of mouse embryonic fibroblasts (MEFs) was assessed as described (Ge et al., 2002). 12.5 d embryos were digested in 10 ml 0.05% trypsin/PBS at 37°C for 40 min. Cells were collected by centrifugation at 650 × g for 10 min, plated onto 10-cm culture dishes (1.5×10⁶ cells/dish), and cultured in 10 ml of DMEM with 10% fetal bovine serum until confluence. MEFs were split and adipogenesis was induced in DMEM containing 0.5 mM isobutylmethylxanthine, 1 μM dexamethasone, 10 μg/ml insulin (all from Sigma) and 0.5 μM rosiglitazone (Cayman) for 2 d, followed by another 2 d incubation in medium containing 10 μg/ml insulin and 0.5 μM rosiglitazone. Cells were then maintained in medium containing 5 μg/ml insulin and 0.5 μM rosiglitazone. After 7 d of induction, cells were fixed in 10% formalin and stained with oil red O, which was quantified by dissolving in isopropanol and measuring optical absorbance at 510 nm.
Measurement of Food Intake, Body Composition and Metabolism
Body composition was measured in non-anesthetized mice using the Bruker Minispec NMR analyzer mq10 (Bruker Optics). Food intake was measured in 8 week old mice as described (Chen et al., 2005b). O2 consumption rates and motor activities were measured as described (Chen et al., 2009). Acute response of resting O2 consumption rate to the β3-adrenergic agonist CL316243 (1 mg/kg) was measured as described (Xie et al., 2006). For DIT experiments mice were placed in metabolic chambers for 2 days and then measurements were taken for 4 days on regular diet followed by 4 days on HFD. Free fatty acid oxidation rates were measured in isolated soleus muscles as described (Heron-Milhavet et al., 2004).
Biochemical Assays
Serum insulin, leptin, adiponectin, IL-2, TNF-α, and free T4 levels were measured by radioimmunoassay (RIA) (Linco). TSH and corticosterone were measured by RIA (Amersham and ICN, respectively). Free fatty acids and triglycerides were measured using reagents from Roche and Thermo DNA, respectively. Liver and muscle tissue triglyceride levels were measured as described. Urine catecholamine excretion, corrected for creatinine, was measured as described (Chen et al., 2005b).
Gene Expression
Total RNA was isolated with TRIzol reagent (Gibco) and treated with DNase I at 24°C for 15 min. cDNA was synthesized with random primers using reverse transcription reagents (Roche). Real time quantitative RT-PCR was performed as described (Chen et al., 2005b).
Glucose and Insulin Tolerance Tests
For glucose and insulin tolerance tests, fasted mice were given i.p. glucose (2 mg/g body weight) or insulin (Humulin, 0.75 mIU/g). Glucose was measured in tail blood (Glucometer Elite, Bayer).
Glucose Uptake and Lipolysis in Isolated Adipocytes
Adipocytes were isolated from WAT pads as described (Chen et al., 1997). For glucose uptake, adipocytes (0.2 ml) were incubated in KRH buffer (125 mM NaCl, 5 mM KCl, 2.5 mM CaCl2, 2.5 mM MgCl2, 1 mM KH2PO4, 25 mM HEPES) with or without 60 nM insulin (Humulin) for 30 min at 37°C. D-[U-14C] glucose (0.1 ml, specific activity ~6 mCi/mmol in final 0.5 ml, Dupont NEN) was then added to cells and incubated for an additional 30 min. Adipocytes were separated from aqueous buffer by centrifugation in dinonylphthalate oil and glucose uptake was determined by radioactive count. For lipolysis, adipocytes were incubated in KRH buffer with or without isoproterenol (10 μM, Sigma) at 37°C for 1 hr with shaking, and then kept on ice for 10 min to allow adipocytes to float. The lower portion of the reaction mixture was used for measurement of glycerol using an assay kit (Sigma).
Core Body Temperature
Core body temperature was measured using a rectal probe (Thermalet TH-5) inserted 1.0 cm deep at ambient room temperature and during exposure to 4°C, during which time mice were caged individually without bedding. Food and water were provided ad libitum.
SNS Activity in Tissues
SNS activity in tissues was assessed by measuring DOPA accumulation after blocking catecholamine synthesis with NSD1015 (Sigma) as described (Pacak et al., 1995). To study the effects of HFD, 3-5 mo old wild type female mice (Black Swiss) were maintained on regular diet or HFD for 4 days and then administered saline or NSD1015 (100 mg/kg body weight i.p.). BAT, quadriceps muscle, liver, and heart were collected 2 hr post-injection. To study the effects of cold, mice were placed at 4°C for 30 minutes prior to injection of saline or NSD and kept at 4°C for another 2 hours before tissues were collected. Tissue DOPA levels were quantified by reverse phase liquid chromatography. The 2 h time point was chosen based on time course studies showing DOPA accumulation to be linear at this time point.
Immunohistochemistry
Frozen quadriceps muscle sections were fixed in 4% formaldehyde for 10 min, then washed and placed in 3% H2O2 for 10 min. After blocking in 10% normal goat serum, sections were incubated with mouse anti-cytochrome C oxidase subunit IV (1:500 dilution, Abcam) overnight at 4 °C. Sections were then incubated with biotinylated sheep anti-mouse secondary antibody (1:200, Vector) in blocking solution containing 10% sheep serum and 1% BSA in PBS for 30 min at room temperature and counterstained with methyl green. The signal was detected using the ABC peroxidase method (Vector), and visualized with 3,3′-diaminobenzidine. Adipose tissue sections were stained with a macrophage marker antibody (#VP-M640, Vector).
Statistical Analysis
Data are expressed as mean ± SEM. Statistical significance was determined using paired or non-paired student t-test or one-way ANOVA, with differences considered significant at p<0.05.
Supplementary Material
ACKNOWLEDGMENTS
This study was supported by the Intramural Research Programs of NIDDK, NICHD, and NCCAM, NIH. We thank B.B. Kahn for providing aP2-cre mice and W. Jou, S. Pack, and R. Vinitsky for technical support.
Footnotes
Publisher's Disclaimer: This is a PDF file of an unedited manuscript that has been accepted for publication. As a service to our customers we are providing this early version of the manuscript. The manuscript will undergo copyediting, typesetting, and review of the resulting proof before it is published in its final citable form. Please note that during the production process errors may be discovered which could affect the content, and all legal disclaimers that apply to the journal pertain.
SUPPLEMENTAL DATA Supplemental data include one figure and can be found online at..
REFERENCES
- Abel ED, Kahn BB. Adipose-selective targeting of the GLUT4 gene impairs insulin action in muscle and liver. Nature. 2001;409:729–733. doi: 10.1038/35055575. [DOI] [PubMed] [Google Scholar]
- Anunciado-Koza R, Ukropec J, Koza RA, Kozak LP. Inactivation of UCP1 and the glycerol phosphate cycle synergistically increases energy expenditure to resist diet-induced obesity. J Biol Chem. 2008;283:27688–27697. doi: 10.1074/jbc.M804268200. [DOI] [PMC free article] [PubMed] [Google Scholar]
- Arruda AP, Ketzer LA, Nigro M, Galina A, Carvalho DP, de Meis L. Cold tolerance in hypothyroid rabbits: role of skeletal muscle mitochondria and sarcoplasmic reticulum Ca2+ ATPase isoform 1 heat production. Endocrinology. 2008;149:6262–6271. doi: 10.1210/en.2008-0564. [DOI] [PubMed] [Google Scholar]
- Bachman ES, Dhillon H, Zhang CY, Cinti S, Bianco AC, Kobilka BK, Lowell BB. βAR signaling required for diet-induced thermogenesis and obesity resistance. Science. 2002;297:843–845. doi: 10.1126/science.1073160. [DOI] [PubMed] [Google Scholar]
- Bennett CN, Ross SE, Longo KA, Bajnok L, Hemati N, Johnson KW, Harrison SD, MacDougald OA. Regulation of Wnt signaling during adipogenesis. J Biol Chem. 2002;277:30998–31004. doi: 10.1074/jbc.M204527200. [DOI] [PubMed] [Google Scholar]
- Birsoy K, Chen Z, Friedman J. Transcriptional regulation of adipogenesis by KLF4. Cell Metab. 2008;7:339–347. doi: 10.1016/j.cmet.2008.02.001. [DOI] [PMC free article] [PubMed] [Google Scholar]
- Bloom JD, Dutia MD, Johnson BD, Wissner A, Burns MG, Largis EE, Dolan JA, Claus TH. Disodium (R,R)-5-[2-[[2-(3-chlorophenyl)-2-hydroxyethyl]-amino] propyl]-1,3-benzodioxole-2,2-dicarboxylate (CL 316,243). A potent β-adrenergic agonist virtually specific for β3 receptors. A promising antidiabetic and antiobesity agent. J Med Chem. 1992;35:3081–3084. doi: 10.1021/jm00094a025. [DOI] [PubMed] [Google Scholar]
- Butler AA, Marks DL, Fan W, Kuhn CM, Bartolome M, Cone RD. Melanocortin-4 receptor is required for acute homeostatic responses to increased dietary fat. Nat Neurosci. 2001;4:605–611. doi: 10.1038/88423. [DOI] [PubMed] [Google Scholar]
- Carel JC, Le Stunff C, Condamine L, Mallet E, Chaussain JL, Adnot P, Garabedian M, Bougneres P. Resistance to the lipolytic action of epinephrine: a new feature of protein Gs deficiency. J Clin Endocrinol Metab. 1999;84:4127–4131. doi: 10.1210/jcem.84.11.6145. [DOI] [PubMed] [Google Scholar]
- Chen H, Wertheimer SJ, Lin CH, Katz SL, Amrein KE, Burn P, Quon MJ. Protein-tyrosine phosphatases PTP1B and Syp are modulators of insulin-stimulated translocation of GLUT4 in transfected rat adipose cells. J Biol Chem. 1997;272:8026–8031. doi: 10.1074/jbc.272.12.8026. [DOI] [PubMed] [Google Scholar]
- Chen M, Gavrilova O, Liu J, Xie T, Deng C, Nguyen AT, Nackers LM, Lorenzo J, Shen L, Weinstein LS. Alternative Gnas gene products have opposite effects on glucose and lipid metabolism. Proc Natl Acad Sci USA. 2005a;102:7386–7391. doi: 10.1073/pnas.0408268102. [DOI] [PMC free article] [PubMed] [Google Scholar]
- Chen M, Gavrilova O, Zhao W-Q, Nguyen A, Lorenzo J, Shen L, Nackers L, Pack S, Jou W, Weinstein LS. Increased glucose tolerance and reduced adiposity in the absence of fasting hypoglycemia in mice with liver-specific Gsα deficiency. J Clin Invest. 2005b;115:3217–3227. doi: 10.1172/JCI24196. [DOI] [PMC free article] [PubMed] [Google Scholar]
- Chen M, Wang J, Dickerson KE, Kelleher J, Xie T, Gupta D, Lai EW, Pacak K, Gavrilova O, Weinstein LS. Central nervous system imprinting of the G protein Gsα and its role in metabolic regulation. Cell Metab. 2009;9:548–555. doi: 10.1016/j.cmet.2009.05.004. [DOI] [PMC free article] [PubMed] [Google Scholar]
- Enerback S, Jacobsson A, Simpson EM, Guerra C, Yamashita H, Harper ME, Kozak LP. Mice lacking mitochondrial uncoupling protein are cold-sensitive but not obese. Nature. 1997;387:90–94. doi: 10.1038/387090a0. [DOI] [PubMed] [Google Scholar]
- Farmer SR. Transcriptional control of adipocyte formation. Cell Metab. 2006;4:263–273. doi: 10.1016/j.cmet.2006.07.001. [DOI] [PMC free article] [PubMed] [Google Scholar]
- Feldmann HM, Golozoubova V, Cannon B, Nedergaard J. UCP1 ablation induces obesity and abolishes diet-induced thermogenesis in mice exempt from thermal stress by living at thermoneutrality. Cell Metab. 2009;9:203–209. doi: 10.1016/j.cmet.2008.12.014. [DOI] [PubMed] [Google Scholar]
- Gavrilova O, Marscus-Samuels B, Reitman ML. Lack of responses to β3 adrenergic agonist in lipoatrophic A-ZIP/F-1 mice. Diabetes. 2000;49:1910–1916. doi: 10.2337/diabetes.49.11.1910. [DOI] [PubMed] [Google Scholar]
- Ge K, Guermah M, Yuan CX, Ito M, Wallberg AE, Spiegelman BM, Roeder RG. Transcription coactivator TRAP220 is required for PPARγ2-stimulated adipogenesis. Nature. 2002;417:563–567. doi: 10.1038/417563a. [DOI] [PubMed] [Google Scholar]
- Germain-Lee EL, Schwindinger W, Crane JL, Zewdu R, Zweifel LS, Wand G, Huso DL, Saji M, Ringel MD, Levine MA. A mouse model of Albright hereditary osteodystrophy generated by targeted disruption of exon 1 of the Gnas gene. Endocrinology. 2005;146:4697–4709. doi: 10.1210/en.2005-0681. [DOI] [PubMed] [Google Scholar]
- Goldstein DS. Stress, catecholamines, and cardiovascular disease. Oxford University Press; New York, NY: 1995. [Google Scholar]
- Granneman JG, Burnazi M, Zhu Z, Schwamb LA. White adipose tissue contributes to UCP1-independent thermogenesis. Am J Physiol Endocrinol Metab. 2003;285:E1230–1236. doi: 10.1152/ajpendo.00197.2003. [DOI] [PubMed] [Google Scholar]
- Hancock CR, Han DH, Chen M, Terada S, Yasuda T, Wright DC, Holloszy JO. High-fat diets cause insulin resistance despite an increase in muscle mitochondria. Proc Natl Acad Sci USA. 2008;105:7815–7820. doi: 10.1073/pnas.0802057105. [DOI] [PMC free article] [PubMed] [Google Scholar]
- Heron-Milhavet L, Haluzik M, Yakar S, Gavrilova O, Pack S, Jou WC, Ibrahimi A, Kim H, Hunt D, Yau D, et al. Muscle-specific overexpression of CD36 reverses the insulin resistance and diabetes of MKR mice. Endocrinology. 2004;145:4667–4676. doi: 10.1210/en.2003-1543. [DOI] [PubMed] [Google Scholar]
- Himms-Hagen J, Hogan S, Zaror-Behrens G. Increased brown adipose tissue thermogenesis in obese (ob/ob) mice fed a palatable diet. Am J Physiol. 1986;250:E274–281. doi: 10.1152/ajpendo.1986.250.3.E274. [DOI] [PubMed] [Google Scholar]
- Holm C. Molecular mechanisms regulating hormone-sensitive lipase and lipolysis. Biochem Soc Trans. 2003;31:1120–1124. doi: 10.1042/bst0311120. [DOI] [PubMed] [Google Scholar]
- Huang X-P, Song X, Wang H-Y, Malbon CC. Targeted expression of activated Q227L Gαs in vivo. Am J Physiol Cell Physiol. 2002;283:C386–395. doi: 10.1152/ajpcell.00320.2001. [DOI] [PubMed] [Google Scholar]
- Hulver MW, Dohm GL. The molecular mechanism linking muscle fat accumulation to insulin resistance. Proc Nutr Soc. 2004;63:375–380. doi: 10.1079/pns2004351. [DOI] [PubMed] [Google Scholar]
- Kus V, Prazak T, Brauner P, Hensler M, Kuda O, Flachs P, Janovska P, Medrikova D, Rossmeisl M, Jilkova Z, et al. Induction of muscle thermogenesis by high-fat diet in mice: association with obesity-resistance. Am J Physiol Endocrinol Metab. 2008;295:E356–367. doi: 10.1152/ajpendo.90256.2008. [DOI] [PubMed] [Google Scholar]
- Liu X, Malbon CC, Wang HY. Identification of amino acid residues of Gsα critical to repression of adipogenesis. J Biol Chem. 1998;273:11685–11694. doi: 10.1074/jbc.273.19.11685. [DOI] [PubMed] [Google Scholar]
- Liu X, Rossmeisl M, McClaine J, Riachi M, Harper ME, Kozak LP. Paradoxical resistance to diet-induced obesity in UCP1-deficient mice. J Clin Invest. 2003;111:399–407. doi: 10.1172/JCI15737. [DOI] [PMC free article] [PubMed] [Google Scholar]
- Long DN, McGuire S, Levine MA, Weinstein LS, Germain-Lee EL. Body mass index differences in pseudohypoparathyroidism type 1a versus pseudopseudohypoparathyroidism implicate paternal imprinting of Gαs in the development of human obesity. J Clin Endocrinol Metab. 2007;92:1073–1079. doi: 10.1210/jc.2006-1497. [DOI] [PubMed] [Google Scholar]
- Lowell BB, V SS, Hamann A, Lawitts JA, Himms-Hagen J, Boyer BB, Kozak LP, Flier JS. Development of obesity in transgenic mice after genetic ablation of brown adipose tissue. Nature. 1993;366:740–742. doi: 10.1038/366740a0. [DOI] [PubMed] [Google Scholar]
- Mantovani G, Bondioni S, Locatelli M, Pedroni C, Lania AG, Ferrante E, Filopanti M, Beck-Peccoz P, Spada A. Biallelic expression of the Gsα gene in human bone and adipose tissue. J Clin Endocrinol Metab. 2004;89:6316–6319. doi: 10.1210/jc.2004-0558. [DOI] [PubMed] [Google Scholar]
- Martini CN, Plaza MV, Vila MD. PKA-dependent and independent cAMP signaling in 3T3-L1 fibroblasts differentiation. Mol Cell Endocrinol. 2008;298:42–47. doi: 10.1016/j.mce.2008.10.023. [DOI] [PubMed] [Google Scholar]
- Mercer SW, Trayhurn P. Effect of high-fat diets on energy-balance and thermogenesis in brown adipose-tissue of lean and genetically-obese Ob/Ob mice. J Nutr. 1987;117:2147–2153. doi: 10.1093/jn/117.12.2147. [DOI] [PubMed] [Google Scholar]
- Pacak K, Palkovits M, Kvetnansky R, Matern P, Hart C, Kopin IJ, Goldstein DS. Catecholaminergic inhibition by hypercortisolemia in the paraventricular nucleus of conscious rats. Endocrinology. 1995;136:4814–4819. doi: 10.1210/endo.136.11.7588211. [DOI] [PubMed] [Google Scholar]
- Pelletier P, Gauthier K, Sideleva O, Samarut J, Silva JE. Mice lacking the thyroid hormone receptor-α gene spend more energy in thermogenesis, burn more fat, and are less sensitive to high-fat diet-induced obesity. Endocrinology. 2008;149:6471–6486. doi: 10.1210/en.2008-0718. [DOI] [PubMed] [Google Scholar]
- Petersen RK, Madsen L, Pedersen LM, Hallenborg P, Hagland H, Viste K, Doskeland SO, Kristiansen K. Cyclic AMP (cAMP)-mediated stimulation of adipocyte differentiation requires the synergistic action of Epac- and cAMP-dependent protein kinase-dependent processes. Mol Cell Biol. 2008;28:3804–3816. doi: 10.1128/MCB.00709-07. [DOI] [PMC free article] [PubMed] [Google Scholar]
- Puigserver P, Spiegelman BM. Peroxisome proliferator-activated receptor-γ coactivator 1α (PGC-1α): transcriptional coactivator and metabolic regulator. Endocr Rev. 2003;24:78–90. doi: 10.1210/er.2002-0012. [DOI] [PubMed] [Google Scholar]
- Sakaguchi T, Arase K, Fisler JS, Bray GA. Effect of a high-fat diet on firing rate of sympathetic nerves innervating brown adipose tissue in anesthetized rats. Physiol Behav. 1989;45:1177–1182. doi: 10.1016/0031-9384(89)90106-6. [DOI] [PubMed] [Google Scholar]
- Savage DB, Murgatroyd PR, Chatterjee VK, O’Rahilly S. Energy expenditure and adaptive responses to an acute hypercaloric fat load in humans with lipodystrophy. J Clin Endocrinol Metab. 2005;90:1446–1452. doi: 10.1210/jc.2004-1494. [DOI] [PubMed] [Google Scholar]
- Sell H, Deshaies Y, Richard D. The brown adipocyte: update on its metabolic role. Int J Biochem Cell Biol. 2004;36:2098–2104. doi: 10.1016/j.biocel.2004.04.003. [DOI] [PubMed] [Google Scholar]
- Simha V, Garg A. Lipodystrophy: lessons in lipid and energy metabolism. Curr Opin Lipidol. 2006;17:162–169. doi: 10.1097/01.mol.0000217898.52197.18. [DOI] [PubMed] [Google Scholar]
- Simonds WF, Goldsmith PK, Woodard CJ, Unson CG, Spiegel AM. Receptor and effector interactions of Gs. Functional studies with antibodies to the αs carboxyl-terminal decapeptide. FEBS Lett. 1989;249:189–194. doi: 10.1016/0014-5793(89)80622-2. [DOI] [PubMed] [Google Scholar]
- Ukropec J, Anunciado RP, Ravussin Y, Hulver MW, Kozak LP. UCP1-independent thermogenesis in white adipose tissue of cold-acclimated Ucp1−/− mice. J Biol Chem. 2006;281:31894–31908. doi: 10.1074/jbc.M606114200. [DOI] [PubMed] [Google Scholar]
- Wang H, Malbon CC. Gsα repression of adipogenesis via Syk. J Biol Chem. 1999;274:32159–32166. doi: 10.1074/jbc.274.45.32159. [DOI] [PubMed] [Google Scholar]
- Wang H, Watkins DC, Malbon CC. Antisense oligodeoxynucleotides to Gs α-subunit sequence accelerate differentiation of fibroblasts to adipocytes. Nature. 1992;358:334–337. doi: 10.1038/358334a0. [DOI] [PubMed] [Google Scholar]
- Weinstein LS, Liu J, Sakamoto A, Xie T, Chen M. Minireview: GNAS: normal and abnormal functions. Endocrinology. 2004;145:5459–5464. doi: 10.1210/en.2004-0865. [DOI] [PubMed] [Google Scholar]
- Xie T, Plagge A, Gavrilova O, Pack S, Jou W, Lai EW, Frontera M, Kelsey G, Weinstein LS. The alternative stimulatory G protein α-subunit XLαs is a critical regulator of energy and glucose metabolism and sympathetic nerve activity in adult mice. J Biol Chem. 2006;281:18989–18999. doi: 10.1074/jbc.M511752200. [DOI] [PMC free article] [PubMed] [Google Scholar]
- Young JB, Daly PA, Uemura K, Chaouloff F. Effects of chronic lard feeding on sympathetic nervous system activity in the rat. Am J Physiol. 1994;267:R1320–1328. doi: 10.1152/ajpregu.1994.267.5.R1320. [DOI] [PubMed] [Google Scholar]
- Yu S, Yu D, Lee E, Eckhaus ME, Lee R, Corria Z, Accili D, Westphal H, Weinstein LS. Variable and tissue-specific hormone resistance in heterotrimeric Gs protein α-subunit (Gsα) knockout mice is due to tissue-specific imprinting of the Gsα gene. Proc Natl Acad Sci USA. 1998;95:8715–8720. doi: 10.1073/pnas.95.15.8715. [DOI] [PMC free article] [PubMed] [Google Scholar]
Associated Data
This section collects any data citations, data availability statements, or supplementary materials included in this article.