

Abstract
Visible spectroscopy was used to measure real-time changes in the oxidation state of cytochrome c (cyt c) and the a-cytochromes (cyt aa3) of cytochrome oxidase during mitochondrial outer membrane permeabilization (MOMP) initiated by anisomycin in HL-60 cells. The oxidation state of mitochondrial cyt c was found to be ≈62% oxidized before MOMP and became ≈70% oxidized after MOMP. In contrast, the cytosolic pool of cyt c was found to be almost fully reduced. This oxidation change allows cyt c release to be continuously and quantitatively monitored in real time. Anoxia and antimycin were used to fully reduce and fully oxidize, respectively, the mitochondrial pool of cyt c and it was found that the release of cyt c was independent of it oxidation state consistent with a simple model of cyt c passively diffusing down a concentration gradient through a pore or tear in the outer membrane. After MOMP was complete, the flux of cyt c diffusing back into the mitochondria was measured from the residual mitochondrial oxygen consumption after complete inhibition of the bc1 with antimycin and myxothiazol. The outer membrane was found to be highly permeable after MOMP implying that the reduction of cyt c in the cytosol must be very rapid. The permeability of the outer membrane measured in this study would result in the release of cyt c with a time constant of less than 1 s.
Keywords: Cytochrome c, Electron transport chain (ETC), Mitochondrial outer membrane permeabilization (MOMP), Caspase, Oxidation state, Cytochrome oxidase
Introduction
There are two models of mitochondrial outer membrane permeabilization (MOMP), one suggesting MOMP occurs following the formation of a pore, possibly composed of oligomers of Bax or Bak, in the outer mitochondrial membrane. The other proposes MOMP is the result of rupture of the outer membrane secondary to swelling of the matrix [1]. MOMP can be initiated by either the intrinsic pathway of apoptosis via activation of Bax and Bak or through the extrinsic pathway of apoptosis via activation of plasma membrane death receptors [2]. Death receptor engagement leads to activation of caspase-8 and caspase-10 which truncate Bid and activate Bax or Bak [2].
Cytochrome c (cyt c) is a 12.5KDa protein that is usually localized in the mitochondrial inter-membrane space (IMS) where it is an integral component of the electron transport chain (ETC). When cyt c is released into the cytosol, it binds with apoptotic protease activating factor 1 (apaf1) to form the apoptosome which in turn binds and activates the initiator caspase, caspase-9 [3]. Caspase-9 then cleaves effector caspases, such as caspase-3, which cleave cellular proteins that result in the cellular hallmarks of apoptosis. In its role in the ETC, cyt c shuttles electrons between the cyt c1 center of the bc1 complex (complex III), and the CuA center of cytochrome oxidase (CytOx). The movement of electrons along the ETC is coupled to proton extrusion from the matrix to the IMS by complex I, the bc1 complex and CytOx creating a chemiosmotic potential for protons across the inner membrane. The energy released when protons are returned to the matrix is used by the ATP synthase to generate ATP from ADP and inorganic phosphate.
In common with the other cytochromes of the ETC, cyt c is a one electron carrier and its specific extinction spectrum changes depending on whether the cytochrome is reduced (carrying an electron) or oxidized (not carrying an electron). These spectral changes have been exploited extensively to probe the function of purified mitochondrial complexes [4, 5] and isolated mitochondria [6, 7] using two-wavelength spectrophotometry. Recently, we have developed an optical spectroscopy technique that uses changes in the attenuation spectrum in the visible range to quantify the oxidation changes from the cytochromes of the bc1 complex, cyt c and the a-cytochromes (cyt aa3) of CytOx continuously in real-time from living cells [8].
Previously, it has been shown that exogenous cyt c becomes reduced when added to cytosolic cell extracts [9] but it is not known what oxidation changes occur when endogenous cyt c is released in living cells. There is in vitro evidence that only oxidized cyt c can activate the apoptosome and initiate apoptosis [10, 11] but this has not been confirmed in living cells. Furthermore it has been suggested that the cytosolic pool of cyt c is maintained oxidized by mitochondrial CytOx in cells undergoing MOMP as a mechanism to regulate apoptotic induction but the evidence has been obtained from cell homogenates rather than living cells [12]. The goal of this paper is to measure the oxidation state of mitochondrial cyt c before and after anisomycin-induced MOMP and determine the oxidation changes that endogenous cyt c undergoes upon release into the cytosol in living cells. We found that endogenous cyt c was not maintained oxidized by CytOx upon release into the cytosol but became highly reduced. We used this reduction to show that cyt c release was independent of its oxidation state but became reduced in the cytosol and, for the first time, to quantitate the permeability of the outer mitochondrial membrane in living cells.
Materials and methods
Cell culture
HL-60 cells were cultured at 37°C in spinner flasks in phenol-red free RPMI medium with 10% fetal bovine serum and antibiotics in a 5% CO2 atmosphere. Cells were spun down at 500 g for 5 min and resuspended at a concentration of 2.0 × 10⁷ cells/mL in RPMI medium. The cell volume fraction was measured from the wet weight of 2.0 × 10⁷ cells assuming a density of 1.05 g/mL.
Respirometry
Studies were carried out in a custom built chamber that held 6 mL of cell suspension in a cylindrical quartz cuvette of inside diameter of 17 mm and surrounded by water jacket to maintain the cells at 37°C. The cells were stirred with a glass stir bar and oxygen tension within the cell suspension was measured from the fluorescence lifetime of phosphorescent membrane (Tautheta Instruments, Boulder, CO) located at the bottom of the chamber. The phosphorescent-lifetime oxygen optode was found to have much better precision and temporal response than a conventional Clark electrode. The chamber was either sealed and used as a respirometer or the cells were oxygenated or deoxygenated under computer control by exchange of oxygen across 90 mm of silicone tubing (Renasil, Braintree Scientific, Braintree, MA) immersed in the cell suspension. In respirometer mode, the oxygen consumption of the cell suspension was measured continuously by numerical differentiation of the oxygen concentration trace with respect to time.
Spectroscopy
The cells were illuminated with a high power warm-white light emitting diode (NFSW036B, Nichia, Detroit, MI) and light was collected with 1 mm NA 0.37 optical fiber (ThorLabs, Newton, NJ) in remission geometry with a source-detector separation of 10 mm. The differential pathlength was measured using the 2nd differential technique from the 740 nm absorption band of water [13] and was found to be ≈39 mm in this configuration. The output of the fiber was focused onto the slits of a spectrograph (Triax 320, HORIBA Jobin–Yvon, Edison, NJ) equipped with a 600 g/mm grating blazed at 500 nm and complete spectra were collected on an 1024 × 127 pixel back-thinned CCD camera cooled to 210 K (DV401BV, Andor Technology, South Windsor, CT). The pixel bandpass was ≈0.13 nm and the entrance slit width was set to give a spectral resolution of 1 nm.
The raw intensity spectra were converted to attenuation spectra using a dilute solution of titanium dioxide nano particles as a reference. The change in cytochrome oxidation was calculated by the minimizing of an error function, χ2, which is given by
| (1) |
where ΔA(λ) is the measured change in attenuation spectrum, λ is wavelength, bn are coefficients of a quadratic background to account for a baseline drift and changes in scattering coefficient, ρ is the differential pathlength, ΔCc is the oxidation change of the cth cytochrome, εc(λ) is the oxidized–reduced specific extinction spectrum of the cth cytochrome and the sum is over all the CCD pixels between 520 and 630 nm (approximately 700 wavelengths). The minimization is with respect to the coefficients bn and ΔCc using a differential pathlength of 39 mm. The wavelength dependence of the differential pathlength has been measured in this configuration using the added dye method and found to be independent of wavelength over this wavelength range. Spectra are presented with the background subtracted.
Permeability model
In a simple diffusion model in which cyt c passively diffuses out of a protein pore (as shown in Fig. 1), or a tear in the outer membrane, the efflux of cyt c, Fo, measured in moles per second, is given by Fo = KpCm where Kp is the permeability constant of the outer membrane and Cm is the IMS concentration of cyt c. Likewise, the influx of cyt c, Fi, back through the membrane into the IMS is given by Fi = KpCc where Cc is the cytosolic concentration of cyt c.
Fig. 1.
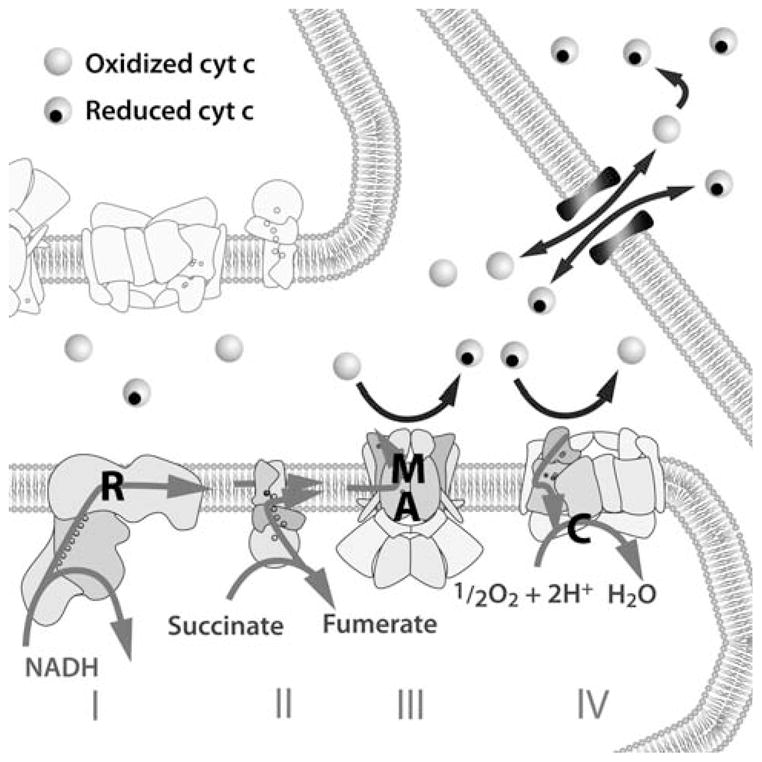
A cartoon of the electron transport chain, intermembrane space and permeabilized outer membrane showing complexes I–IV and cyt c which can either be oxidized (not carrying an electron) or reduced (carrying an electron as indicated by the black circle). Electrons enter the chain from NADH at complex I, which is inhibited by rotenone (R), and from succinate at complex II. These electrons reduce cyt c at the bc1 complex and this reaction is inhibited by antimycin (A) and myxothiazol (M). Cyt c diffuses to cytochrome oxidase where it is reoxidized and the resulting electron is used to reduce oxygen to water in a reaction that can be inhibited with cyanide (C). Cyt c in the intermembrane space is typically ≈60% oxidized at baseline in HL-60 cells and is usually trapped in the intermembrane space. On MOMP, there is a net efflux of cyt c into the cytosol until the concentration of cyt c is equilibrated across the outer membrane when the efflux and influx of cyt c are equal
After MOMP, the rate in decline of the quantity of cyt c in the IMS, measured in moles, is equal to the difference between the efflux and influx, e.g.
| (2) |
where Qm is the quantity of cyt c in the IMS and is given by Qm = VmCm where Vm is the volume of the IMS. On MOMP there is a net efflux of cyt c until the IMS and cytosolic concentrations of cyt c are equilibrated whereupon the influx is equal to the efflux. The equilibrium concentration of cyt c in the IMS and cytosol will be Qt/(Vm + Vc) where Qt is the total quantity of cyt c and Vc is the volume of the cytosol. The fraction of cyt c released is given by Vc/(Vm + Vc) which is close to 1 because Vc is much larger than Vm. Eq. (2) can be solved to reveal an exponential decline in the mitochondrial concentration of cyt c with a time constant, tc, of VmVc/Kp(Vm + Vc).
In a simple diffusion model, the efflux and influx of cyt c is independent of its oxidation state so that the efflux and influx of oxidized and reduced cyt c is proportional to the IMS and cytosolic concentrations of oxidized and reduced cyt c, respectively. We find that cyt c becomes fully reduced in the cytosol so that the influx of electrons as reduced cyt c is equal to the influx of cyt c. The IMS pool of cyt c is fully oxidized after inhibition of the bc1 complex with antimycin and myxothiazol so that the efflux of cyt c does not result in an efflux of electrons. Under these conditions and after release is complete, there is a net influx of electrons, Fne, given by Fne = KpQt/(Vm + Vc) which is equal to the equilibrium influx and efflux of cyt c. These electrons are used by CytOx to reduce oxygen to water with a stoichiometry of 4 electrons per oxygen so that Fne, and hence the equilibrium influx and efflux of cyt c, can be measured from the residual mitochondrial oxygen consumption after inhibition of the bc1 complex.
The time constant for cyt c release can be calculated from Fne using:
| (3) |
This simple diffusion model does not account for spatial gradients in the concentration of cyt c that may exist in the IMS and cytosol.
Western analysis
Separation of mitochondrial and cytosolic fractions was obtained with the digitonin method [14]. Briefly, aliquots of 4 × 10⁶ cells (200 μL) were removed from the chamber and permeabilized on ice with 21.33 μg digitonin in 80 μL buffer containing 75 mM NaCl, 1 mM NaH2PO4, 8 mM Na2HPO4, 250 mM sucrose, and protease and phosphatase inhibitors. Cells were incubated for 30 s in ice cold buffer followed by centrifugation for 2 min at 12,500 rpm.
The supernatant was removed as the cytosolic fraction and the pellet was resuspended in the same volume of buffer not containing digitonin. 20 μL Laemmli sample buffer supplemented with 10% dithiothreitol and 10% SDS was added to all samples. Total and pellet fractions were solubilized by sonication and boiled for 5 min. Extracts were electrophoresed on 15% Tris–HCl gels, transferred to PVDF membrane, blocked for 1 h in Tris-buffered saline (TBS) with 0.05% Tween 20, 3% milk and 0.01% SDS. The membranes were probed with the specified antibody overnight at 4°C. A secondary antibody was used at a 1:5,000 dilution and the membrane read on a two-wavelength Odyssey infrared imaging system (Li-Cor, Biosciences, NE). The protein content of the bands was quantified with custom software which integrated the signal from the digital images with a correction for the background fluorescence intensity measured from above and below the band.
Chemicals and antibodies
Anisomycin, rotenone, antimycin, myxothiazol and sodium cyanide were purchased from Sigma (St. Louis, MO) and used at a final concentration of 1 μg/mL, 1 μM, 2 μg/mL, 1 μM, and 250 μM, respectively. ZVAD-fmk was purchased from MP Biomedicals (Solon, OH). cyt c monoclonal antibodies were obtained from BD Biosciences (San Jose, CA), Caspase-3 and -9 antibodies from Cell Signaling (Beverly MA) and secondary antibodies were from Rock-land (Gilbertsville, PA) and Invitrogen (Carlsbad, CA).
Results
Mitochondrial cytochrome content and oxidation state
Figure 2 shows cyt c and cyt aa3 oxidation changes when the oxygen concentration was reduced to zero for 2 min and after addition of rotenone. A downward deflection denotes reduction. At high oxygen tensions, CytOx was saturated with oxygen and the oxidation state of cyt c and cyt aa3 was independent of oxygen concentration. Under anoxic conditions, cyt c and cyt aa3 cannot be oxidized by oxygen but can be still reduced by Complex III and so become fully reduced. On reoxygenation, cyt c and cyt aa3 reoxidized back to baseline levels. Rotenone inhibits complex I (see Fig. 1), inhibits the TCA cycle and prevents entry of electrons into the ETC. In HL-60 cells, the residual electron flux through the glycerol 3-phosphate shuttle is negligible so mitochondrial oxygen consumption falls to near zero following rotenone treatment (data not shown). After rotenone treatment, cyt c and cyt aa3 cannot be reduced by Complex III but can be still oxidized by oxygen and so become fully oxidized. Oxidation changes in cyt c and cyt aa3 track each other because they are in rapid redox equilibrium and they have similar midpoint potentials.
Fig. 2.

Oxygen concentration (a) and oxidation changes (b) in cyt c and cyt aa3 during anoxia and after administration of rotenone (arrow R) from a representative study. The shaded area denotes the time when cyt c and cyt aa3 are reduced due to hypoxia
Anoxia and rotenone were used as tools to quantify the amount of cyt c and cyt aa3 that can be reduced by complex III and oxidized by oxygen, that is, the functional mitochondrial pool. The total content of each cytochrome was calculated from the difference between the oxidized state (after rotenone) and the fully reduced state (during anoxia). The baseline oxidation state was calculated from the ratio of reduction on anoxia and the total content (Fig. 3). The total concentration of cyt c and cyt aa3 in the cell suspension was 79.1 ± 11.6 and 17.2 ± 1.6 nM, respectively. When corrected for the cell volume fraction, which was measured to be 1.2 ± 0.2%, the intracellular concentration of cyt c and cyt aa3 was 6.59 ± 0.97 and 1.43 ± 0.13 μM, respectively. At baseline, cyt c and cyt aa3 were 62.3 ± 1.1 and 76.6 ± 1.1% oxidized, respectively.
Fig. 3.

Total Content (a) and oxidation state (b) of mitochondrial cyt c and cyt aa3 in control cells (control), in anisomycin cells pretreatment (baseline) and 90 min post treatment (Anisomycin). All values are mean ± SD (n = 6). Control and Anisomycin values were calculated using anoxia and rotenone to fully oxidize and fully reduce the cytochromes. The baseline content was calculated from the reduction during anoxia assuming the baseline oxidation state of control cells. P values were calculated using an unpaired Students t-test
Cytosolic cyt c oxidation state
Anisomycin is a protein synthesis inhibitor that causes a Bax- dependent release of cyt c. Release begins after a latent period of 30 min and is complete in 2 h [15]. Figure 4 shows oxidation changes in cyt c and cyt aa3 following administration of anisomycin to HL-60 cells. Cells were pretreated with the pan caspase inhibitor zVAD-fmk to inhibit the downstream effects of caspase activation and a brief anoxia was performed to quantify the baseline mitochondrial cytochrome content. The baseline concentrations were calculated from the reduction on anoxia assuming the mean oxidation state measured from control cells.
Fig. 4.

Comparison of mitochondrial fraction (a) and cytosolic fraction (b) of cyt c measured by Western analysis with the time course of cyt c and cyt aa3 oxidation changes (c). Cells were treated with anisomycin (arrow A) and rotenone (arrow R) and an anoxia (shaded area) was performed before and 78 min after anisomycin treatment. Samples for western analysis were taken at the time points indicated by the downward arrows. Comparison of cytosolic fraction of cyt c calculated from the reduction post anisomycin to the cytosolic fraction of cyt c quantified from the Western data (d). Data points (symbols) are from three independent experiments and the line is a linear regression through all the data points
Treatment with anisomycin resulted in a small decrease in oxygen consumption (data not shown) and a rapid but small oxidation in cyt c and cyt aa3 which reached 1.4 ± 0.3 and 0.2 ± 0.1nM, respectively at 2 min after treatment. There then continued a further but slower oxidation in both cyt c and cyt aa3 to a maximum oxidation of 4.0 ± 1.2 and 0.7 ± 0.2 nM between 20 and 30 min after anisomycin treatment equivalent to an oxidation of 5.2 ± 1.2 and 4.0 ± 1.3%, respectively. These changes are consistent with cyt c and the cyt aa3 remaining in redox equilibrium.
Following 20–30 min of anisomycin treatment cyt c began to reduce while, at least initially, cyt aa3 remained oxidized. The maximum reduction in cyt c occurred between 60 and 90 min after treatment when cyt c was 28.3 ± 7.1 nM reduced and cyt aa3 was 1.4 ± 0.6 nM reduced from baseline. This reduction occurred under a saturating concentration of oxygen and therefore was not caused by hypoxia.
This large reduction in cyt c together with a small reduction in cyt aa3 is indicative of a reduced pool of cyt c that no longer has physical access to CytOx and is no longer in redox equilibrium with cyt aa3. To verify this, the functional pool of cyt c and cyt aa3 were measured using a combination of anoxia and rotenone after release was complete. If all the cyt c still had access to CytOx then cyt c should have oxidized to approximately +20nM (compare with Fig. 2b) but, even after rotenone, cyt c remained reduced compared to baseline. After release, the mitochondrial pool of cyt c and cyt aa3 was 69.9 ± 3.8 and 86.8 ± 3.2% oxidized, respectively but the pool sizes had decreased by 72 ± 6 and 24 ± 6%, respectively (mean ± SD, n = 6).
Cyt c release correlates with oxygen-independent cyt c reduction
Western analysis was used to quantitate the mitochondrial and cytosolic cyt c content and compared to the oxidation changes (Fig. 4). There was a close temporal correspondence between the release of cyt c into the cytosol (Fig. 4a, b) and the oxygen-independent reduction of cyt c (Fig. 4c). Control studies done in the absence of anisomycin displayed no reduction or release of cyt c (data not shown). These data strongly suggest that the reduction observed in cyt c is a consequence of the release of cyt c from the mitochondria. During periods of anoxia the mitochondrial pool of cyt c should be fully reduced. The reduction during the first and second anoxia was to −48.1 ± 10.1 and −44.4 ± 8.9 nM, respectively (mean ± SD, n = 6) suggesting that 3.8 ± 1.4 nM of cyt c (4.7 ± 1.1% of the original) either remains oxidized or is lost.
These data are consistent with cyt c existing in two pools. The mitochondrial pool remaining 62–70% oxidized and the cytosolic pool becoming highly reduced. When analyzed under the assumption that the reduction represented the cytosolic pool of cyt c, there was a good quantitative agreement between the oxygen-independent reduction and the cytosolic pool of cyt c calculated from the Western data (Fig. 4d). A linear regression showed the two measurements of cytosolic cyt c were highly correlated with the optical measurement underestimating the Western measurement of cytosolic cyt c by less than 5%. Given the difficulty in quantifying Western data, and the small changes in oxidation state of the mitochondrial pool of cyt c, this represents an excellent agreement and is strong evidence to support the interpretation that the cytosolic pool of cyt c became highly reduced whereas the mitochondrial pool was maintained 62–70% oxidized.
Spectra
Figure 5 shows change in attenuation spectra obtained during anoxia in control cells and at saturating oxygen tension 90 min after anisomycin treatment when release of cyt c was complete. The change in attenuation spectrum from control cells under anoxic conditions shows a peak at 550 nm from the α-band of cyt c, a shoulder at ≈562 nm from the α-band of the b-cytochromes from the bc1 complex and a peak at 605 nm from the α-band of cyt aa3. The α-band of cyt c1 at 555 nm is not resolved from the more intense α-band of cyt c. The peak at 520 nm results from the overlapping β-bands of cyt c, cyt c1 and the b-type cytochromes of the bc1 complex. In contrast, the spectrum obtained at saturating oxygen tension after release of cyt c is characteristic of the difference spectrum of cyt c demonstrating conclusively that oxidized cyt c had become reduced.
Fig. 5.

Change in attenuation spectra obtained during anoxia prior to anisomycin treatment and at saturating oxygen tension 90 min after anisomycin treatment when release of cyt c was complete. The anisomycin treated spectrum has been offset by −1mOD for clarity. The labels cyt c, cyt b and cyt aa3 identify the absorption bands originating from cyt c, the b-cytochromes of the bc1 complex and cyt aa3, respectively
Cyt c release is independent of its oxidation state and it becomes reduced in the cytosol
The preceding data show that the cytosolic pool of cyt c is reduced but cannot determine whether only reduced cyt c is released or whether oxidized cyt c can be released but becomes reduced in the cytosol. To distinguish between these possibilities, cyt c release was initiated with anisomycin and followed optically under conditions where the mitochondrial pool of cyt c was either fully oxidized using an upstream inhibitor or fully reduced with anoxia. If only reduced cyt c can be released from the mitochondria then oxidizing the mitochondrial pool should inhibit release. Conversely, if only oxidized cyt c can be released then reducing the mitochondrial pool of cyt c with anoxia should inhibit release.
Figure 6a shows traces of cyt c and cyt aa3 when antimycin was administered to HL-60 cells during cyt c release to oxidize the mitochondrial cyt c pool. Antimycin, a potent inhibitor of the bc1 complex (see Fig. 1), was used in preference to rotenone because oxidation with antimycin is very rapid. After administration of antimycin there is an immediate oxidation of cyt c consistent with the oxidation of the mitochondrial pool. After the oxidation cyt c continued to reduce but the rate of reduction increased from 1.01 ± 0.22 to 1.58 ± 0.35 nM/min (Fig. 6b) which is incompatible with only reduced cyt c being able to leave the mitochondria. When the mitochondrial pool of cyt c is oxidized with antimycin, the rate of reduction is expected to increase by the reciprocal of the pre-antimycin oxidation state if the rate of release of oxidized cyt c is proportional to the mitochondrial concentration of oxidized cyt c and there is no change in OMM permeability. The increase in the rate of reduction is consistent with a pre-antimycin mitochondrial cyt c oxidation state of 63.9 ± 3.2%. This value is between the baseline oxidation state (62.3 ± 1.1%) and the oxidation state after release (69.9 ± 4.4%) providing strong evidence that oxidized cyt c can leave the mitochondria. However, the data does not establish that only oxidized cyt c can leave the mitochondria.
Fig. 6.
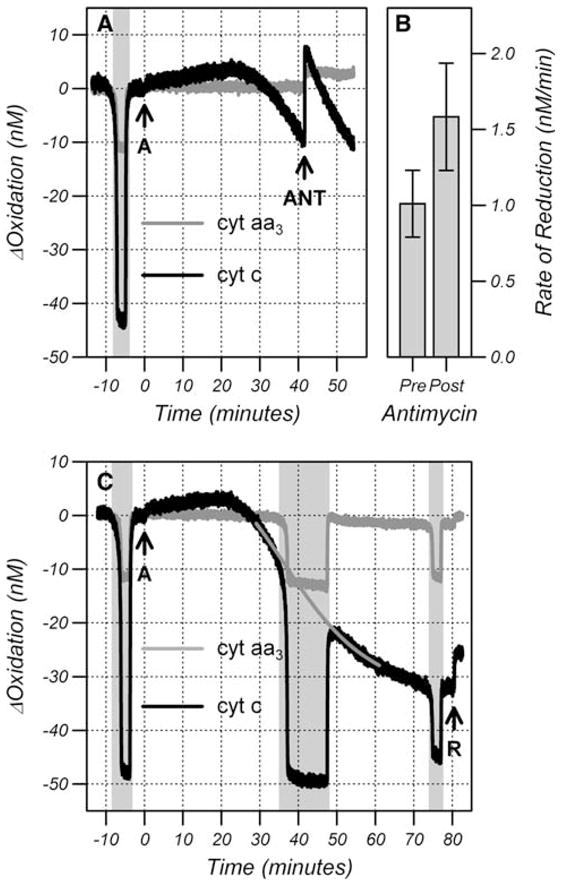
Effect of antimycin on the rate of reduction of cyt c (a) after treatment with anisomycin (arrow ANT). Rate of cyt c reduction pre-and post-antimycin (b) expressed as mean ± SD (n = 6). (c) Effect of anoxia on the reduction of cyt c after anisomycin. The gray line is a quadratic fit to the cyt c trace before and after the anoxia. Cells were treated with anisomycin (arrow A) and rotenone (arrow R). Shaded regions denote reduction in cyt c and cyt aa3 as a result of hypoxia
In order to determine whether reduced cyt c can leave the mitochondria, the mitochondrial pool of cyt c was reduced by making the cells anoxic. If reduced cyt c cannot leave the mitochondria then release should be curtailed during the anoxic period and the oxidation change in cyt c should return to the pre-anoxic level upon reoxygenation. In contrast, if reduced cyt c can leave the mitochondria, and the anoxia does not affect the release of cyt c through other mechanisms, then cyt c should be more reduced after reoxygenation. Figure 6c shows traces of cyt c and cyt aa3 when a 10 min anoxia was performed as cyt c was being released. These data are representative of three independent experiments and show that cyt c release continued during the anoxic period indicating that reduced cyt c can leave the mitochondria.
In summary, cyt c release was independent of the oxidation state of cyt c and the reduction that accompanies cyt c release was most probably the result of reduction of cyt c in the cytosol.
Activation of caspase-9 and -3
Recent data have suggested that only oxidized cyt c can activate caspase 9 and initiate apoptosis [10, 11]. In order to show that the release of cyt c can activate caspase-9 and -3 in this model of MOMP, even though cyt c becomes reduced in the cytosol, the time course of cleavage of caspase-9 and -3 was followed via Western analysis and compared to release of cyt c measured optically. Figure 7 shows typical data from three independent experiments. The maximum oxidation in cyt c occurred approximately 24 min after anisomycin exposure. Up to this point no cleaved caspase-9 or -3 was observed. There was a small reduction of cyt c at 30 min and this corresponded to the appearance of a very weak band of cleaved caspase-9 and caspase-3. As cyt c release proceeded there was a corresponding increase in cleaved caspase-9 and -3 and a decrease in full length caspase-3. These data show that cyt c can activate the apoptosome and caspase-3 even when the majority of cytosolic cyt c is reduced.
Fig. 7.

Comparison of cleaved caspase 9 (cC9) (a), full length Caspase (fC3) and cleaved caspase 3 (cC3) (b) measured by Western analysis with the time course of cyt c and cyt aa3 oxidation changes. Cells were treated with anisomycin (arrow A) and rotenone (arrow R) and an anoxia (shaded area) was performed before and 65 min after anisomycin treatment. Samples for western analysis were taken at the time points indicated by downward arrows
Permeability of the outer membrane
If the outer mitochondrial membrane remains permeable to cyt c after release then there will continue to be an exchange of cyt c between the mitochondrial and cytosolic pools even though the net flux will be zero. Because the cytosolic pool of cyt c is near fully reduced, the flux of cytosolic cyt c into the mitochondria will contribute to the flux of electrons to oxygen. When the transfer of electrons from the bc1 complex to cyt c is blocked the inward flow of cyt c across the outer membrane can be measured from the residual mitochondrial oxygen consumption (see permeability model under Materials and methods).
Cells were either treated with anisomycin and maintained in the oxygenated chamber until cyt c release was complete or untreated and maintained oxygenated in the chamber for 90 min. The mitochondrial concentration of cyt c was measured by performing a 2 min anoxia before treatment and at the completion of the treatment period. The chamber was then sealed and the oxygen consumption measured in respirometry mode. The bc1 complex was inhibited with a mixture of myxothiazol and antimycin. Myxothiazol inhibits the bc1 complex by blocking ubiquinol binding at the ubiquinol oxidizing centre and antimycin blocks ubiquinone binding at the ubiquinone reducing centre (see Fig. 1). The rationale for blocking both centers is that semi-ubiquinone, which can be formed at either center, can donate an electron to oxygen forming superoxide. Superoxide readily reduces cyt c and so could form a bridging reaction between the ubiquinol pool and cyt c. Next CytOx was inhibited with cyanide to inhibit mitochondrial oxygen consumption (see Fig. 1). The remaining oxygen consumption was attributed to non-mitochondrial sources. Representative traces of oxygen consumption and cyt c and cyt aa3 oxidation changes are shown in Fig. 8a–d.
Fig. 8.

Representative traces of oxygen consumption (a and b) and oxidation changes in cyt c and cyt aa3 (c and d) from control cells (a and c) and anisomycin treated cells (b and d) after release of cyt c. The arrows indicate addition of myxothiazol/antimycin (M+A) to inhibit the bc1 complex and cyanide (CN) to inhibit CytOx. Baseline, myxothiazol/antimycin treated (M+A) and cyanide treated (CN) oxygen consumption from control cells and anisomycin treated cells after release of cyt c (e). Data is presented as mean ± SD (n = 6). P values were calculated using an unpaired Students t-test. ns: P > 0.05
Untreated cells displayed no reduction in cyt c indicating there was no appreciable release of cyt c. In these cells blockade of the bc1 complex resulted in a highly significant decrease in oxygen consumption to<3% of baseline value. Blockage of CytOx with cyanide did not decrease oxygen consumption further indicating that the combination of myxothiazol and antimycin was able to completely block electron flow to cyt c.
Anisomycin-treated cells contained 87.2 ± 6.6nM cyt c of which 66.4 ± 6.7% was released. Blockade of the bc1 complex in treated cells significantly decreased oxygen consumption but the residual oxygen consumption was significantly higher than in control cells. Cyanide treatment further decreased oxygen consumption to a level which was not significantly different from cyanide-treated control cells. The residual mitochondrial oxygen consumption after bc1 blockade was 1.57 ± 0.44 μM/min equivalent to a cyt c influx of 105 ± 29 nM/s. This cyt c flux implies that cyt c release would occur in less than 1 s.
The oxidation changes following cyanide treatment provided further evidence that cytosolic cyt c was able to reduce the mitochondria pool of cyt c and cyt aa3. In the control cells, cyt c and cyt aa3 did not become fully reduced after cyanide (Fig. 8) because the bc1 complex was blocked and there was no alternative reductant present. In contrast, the anisomycin-treated cells displayed a more profound reduction in both cytochrome centers after cyanide consistent with the exchange of cyt c across the outer membrane and reduction of cyt c in the cytosol.
Discussion
Most evidence of translocation of cyt c across the outer membrane suggests that it occurs by simple diffusion through openings in the OMM [16]. The results of this study show that the mitochondrial pool of cyt c is ≈62% oxidized in HL-60 cells under conditions of saturating oxygen but that cyt c becomes highly reduced on release into the cytosol. Consistent with a model of simple diffusion, the rate of cyt c release is independent of the oxidation state. Our data show that the mitochondrial fraction of cyt c continues to remain 62–70% oxidized even after the majority of cyt c has been released.
Measurement of the localization of green fluorescent protein (GFP) tagged cyt c demonstrates that 90% of cyt c from a single cell is released within 2 min after a cytotoxic insult [17], suggesting that cyt c release is an all or none event. In this study the exchange of cyt c across the OMM following cyt c release was measured from the inward flux of reduced cyt c after blockade of the bc1 complex. A confounding factor for this measurement of permeability would be the reduction of cyt c within the intermembrane space by an alternative reductant such as cytochrome b5 [18] or superoxide. In control cells, the myxothiazol and antimycin treatment decreased mitochondrial oxygen consumption to extremely low values ruling out the presence of alternative reductants. The OMM was found to be highly permeable to cyt c. Given this level of permeability, cyt c release from each individual mitochondrion would be extremely fast with release occurring within 1 s.
In a model of MOMP in which Bax translocates from the cytosol to the mitochondria to form a pore or tear in the outer membrane, it could be expected that additional pores would form in the outer membrane during and after the release of cyt c continuously increasing the permeability of the outer membrane. In support of this, studies with GFP-labeled Bax have shown a biphasic translocation of Bax to the mitochondria with the second phase occurring after release of cyt c [19]. Here the permeability of the outer membrane was measured 90 min after application of anisomycin when cyt c release was complete; approximately 60 min after the first release of cyt c. It is possible that the high permeability measured at this time point does not reflect the permeability of the outer membrane when the cyt c was initially released and that the actual time of cyt c release is longer. Even so, our recorded release of endogenous cyt c within 1 s is significantly faster than the 2 min reported for the release of transfected GFP- labeled cyt c [17]. The data would support a model in which release from an individual mitochondrion occurs on the time scale of seconds, release from all the mitochondria within a single cell occurs on a time scale of a few minutes and, in anisomycin treated cells, the population of cells releases their cyt c on the time scale of an hour.
The optical techniques used here allowed us to not only follow cyt c release in real-time in intact cells, but also to demonstrate that released cyt c can re-enter the mitochondria and contribute to CytOx reduction and oxygen consumption. Although the exchange of cyt c across the outer membrane is very fast, the inward electron flux is only ≈11% of the electron flux from the bc1 complex to CytOx after MOMP. The contribution of this electron flux towards ATP production would amount to less than 5% of the total ATP production as each electron that enters the ETC at complex I pumps 5 protons compared to 2 protons for electrons entering via extra mitochondrial cyt c [20]. Contrary to previous suggestions [21], these data show conclusively that the released cyt c does not make a substantial contribution to mitochondrial ATP production.
The intracellular concentration of caspase-9 has been estimated to be 20–40 nM [22] which is more than two orders of magnitude less than the intracellular concentration of cyt c measured in this study (≈6.6 μM). Given that the apoptosome binds 7 cyt c, the release of only 2–4% of cyt c would be sufficient to create a concentration of apoptosomes equal to the concentration of caspase-9 suggesting that apoptosis can be initiated by MOMP in very few mitochondria and perhaps by release from a single mitochondrion. It is interesting to note that release of cyt c calculated from the reduction of cyt c underestimates the release measured from the Western data by 5% and that approximately 5% of the cyt c could not be reduced on anoxia after release. This 5% of cyt c could be that bound to the apoptosome and inaccessible to the cytosolic reductant.
This is the first demonstration of endogenous cyt c becoming reduced in the cytosol of living cells after release from the mitochondria subsequent to an apoptotic stimulus. The oxidation status of the cytosolic cyt c is important because recent work has suggested that only oxidized cyt c is able to activated caspase-9 [10, 11] and initiate the apoptotic cascade. Previously it has been suggested that the cytosolic pool of cyt c could be maintained oxidized by CytOx and that this would maximize caspase activation [12]. In contrast, the data presented here show that CytOx does not maintain the cytosolic pool of cyt c highly oxidized even though the mitochondrial membrane is highly permeable to cyt c. We have occasionally observed a small reoxidation of cyt c at much longer time points following cyt c release (data not shown). This reoxidation could be the result of CytOx exhausting the capacity of the cytosolic reductant or this could be due to proteolytic degradation of cytosolic cyt c. However, this reoxidation only occurs several hours after the beginning of cyt c release when the caspases would be already activated and downstream changes associated with apoptosis would be well underway.
The optical data does not provide direct evidence that the cytocolic pool of cyt c is fully reduced but only that it is more reduced than the IMS pool. However, the 1:1 correspondence between released cyt c measured by a Western analysis and the release of cyt c measured optically assuming full reduction is strong evidence that cyt c becomes highly reduced in the cytosol. The high permeability of the OMM to cyt c implies that the mechanism of cyt c reduction in the cytosol must be very rapid in order to maintain the cytosolic pool reduced in the face of a considerable efflux of oxidized cyt c. If the mechanism of reduction were very slow then the exchange of cyt c across the OMM would maintain the cytosolic pool at the same oxidation state as the mitochondrial pool. If the mechanism of reduction occurred at a similar rate to release then there would be competition between the two processes and cytosolic cyt c would not become fully reduced under normal turnover conditions when the mitochondrial cyt c is ≈70% oxidized. The cytosolic reductant is not known but cyt c can be reduced by ascorbate, superoxide, glutathione [23], nitric oxide synthase [24], neuroglobin [25], cytochrome P450 reductase (CP450R) [26] and the cytoplasmic protein novel reductase 1 (NR1) [27]. However, the reaction with ascorbate [28], superoxide and glutathione is too slow [29] to account for the rapid rate of reduction observed here.
Cyt c has a high midpoint potential and it is not surprising that it becomes reduced when released into the reducing environment of the cytosol. However, the very high rate of reduction is surprising and would suggest that the reduction occurs as part of a normal physiological process. It may occur as a mechanism to protect the cytosol from the oxidizing properties of cyt c. Cyt c can oxidize glutathione and the constant exchange of oxidized cyt c across the permeabilized OMM would lead to an oxidization of the cytosolic pool of glutathione and to considerable oxidative stress to the cytosol. An oxidation in the glutathione pool has been observed during apoptosis [30] and the rapid reduction of cyt c by an alternative reductant may minimize this stress.
Alternatively, if only oxidized cyt c can activate caspase-9 its rapid reduction could act as a protective measure to prevent the accidental release of cyt c, for instance during mitochondrial fission and fusion, from triggering apoptosis. In this case, the rapid reduction of cyt c would indicate that there is only a brief window of time in which caspase-9 could be activated and the apoptotic cascade initiated. This would imply that the rate of release of oxidized cyt c must be very high compared to the rate of reduction in order to build up a pool of oxidized cyt c in the cytosol that could trigger assembly of the apoptosome and activate caspase-9.
The oxidation state of released cyt c and its importance in caspase-9 activation has implications for the treatment of tumors with pro-apoptotic drugs. Many solid tumors are hypoxic or have a hypoxic core and the levels of hypoxia are sufficient to substantially reduce mitochondrial cyt c. Under these conditions, the release of oxidized cyt c per mitochondrion undergoing MOMP would be lower and may not be sufficient to activate caspase-9 and trigger the apoptotic cascade. This factor could contribute to the chemo- and radio-resistance of hypoxic tumors.
Acknowledgments
The project described was supported by Award Numbers R01NS054298 from the National Institute of Neurological Disorders and Stroke (NINDS) and R21RR025803 from the National Center for Research Resources (NCRR). The content is solely the responsibility of the authors and does not necessarily represent the official views of NINDS, NCRR or the National Institutes of Health.
References
- 1.Green DR, Kroemer G. The pathophysiology of mitochondrial cell death. Science. 2004;305:626–629. doi: 10.1126/science.1099320. [DOI] [PubMed] [Google Scholar]
- 2.Nieminen AI, Partanen JI, Klefstrom J. c-Myc blazing a trail of death: coupling of the mitochondrial and death receptor apoptosis pathways by c-Myc. Cell Cycle. 2007;6:2464–2472. doi: 10.4161/cc.6.20.4917. [DOI] [PubMed] [Google Scholar]
- 3.Riedl SJ, Salvesen GS. The apoptosome: signalling platform of cell death. Nat Rev Mol Cell Biol. 2007;8:405–413. doi: 10.1038/nrm2153. [DOI] [PubMed] [Google Scholar]
- 4.West IC, Mitchell P, Rich PR. Electron conduction between b cytochromes of the mitochondrial respiratory chain in the presence of antimycin plus myxothiazol. Biochim Biophys Acta. 1988;933:35–41. doi: 10.1016/0005-2728(88)90053-9. [DOI] [PubMed] [Google Scholar]
- 5.Rich PR, West IC, Mitchell P. The location of CuA in mammalian cytochrome c oxidase. FEBS Lett. 1988;233:25–30. doi: 10.1016/0014-5793(88)81349-8. [DOI] [PubMed] [Google Scholar]
- 6.Chance B, Williams GR. The respiratory chain and oxidative phosphorylation. Adv Enzymol Relat Areas Mol Biol. 1956;17:65–134. doi: 10.1002/9780470122624.ch2. [DOI] [PubMed] [Google Scholar]
- 7.Wilson DF, Rumsey WL, Green TJ, Vanderkooi JM. The oxygen dependence of mitochondrial oxidative phosphorylation measured by a new optical method for measuring oxygen concentration. J Biol Chem. 1988;263:2712–2718. [PubMed] [Google Scholar]
- 8.Hollis VS, Palacios-Callender M, Springett RJ, Delpy DT, Moncada S. Monitoring cytochrome redox changes in the mitochondria of intact cells using multi-wavelength visible light spectroscopy. Biochim Biophys Acta. 2003;1607:191–202. doi: 10.1016/j.bbabio.2003.09.012. [DOI] [PubMed] [Google Scholar]
- 9.Hampton MB, Zhivotovsky B, Slater AF, Burgess DH, Orrenius S. Importance of the redox state of cytochrome c during caspase activation in cytosolic extracts. Biochem J. 1998;329(1):95–99. doi: 10.1042/bj3290095. [DOI] [PMC free article] [PubMed] [Google Scholar]
- 10.Pan Z, Voehringer DW, Meyn RE. Analysis of redox regulation of cytochrome c-induced apoptosis in a cell-free system. Cell Death Differ. 1999;6:683–688. doi: 10.1038/sj.cdd.4400544. [DOI] [PubMed] [Google Scholar]
- 11.Suto D, Sato K, Ohba Y, Yoshimura T, Fujii J. Suppression of the pro-apoptotic function of cytochrome c by singlet oxygen via a haem redox state-independent mechanism. Biochem J. 2005;392:399–406. doi: 10.1042/BJ20050580. [DOI] [PMC free article] [PubMed] [Google Scholar]
- 12.Borutaite V, Brown GC. Mitochondrial regulation of caspase activation by cytochrome oxidase and tetra-methylphenylenediamine via cytosolic cytochrome c redox state. J Biol Chem. 2007;282:31124–31130. doi: 10.1074/jbc.M700322200. [DOI] [PubMed] [Google Scholar]
- 13.Matcher SJ, Cope M, Delpy DT. Use of the water absorption spectrum to quantify tissue chromophore concentration changes in near-infrared spectroscopy. Phys Med Biol. 1994;39:177–196. doi: 10.1088/0031-9155/39/1/011. [DOI] [PubMed] [Google Scholar]
- 14.Single B, Leist M, Nicotera P. Simultaneous release of adenylate kinase and cytochrome c in cell death. Cell Death Differ. 1998;5:1001–1003. doi: 10.1038/sj.cdd.4400462. [DOI] [PubMed] [Google Scholar]
- 15.Ganju N, Eastman A. Bcl-X(L) and calyculin A prevent translocation of Bax to mitochondria during apoptosis. Biochem Biophys Res Commun. 2002;291:1258–1264. doi: 10.1006/bbrc.2002.6584. [DOI] [PubMed] [Google Scholar]
- 16.Ow YL, Green DR, Hao Z, Mak TW. Cytochrome c: functions beyond respiration. Nat Rev Mol Cell Biol. 2008;9:532–542. doi: 10.1038/nrm2434. [DOI] [PubMed] [Google Scholar]
- 17.Goldstein JC, Waterhouse NJ, Juin P, Evan GI, Green DR. The coordinate release of cytochrome c during apoptosis is rapid, complete and kinetically invariant. Nat Cell Biol. 2000;2:156–162. doi: 10.1038/35004029. [DOI] [PubMed] [Google Scholar]
- 18.Bernardi P, Azzone GF. Cytochrome c as an electron shuttle between the outer and inner mitochondrial membranes. J Biol Chem. 1981;256:7187–7192. [PubMed] [Google Scholar]
- 19.Capano M, Crompton M. Biphasic translocation of Bax to mitochondria. Biochem J. 2002;367:169–178. doi: 10.1042/BJ20020805. [DOI] [PMC free article] [PubMed] [Google Scholar]
- 20.Hinkle PC, Kumar MA, Resetar A, Harris DL. Mechanistic stoichiometry of mitochondrial oxidative phosphorylation. Biochemistry. 1991;30:3576–3582. doi: 10.1021/bi00228a031. [DOI] [PubMed] [Google Scholar]
- 21.Atlante A, de Bari L, Bobba A, Marra E, Calissano P, Passarella S. Cytochrome c, released from cerebellar granule cells undergoing apoptosis or excytotoxic death, can generate proton-motive force and drive ATP synthesis in isolated mitochondria. J Neurochem. 2003;86:591–604. doi: 10.1046/j.1471-4159.2003.01863.x. [DOI] [PubMed] [Google Scholar]
- 22.Stennicke HR, Deveraux QL, Humke EW, Reed JC, Dixit VM, Salvesen GS. Caspase-9 can be activated without proteolytic processing. J Biol Chem. 1999;274:8359–8362. doi: 10.1074/jbc.274.13.8359. [DOI] [PubMed] [Google Scholar]
- 23.Hancock JT, Desikan R, Neill SJ. Does the redox status of cytochrome C act as a fail-safe mechanism in the regulation of programmed cell death? Free Radic Biol Med. 2001;31:697–703. doi: 10.1016/s0891-5849(01)00646-3. [DOI] [PubMed] [Google Scholar]
- 24.Klatt P, Heinzel B, John M, Kastner M, Bohme E, Mayer B. Ca2+/calmodulin-dependent cytochrome c reductase activity of brain nitric oxide synthase. J Biol Chem. 1992;267:11374–11378. [PubMed] [Google Scholar]
- 25.Fago A, Mathews AJ, Moens L, Dewilde S, Brittain T. The reaction of neuroglobin with potential redox protein partners cytochrome b5 and cytochrome c. FEBS Lett. 2006;580:4884–4888. doi: 10.1016/j.febslet.2006.08.003. [DOI] [PubMed] [Google Scholar]
- 26.Murataliev MB, Feyereisen R, Walker FA. Electron transfer by diflavin reductases. Biochim Biophys Acta. 2004;1698:1–26. doi: 10.1016/j.bbapap.2003.10.003. [DOI] [PubMed] [Google Scholar]
- 27.Finn RD, Basran J, Roitel O, Wolf CR, Munro AW, Paine MJ, Scrutton NS. Determination of the redox potentials and electron transfer properties of the FAD- and FMN-binding domains of the human oxidoreductase NR1. Eur J Biochem. 2003;270:1164–1175. doi: 10.1046/j.1432-1033.2003.03474.x. [DOI] [PubMed] [Google Scholar]
- 28.Al-Ayash AI, Wilson MT. The mechanism of reduction of single-site redox proteins by ascorbic acid. Biochem J. 1979;177:641–648. doi: 10.1042/bj1770641. [DOI] [PMC free article] [PubMed] [Google Scholar]
- 29.Everse J, Kujundzic N. Kinetics and mechanism of the reduction of horse heart ferricytochrome c by glutathione. Biochemistry. 1979;18:2668–2673. doi: 10.1021/bi00579a037. [DOI] [PubMed] [Google Scholar]
- 30.Jiang S, Cai J, Wallace DC, Jones DP. Cytochrome c-mediated apoptosis in cells lacking mitochondrial DNA. Signaling pathway involving release and caspase 3 activation is conserved. J Biol Chem. 1999;274:29905–29911. doi: 10.1074/jbc.274.42.29905. [DOI] [PubMed] [Google Scholar]