

Abstract
Background
Hepatitis C virus (HCV) causes significant morbidity and mortality in injecting drug users (IDU) worldwide. HCV vaccine candidates have shown promise for reducing the infectivity of acute infection and averting chronic infection, yet the impact of varying levels of vaccine efficacy and vaccine delivery strategies on the HCV epidemic in IDU have not been explored.
Methods
We utilized extensive data on injecting behavior collected in the UFO Study of young IDU in San Francisco to construct a stochastic individual-based model that reflects heterogeneous injecting risk behavior, historical HCV trends, and existing information on viral dynamics and vaccine characteristics.
Results
Our modeled HCV rate closely paralleled observed HCV incidence in San Francisco, with estimated incidence of 59% per person year (ppy) early in the epidemic, and 27% ppy after risk reduction was introduced. Chronic HCV infection, the clinically relevant state of HCV infection that leads to liver disease and hepatocellular cancer, was estimated at 22% ppy (±3%) early in the epidemic and 14% ppy (±2%) after risk reduction was introduced. We considered several scenarios, and highlight that a vaccine with 50% to 80% efficacy targeted to high-risk or sero-negative IDU at a high vaccination rate could further reduce chronic HCV incidence in IDU to 2–7% ppy 30 years after its introduction.
Conclusions
Our results underscore the importance of further efforts to develop both HCV vaccines and optimal systems of delivery to IDU populations.
Keywords: Hepatitis C virus, injecting drug users, dynamic modeling, hepatitis C virus vaccine
INTRODUCTION
Hepatitis C virus (HCV) infects an estimated 130–170 million people worldwide, and chronic HCV infection is the leading cause of liver-related morbidity and mortality in the United States (Perz, Armstrong et al. 2006). HCV is primarily spread through sharing of contaminated needles and syringes used to inject drugs, as well as sharing of ancillary equipment used in drug preparation (reviewed in (De, Roy et al. 2008)). Approximately 65–90% of injection drug users (IDU) in the US, western Europe, and Australia were HCV antibody positive in the 1980s and early 1990s (reviewed in (Hagan, Des Jarlais et al. 2007)). There is evidence that the prevalence of HCV in IDU has declined in several cities in recent years (Des Jarlais, Perlis et al. 2005; van de Laar, Langendam et al. 2005; Burt, Hagan et al. 2007; Tseng, O’Brien T et al. 2007; Amon, Garfein et al. 2008). This trend is generally attributed to the declines in injecting risk behavior that occurred after the initiation of HIV prevention education programs, and the provision of new needles/syringes and other injecting equipment that began in the late 1980s.
However, the incidence of new HCV infection remains unacceptably high, at 25% to 40% per person year (ppy) in IDU in San Francisco (Hahn, Page-Shafer et al. 2002; Page-Shafer, Pappalardo et al. 2007), and 9% to 38% ppy in IDU elsewhere (Hagan and Des Jarlais 2000). New interventions are urgently needed. A recent behavioral intervention trial to reduce injecting-related HCV acquisition (Garfein, Golub et al. 2007) and transmission (Kapadia, Latka et al. 2007) had little success in reducing the HCV incidence from 18% ppy in young IDU (Garfein, Golub et al. 2007). HCV vaccines are currently in development, based on the findings in both human and chimpanzee studies that early cell-mediated immune responses (multi-specific CD4+ TH-1 and CD8+ T-cell activation) and possibly humoral responses are associated with clearance of acute HCV infection (Houghton and Abrignani 2005). While all vaccine candidates to date have failed to induce sterilizing immunity (Lauer and Chung 2007), they have been very successful in preventing chronic infection in chimpanzees (Houghton and Abrignani 2005) and in a human liver/chimeric mouse model (Law, Maruyama et al. 2008), and in one study led to reduced levels of viremia in chimpanzees (Folgori, Capone et al. 2006).
Simulation models of infectious disease dynamics are powerful tools for understanding disease transmission and for evaluating the potential population-level benefits of various public-health interventions. While randomized clinical trials can establish the efficacy of a vaccine, they cannot predict the effect of introducing a vaccine into a population, due to the added indirect benefit of preventing transmission by those who became immune. Dynamic models have provided insights into the level of injecting behavior change needed to have an impact on the HCV epidemic in IDU (Mather and Crofts 1999; Pollack 2001; Murray, Law et al. 2003; Esposito and Rossi 2004; Hutchinson, Bird et al. 2006; Vickerman, Hickman et al. 2007). However, of the two studies that explored the potential effect of an HCV vaccine (Mather and Crofts 1999; Krahn, John-Baptiste et al. 2005), neither examined a vaccine that decreases infectivity (rather than protects against infection in the first place) nor incorporated the risk of transmission due to sharing ancillary injecting equipment.
We constructed a mathematical model incorporating these factors to gain insight into the likely short- and long-term effects of the introduction of a vaccine under several scenarios of vaccine efficacy, vaccination rate, and targeting strategies. We based our model and parameter estimates on extensive data collected in the UFO Study of young IDU (under age 30) in San Francisco from 2000 to 2001 (data collection methods described in (Hahn, Page-Shafer et al. 2001; Hahn, Page-Shafer et al. 2002)) and analyzed specifically for this purpose, together with published data on HCV in older IDU in San Francisco (Page-Shafer, Pappalardo et al. 2007; Tseng, O’Brien T et al. 2007).
METHODS
Overview
We developed a three-phase model of the HCV epidemic in San Francisco, using a stochastic individual-based model with structure depicted schematically in Figure 1 and with parameters defined in Table 1. For Phase 1 we assumed that all active IDU engaged in receptive needle sharing (RNS), consistent with historic data of high rates of RNS (Tseng, O’Brien T et al. 2007). We constructed Phase 2 to reflect reductions in risk behavior starting in the late 1980s, by altering the model so that new IDU entered the population into one of three risk groups (low, medium, or high-risk, defined below). We estimated the HCV sero-prevalence and incidence of acute infection in Phases 1 and 2 and present these results for comparison with the historical data. We modeled Phase 3 to represent the introduction of an HCV vaccine 40 years after the beginning of Phase 2. We examined several vaccine efficacies, introduction rates, and introduction strategies. We tracked the estimated incidence of chronic HCV infections following vaccine introduction, focusing on chronic HCV because it can lead to more significant morbidity and potential mortality compared to acute HCV. Incidence was calculated on a yearly basis. The numerator for incidence of acute HCV infection was the number of new first-time infections in each year, and the denominator was the number of individuals in the population at any point in that year (including migration and emigration) who were HCV uninfected (HCV RNA negative) at the beginning of the year. The numerator for the incidence of chronic infection was the number of new infections occurring in that year that progressed to chronic infection. The denominator was the same as for acute infection.
Figure 1.
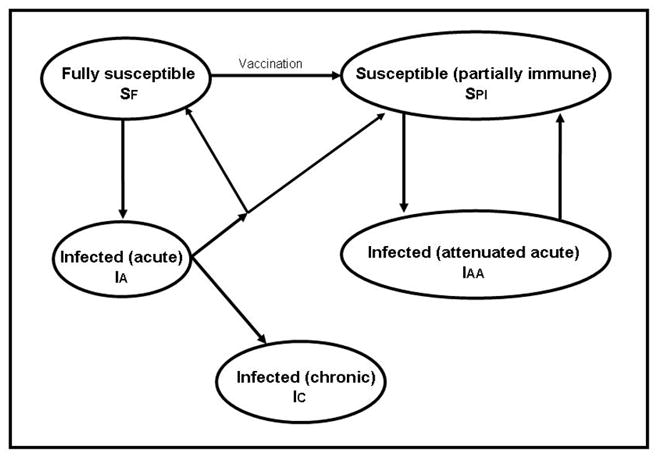
HCV transmission diagram.
Table 1.
Simulation parameter definitions and values
| Parameter | Interpretation | Value | Source |
|---|---|---|---|
| pRNS,HR pRNS,MR pRNS,lR | Probability of RNS per day; high, medium, low risk IDU | 0.3, 0, 0 | Data collected in studies of young IDU; see Table A1 |
| pAES,HR pAES,MR pAES,LR | Probability of AES per day; high, medium, low risk IDU | 0.5, 0.5, 0.2 | Data collected in studies of young IDU; see Table A1 for high and medium risk. Probability for low risk estimated from model |
| μ | Probability per day of leaving the IDU cohort (due to ceasing to inject, emigration, death) | 0.00029 | 10% probability of leaving injecting per year [49]. We assumed no excess mortality due to HCV during injecting career. |
| T | Probability per day of joining the IDU cohort (due to initiating injection) | 0.00029 | Set equal to the rate of leaving the cohort and completely dependent on random leaving such that each IDU leaving is replaced immediately by one new IDU entering state SF. |
| C | Probability of spontaneous clearance of acute HCV infection (one-time event, 180 days after infection) | 0.25 | Micallef (2006) |
| cPI | Probability of entering partially protected susceptible state after spontaneous clearance of initial acute infection | 0.50 | Approximation of assumptions used by Hutchinson (2006) |
| cAAs | Probability of entering partially protected susceptible state after 180 days of attenuated acute infection | 1.0 | See text |
| βC,j | HCV transmission probability where source IDU is chronically infected (IC); j ={RNS, AES} |
0.0073,0.0023 | Estimated by fitting observed behavioral data to observed HCV incidence (see Appendix) |
| βA,j | HCV transmission probability where source IDU is acutely infected (IA); j ={RNS, AES} |
10βC,j | |
| βAA,j | HCV transmission probability where source IDU is in infected attenuated acute state, (IAA); j ={RNS, AES} |
βC,j | |
| β.,j | HCV transmission probability averaged over the three states of infection (IC, IA, IAA); j ={RNS, AES} |
0.0098, 0.0031 |
We conducted simulations with an IDU population size of 1000 to obtain a population large enough to avoid overly large stochastic fluctuations, but small enough to be computationally feasible. We ran 100 realizations of each parameter set, using a one-day time step because a substantial proportion of IDU inject on a daily basis. In each time step, IDU were randomly selected, based on their risk group membership, to engage in RNS and/or ancillary equipment sharing (AES). Modeled HCV infections then occurred with the probability based on each person’s susceptibility to infection (described below), the transmission probability associated with the HCV state of their injecting partner, and the infectivity associated with the risk activity (RNS versus AES). We examined the robustness of our conclusions to alternative values of key parameters. All simulations were conducted using MATLAB©. The procedures for the UFO study, from which many of the parameter estimates arose, were approved by the Institutional Review Board of the University of California, San Francisco.
HCV transmission probability by phase of HCV infection
The early phases of acute HCV infection are associated with very high viral replication in the absence of detectable antibody (Busch 2001; Glynn, Wright et al. 2005; Page-Shafer, Pappalardo et al. 2007). As with other bloodborne infections, it has been hypothesized that infectivity of an HCV carrier is highest during the early seronegative viremic period (Alter 1994; Operskalski, Mosley et al. 2003; Logvinoff, Major et al. 2004). While empirical support for this hypothesis is lacking, two recent modeling studies incorporated increased infectivity in the acute phase (Hutchinson, Bird et al. 2006; Vickerman, Hickman et al. 2007). Accordingly, we assumed that the transmission probability β associated with the acute phase of HCV (denoted by IA in Fig. 1), was ten times that of the chronic phase (denoted by IC).
Spontaneous HCV clearance and re-infection
Based on the median value of previous studies of spontaneous clearance of HCV infection (Micallef, Kaldor et al. 2006), and following earlier work (Hutchinson, Bird et al. 2006), we assumed a 25% probability for clearing infection after 180 days in the acute phase, with the remaining individuals progressing to the chronic phase.
Current data on re-infection after spontaneous clearance are conflicting, with reports of no protection against re-infection in untreated (Micallef, Macdonald et al. 2007) and treated (Dalgard, Bjoro et al. 2002; Backmund, Meyer et al. 2004; Dalgard 2005) individuals as well as reports of reduced rates of re-infection or progression to chronic infection that suggest partial immunity to re-infection after spontaneous HCV clearance (Mehta, Cox et al. 2002; Grebely, Conway et al. 2006; Currie, Ryan et al. 2008). We modeled partial immunity such that those who clear initial HCV infection have a 50% probability of becoming partially immune to subsequent HCV infection, with the remainder returning to the fully susceptible state (denoted by SF in Fig. 1). We assumed that those who are partially immune experience attenuated viremia in acute infection (denoted by IAA), with complete lack of progression to chronic infection upon re-exposure to HCV, and return to the susceptible state with partial immunity (denoted by SPI) after clearance of viremia. We assumed that those in state IAA were 10% as infectious as those in state IA (i.e. those acutely infected with HCV from the fully susceptible state). In our model, once an IDU gains partial immunity this protection is permanent and they can only experience attenuated infection upon re-exposure to HCV. This depiction of partial immunity is consistent with assumptions of one recent HCV modeling study (Hutchinson, Bird et al. 2006) and the observed 10-fold decrease in level of viremia in vaccinated chimpanzees (Folgori, Capone et al. 2006), but differs from another modeling study that assumed complete immunity from re-infection after spontaneous clearance (Vickerman, Hickman et al. 2007).
Vaccine-induced immune protection
We modeled a prophylactic HCV vaccine to provide partial immunity (denoted by state SPI in Fig. 1) to individuals in the fully susceptible state (denoted by SF), based on recent vaccine studies (Houghton and Abrignani 2005; Folgori, Capone et al. 2006) that reduced the risk of chronic infection in chimpanzees. We assumed that immunity due to vaccination will be epidemiologically equivalent to partial immunity achieved by spontaneous clearance, which is consistent with the vaccine trials that showed attenuated levels of viremia and high rates of clearance after HCV challenges given to vaccinated chimpanzees (Houghton and Abrignani 2005; Folgori, Capone et al. 2006; Lauer and Chung 2007).
Vaccine efficacy and effectiveness
Prior studies of hepatitis B virus (HBV) multi-dose vaccine adherence in IDU have shown low rates of completion (Lum, Ochoa et al. 2003; McGregor, Marks et al. 2003; Altice, Bruce et al. 2005). We modeled HCV vaccine completion based on our experience in San Francisco, in which 25%, 50% and 25% of young IDU stopped at one, two, and three vaccine doses, respectively (Lum, Ochoa et al. 2003). We assumed that vaccination confers immunity to all HCV exposures to 31%, 78% and 99% of subjects 30 days after the first, second, and third doses respectively, as stated in the package insert for HBV vaccine. With 25%, 50%, and 25% of those vaccinated completing 1, 2, and 3 vaccine doses respectively, the average modeled effectiveness was 71.5% of the 50%, 65%, and 80% efficacy used in the model.
IDU risk behavior groups
We defined “low-risk” IDU as those who never engage in receptive needle sharing (RNS) and rarely or never engage in AES, “medium-risk” IDU as those who engage in AES but never engage in RNS, and “high-risk” IDU as those who engage in RNS whether or not they engage in AES. We assumed that at the beginning of the epidemic (Phase 1) all IDU were high-risk, and that following the introduction of risk reduction measures (Phase 2), 40%, 20% and 40% of new IDU entered in the high-, medium-, and low-risk categories respectively. These proportions were based on three-month frequencies of risk behavior reported in the UFO study baseline screening sample (see Appendix).
RNS and AES frequency
We utilized self reported behavioral data from baseline interviews from 2000–2001 from the UFO study to determine the frequency of engaging in RNS and AES (Table A1). Using data from recent risk behavior, we estimated that the rate of RNS was approximately 0.3 per day in the high-risk group, and was zero by definition in the medium and low-risk groups. We estimated that the rate of AES was approximately 0.5 per day for the high-and medium-risk groups and approximately 0.2 for the low-risk group.
Selection of injecting partners
Injecting partners with whom to engage in RNS were selected at random from the pool of all active IDU for each RNS event. AES partners were chosen with probability proportional to the relative frequency of AES in each risk group. All sharing events were selected independently from each other, therefore it was possible that an individual would engage in both RNS and AES with different partners in the same time step.
HCV transmission probability for RNS and AES
Previous dynamic models of HCV in IDU have employed a range of HCV transmission probabilities for RNS ranging from 1–3% per event, based on infection rates of health care workers who suffered accidental needle-sticks (Mather and Crofts 1999; Murray, Law et al. 2003; Hutchinson, Bird et al. 2006; Vickerman, Hickman et al. 2007). However, the probability of transmission of HCV in the RNS setting may differ from health care exposures due to the use of different gauge needles and rinsing needles/syringes with water or bleach between uses. In addition, no estimates of the probability of transmission of HCV from AES exist. For these reasons, rather than using transmission probabilities derived from needle-stick injuries in health care settings, we estimated transmission probabilities for RNS and AES utilizing risk behaviors and HCV incidence rates observed in the UFO study (described in Appendix 1), and report the estimates in Table 1.
Vaccine introduction scenarios
We simulated intervention scenarios to investigate the potential impact of different vaccine efficacies, vaccination rates and targeting strategies. Targeting strategies were: no targeting, in which IDU were selected for vaccination at random from all IDU who had not yet received HCV vaccine, regardless of their infection status; risk targeting, in which high-risk IDU who had not yet received vaccine were prioritized for vaccination over medium-risk and then low-risk IDU; and sero-targeting, in which HCV antibody negatives were prioritized to receive vaccine. We considered vaccine efficacies of 50%, 65% and 80%, and 0.2%, 0.6%, and 1% of the IDU population vaccinated per month.
Robustness of findings to assumptions
We conducted analyses to examine the robustness of our main findings to alternative assumptions about several key parameters, including the relative infectivity of acute versus chronic infection, transmission probabilities for RNS and AES, vaccine completion rates, behavior change at the end of phase I, and immunity to re-infection after spontaneous clearance of HCV (Table 2). We felt that our assumptions about the proportion of IDU at high risk in Phase I and the timing of vaccine introduction after reaching equilibrium in phase 2 would not substantially affect our conclusions about potential HCV vaccine strategies. We determined the effect of alternative assumptions on (1) HCV sero-prevalence and incidence of new infections in the pre-vaccine era (Phase 1 and Phase 2), (2) incidence of chronic HCV infections in an optimistic Phase 3 scenario in which there is high vaccine efficacy (80%) and high vaccination rate (1% of IDU per month), and (3) incidence of chronic HCV infections in a less optimistic Phase 3 scenario where there is low efficacy (50%) but strong public health efforts leading to a high vaccination rate (1% of IDU per month).
Table 2.
Analysis of robustness of the estimates of the incidence of chronic HCV after the introduction of a vaccination program to several alternate parameter values. We examined three targeting strategies, A. no targeting, B. risk targeting, and C. sero-targeting and a high vaccination rate (1% of the population per month).
| Incidence of chronic HCV (ppy) (SD) | ||||||||
|---|---|---|---|---|---|---|---|---|
| No vaccine | 50% efficacy | 80% efficacy | ||||||
| Domain | Assumption/parameter | Parameter estimates or assumptions | Prior to vaccine program initiation | 10 years after vaccine program introduction | 30 years after vaccine program introduction | 10 years after vaccine program introduction | 30 years after vaccine program introduction | |
| Base case | See Table 1. | 13.6 (1.8) | A. B. C. |
10.7 (1.9) 8.0 (1.5) 6.2 (1.2) |
5.3 (1.1) 5.3 (1.1) 5.1 (1.1) |
9.1 (1.5) 4.8 (0.85) 3.2 (0.87) |
2.6 (0.65) 2.4 (0.59) 2.3 (0.65) |
|
| Acute versus chronic infectivity | βA,RNS: βC,RNS Ratio of acute versus chronic infectivity (base case is 0.073:0.0073 [10:1]) | 0.0098:0.0098 (1:1) | 12.6 (1.4) | A. B. C. |
9.8 (1.2) 7.5 (1.1) 6.0 (1.0) |
5.2 (0.90) 4.8 (0.70) 4..8 (0.81) |
8.5 (1.2) 5.3 (0.95) 3.3 (0.66) |
2.5 (0.55) 2.3 (0.52) 2.3 (0.53) |
| AES infectivity (per-event) | βC,AES (base case is 0.0023) | 0.0006 | 6.3 (1.1) | A. B. C. |
4.6 (0.93) 3.3 (0.86) 3.2 (0.82) |
2.7 (0.75) 2.5 (0.76) 2.5 (0.73) |
3.9 (0.94) 2.0 (0.59) 1.7 (0.52) |
1.2 (0.45) 1.1 (0.39) 1.0 (0.41) |
| 0 | 2.9 (0.78) | A. B. C. |
2.1 (0.61) 1.4 (0.46) 1.8 (0.51) |
1.3 (0.45) 1.2 (0.42) 1.2 (0.42) |
1.7 (0.58) 0.75 (0.33) 1.2 (0.41) |
0.62 (0.29) 0.47 (0.25) 0.50 (0.27) |
||
| RNS infectivity (per-event) | βC,RNS (base case is 0.0073) | 0.02 | 14.7 (2.0) | A. B. C. |
11.8 (1.6) 9.0 (1.4) 6.8 (1.2) |
6.0 (1.1) 5.8 (1.0) 5.8 (1.0) |
10.3 (1.6) 6.0 (1.2) 3.8 (0.76) |
3.2 (0.74) 2.9 (0.58) 2.9 (0.71) |
| Vaccine series completion of those initiating | (Base case: 25%, 50%, and 25% receive 1, 2, and 3 doses respectively) | 100% receive 3 vaccinations | 14.0 (2.1)* | A. B. C. |
9.9 (1.7) 6.4 (1.2) 4.6 (1.0) |
3.9 (0.91) 3.6 (0.81) 3.6 (0.84) |
8.0 (1.4) 3.4 (0.78) 1.5 (0.50) |
0.96 (0.37) 0.92 (0.37) 0.86 (0.42) |
| Behavior change at the start of Phase 2 | % enter population in low-, medium-, and high-risk groups (base case is 40, 20, 40) | 0, 0, 100 | 21.9 (2.5) | A. B. C. |
19.3 (2.4) 19.8 (2.4) 9.6 (1.6) |
8.6 (1.6) 9.0 (1.5) 7.9 (1.3) |
17.2 (2.2) 17.9 (2.1) 5.2 (1.2) |
4.7 (0.88) 4.2 (0.82) 3.9 (0.88) |
| 60, 20, 20 | 11.4 (1.8) | A. B. C. |
8.0 (1.4) 6.2 (1.3) 4.8 (0.99) |
4.0 (0.82) 4.0 (0.86) 3.8 (0.79) |
6.3 (1.1) 3.8 (0.89) 2.4 (0.59) |
1.9 (0.55) 1.7 (0.47) 1.6 (0.54) |
||
| HCV re-infection | cPI Probability of entering partially protected susceptible state after spontaneous clearance of initial acute infection (base case cPI=0.50) | 0.0 (Everyone who clears becomes fully susceptible to re-infection) | 19.5 (2.5) | A. B. C. |
15.0 (2.2) 10.6 (1.7) 7.7 (1.2) |
6.5 (1.3) 6.4 (1.2) 6.1 (1.1) |
12.1 (1.8) 6.6 (1.3) 4.2 (0.96) |
3.1 (0.60) 2.8 (0.67) 2.8 (0.70) |
| 1.0 (Everyone who clears becomes partially immune to re-infection) | 10.6 (1.7) | A. B. C. |
8.6 (1.3) 6.1 (1.1) 4.8 (0.93) |
4.2 (0.96) 4.0 (0.91) 4.3 (0.77) |
7.0 (1.3) 4.0 (0.91) 2.8 (0.73) |
2.1 (0.65) 2.0 (0.61) 2.0 (0.60) |
||
Differs from base case due only to stochastic fluctuation
RESULTS
HCV epidemic before vaccination
Figure 2 depicts modeled trends in HCV sero-prevalence and incidence in Phases 1 and 2, overall and stratified by injecting risk group. In Phase 1, the overall HCV sero-prevalence rose rapidly and then leveled off at an average of 94% (standard deviation of 100 realizations, ±0.8%) 10 years after the start of the epidemic, with an average modeled incidence of acute infection of 59% ppy (±0.4%) (Figure 2). These estimates compare well with the observed 95% HCV sero-prevalence in IDU in San Francisco in 1987 (Lorvick, Kral et al. 2001), and 65% HCV sero-prevalence in IDU injecting for one year or less in 1988–1989 in Baltimore (Garfein, Vlahov et al. 1996). Behavior change caused the modeled HCV sero-prevalence to decline to 79% (±1.3%) 30 years after the start of phase 2. This estimate is between the 91% prevalence observed for older IDU (median age 45, IQR: 38–49) in San Francisco in the years 1998–2000 (Tseng, O’Brien T et al. 2007) and 45% for younger IDU (median age 22, IQR: 20–25) in San Francisco studied from 1997 to 1999 (Hahn, Page-Shafer et al. 2001). The estimated incidence of acute HCV infection declined to 27% ppy (±4%) 30 years after the start of Phase 2, similar to observed HCV incidence of 25–40% ppy in IDU in San Francisco (Hahn, Page-Shafer et al. 2002; Page-Shafer, Pappalardo et al. 2007). The modeled incidence of chronic HCV infection was 22% ppy (±3%) 10 years after the start of the epidemic and 14% ppy (±2%) and 30 years after the start of Phase 2.
Figure 2.

HCV sero-prevalence and incidence of acute infection for Phases 1 and 2, overall and by risk group. Behavior change is modeled to begin 20 years after the start of the epidemic. Lines show the average over 100 realizations of the model, and error bars delineate one standard deviation in either direction.
The impact of introduction of HCV vaccine
Figure 3 illustrates the simulated effects of the introduction of a hypothetical HCV vaccine. We made the conservative assumption that the vaccine will be ready to be introduced 40 years after the start of phase 2, essentially around the year 2025; note that because the dynamics in phase 2 are already near steady state 20 years earlier than this, the results would be very similar for an earlier vaccine introduction date. The best case scenario was a sero-targeted, high vaccination rate (1% per month), 80% efficacious vaccine, which caused a drop in the incidence of chronic HCV from an average of 13.5% (±2%) to 4.3% (±1%), 3.2% (±0.9%), and 2.3% (±0.6%) ppy at 5, 10, and 30 years, respectively, after the initiation of the vaccination program (Figure 3C). The risk-targeting strategy approached a similar long-term outcome, but the rate of decrease was much slower (Figure 3B) because many vaccine doses are wasted on previously-infected IDU. Vaccine delivered at a moderate rate (0.6% per month) resulted in a slightly higher (0.1% to 0.7% at 30 years) incidence of chronic HCV in the risk-targeting strategy compared to the sero-targeting strategy, but this difference was within the range of error of the simulations. An untargeted approach (Figure 3A) had little impact on the predicted incidence of chronic HCV, regardless of vaccine efficacy, except when vaccine coverage is very high (1% per month). The topmost curves in Figures 3A–3C additionally highlight that low vaccine coverage is unlikely to have substantial impact on the estimated incidence of chronic HCV, regardless of vaccine efficacy. Similar qualitative effects were seen on the prevalence of chronic HCV infection (Appendix, Figure A1), though the decrease is more gradual. The prevalence of chronic HCV 60 years after the introduction of vaccine ranged from 20% to 35% for a risk-targeted or sero-targeted vaccine strategy with very high vaccine coverage (1% per month) and ranged from 29% to 44% for the same strategies with moderate coverage (0.6% per month).
Figure 3.

Incidence of chronic HCV infection (ppy) after the introduction of a hypothetical HCV vaccine, by targeting strategy: A. no targeting, B. risk targeting, and C. sero-targeting, efficacy, and vaccination rate over time. Figures show the mean of 100 realizations. Standard deviations 30 years after vaccine introduction range from 0.006 (for lower incidence) to 0.019 (for higher incidence).
Robustness to alternative parameter estimates
With few exceptions, the dynamics of Phase 1 and Phase 2 HCV sero-prevalence and incidence of acute infection were very robust to alternative values of key parameters (Figures 4 and 5). A striking exception was the dramatic impact of reducing the transmission probability of AES: the estimated incidence of acute HCV infection 30 years after the start of Phase 2 fell from 27% (±4%) ppy in the base case to 10% (±2%) ppy and 4% (±1%) ppy when we reduced the transmission probability of AES to 25% of the value used in the base model and to zero, respectively. Also, when the levels of infectivity of chronic and acute infection were set equal, it took longer to reach equilibrium in Phase 1, but the equilibrium values were similar to the base case parameter estimates. When we assumed greater behavior change in Phase 2, the estimated Phase 2 equilibrium sero-prevalence and incidence decreased from the base case, but not substantially. The assumptions about protective immunity after spontaneous clearance of HCV had minimal effect on sero-prevalence (Figure 4C) and acute incidence (Figure 5C) because these measures detect first time infections and not reinfection. There was, however, an effect on the estimated incidence of chronic HCV infection in Phases 1 and 2, with incidence of chronic infection reduced if we assume that all persons who spontaneously clear HCV gain partial protective immunity to future infection (15.7%±2.2% ppy 10 years after the start of the epidemic and 10.5% ±1.5% 30 years after the start of phase 2) and higher if we assume full susceptibility to re-infection after spontaneous clearance of infection (38.5% ±3.9% ppy 10 years after the start of the epidemic, and 19.7% ±2.5% ppy 30 years after the start of phase 2, data not shown).
Figure 4.

HCV sero-prevalence in Phases 1 and 2 of the HCV epidemic under alternative parameter values for A. the infectivity of receptive needle sharing (RNS), ancillary equipment sharing (AES), acute HCV, and chronic HCV; B. the behavior of IDU entering the population at the start of Phase 2; and C. immunity to re-infection after spontaneous clearance of HCV. Parameters are defined in Table 1.
Figure 5.

Incidence of acute HCV infection in Phase 1 and 2 when varying parameters related to A. the infectivity of receptive needle sharing (RNS), ancillary equipment sharing (AES), acute HCV, and chronic HCV; B. behavior of IDU entering the population at the start of Phase 2; and C. immunity to re-infection after spontaneous clearance of HCV. Parameters are defined in Table 1.
The qualitative results of the vaccination scenarios were robust to alternative parameter estimates, in that the sero-targeting strategy always provided the most rapid reduction of chronic incidence and high vaccine coverage rates were essential for significant declines in HCV (Table 2). Our results did not differ markedly when we assumed that 100% of vaccinees complete the three-dose vaccine series, presumably because in the base case most complete two doses which yield significant protection. We note that the incidence of chronic HCV infection was substantially reduced after the introduction of a vaccination program when we assumed no reductions in risk behavior in Phase 2, which is of relevance to areas where other programs designed to reduce bloodborne infections are not being implemented.
CONCLUSIONS
Our investigations suggest that the introduction of an HCV vaccine to an IDU population can have substantial impact on the incidence of chronic HCV, and the effect of such a program will be optimized through targeting strategies and high vaccination rates. However, we found that an untargeted vaccination strategy (as might be considered to maximize vaccination coverage) will be effective in reducing population incidence of chronic HCV only at very high rates of vaccination, and such an approach will take longer to reduce chronic HCV compared to targeted approaches. Though even the most aggressive vaccine scenario still leaves about 20% HCV prevalence of chronic infection after several years, such vaccination can bring the system to a state where other interventions may drive HCV to extinction.
We designed our model to reflect both our direct experience with IDU populations in San Francisco and the reports of researchers elsewhere. Crucial model parameters were estimated by analysis of extensive data we have collected in IDU, and we investigated the robustness of our results to a range of values for those biological and behavioral parameters for which there is the most uncertainty. With a few exceptions, our results were robust to changes in most of the parameter values. There were no substantial changes in epidemic dynamics under alternative assumptions regarding vaccine series completion, behavior change, infectivity of RNS, and immunity to re-infection after spontaneous clearance. Rather than using transmission probabilities derived from infection rates of health care workers sustaining occupationally-acquired needle-sticks, we estimated the transmission probability for RNS based on rates of infection and frequency of RNS in the UFO study. Our estimate, when averaged over the acute and chronic phase of HCV infection, was 0.98%, only slightly lower than the range (1–3%) used in other models of HCV in IDU (Mather and Crofts 1999; Murray, Law et al. 2003; Hutchinson, Bird et al. 2006; Vickerman, Hickman et al. 2007). Our estimates of Phase 1 and Phase 2 HCV sero-prevalence and incidence were highly sensitive to the assumed per-event transmission probability of AES: this arose because low- and medium-risk IDU do not practice RNS (by definition), so AES is the only route by which they can be infected. When we reduced the transmission probability of AES in our model, estimates of Phase 2 HCV incidence fell below the range of published values for IDU. We feel that this reinforces the evidence that AES is a significant factor in the HCV epidemic in IDU (Mathei, Shkedy et al. 2006), especially in populations such as San Francisco in which AES is the only risk behavior for a substantial fraction of the IDU. This finding suggests further emphasis should be placed on interventions to reduce the rate of sharing ancillary injecting equipment. However, we do caution that it is possible that RNS is under-reported relative to AES, thereby causing us to overstate the importance of AES. In any case, other studies have reported that AES is quite common (Thiede, Hagan et al. 2007) and is on the rise (Burt, Hagan et al. 2007). Because our study is the first to estimate the per-event transmission probability of AES we suggest that further estimates of this quantity be pursued.
For simplicity, we modeled constant risk behavior for each IDU over their injecting career, rather than allowing for within-person variability, and introduced behavior change at the population level rather than modeling within-person changes. This assumption may have delayed the dynamical impact of reduced risk behavior at the outset of Phase 2, but will not affect average long-term dynamics. Immigration of HCV-positive individuals was not incorporated into our model, consistent with our finding that HCV prevalence was higher in young IDU who had lived in San Francisco for a longer period (Hahn, Page-Shafer et al. 2001). This assumption would not qualitatively influence our results, since the infection is endemic in the population and has a negligible chance of extinction. We did not consider sexual transmission of HCV due to the low risk of transmission by this route relative to injecting (Hahn 2007).
We considered a network-based model to reflect non-randomness in choice of injecting partners, as have been constructed in models of HIV transmission in IDU (Kretzschmar and Wiessing 1998). However, our data indicated that partner turnover is likely to be quite high because the IDU we surveyed reported large number of partners for buying and presumably sharing drugs (Table A1). We decided not to pursue a network approach because as the number of partners and the rate of partner turnover increases relative to the rate of disease transmission, network models may approach random mixing models (Volz and Meyers 2007). Further data on the structure of IDU networks, such as degree distribution, partnership duration, mixing patterns by age or years injecting, and clustering, are needed to determine whether a network-based model will lead to significantly different results. We suggest that further studies also consider the implications of differential injecting risk by sex or mixing patterns based on age.
Our analysis extends previous work in two important ways. First, we estimated the overall effects of vaccination on an IDU population and compared several strategies for vaccine delivery. We used data-based estimates of vaccine series completion and risk behavior in this population. Second, our models were the first to include the likely substantial effect of ancillary equipment sharing on HCV transmission. Our robustness analyses indicated that these behaviors may account for a large number of HCV infections, particularly in lower-risk groups, and should be considered in future prevention programs and epidemiological and modeling studies.
These results carry significant messages for public health planning. There is clearly a need to reduce the incidence of HCV in IDU, and previous work showed that very large reductions in risk behavior are needed to have a substantial impact on HCV prevalence (Vickerman, Hickman et al. 2007). Our findings are encouraging because they illustrate that a vaccine with efficacy even as low as 50% can substantially reduce the incidence of chronic HCV in an IDU population given a high rate of delivery, although further reductions in risk behavior would also be needed to eradicate HCV in IDU. However, history has shown that vaccinating IDU is not an easy task. Recent studies reported that only 3–22% of IDU had been vaccinated against HBV (Campbell, Garfein et al. 2007; Lum, Hahn et al. 2008), although immediate vaccination, without waiting for serologic results, resulted in higher rates (Campbell, Garfein et al. 2007). The latter observation, combined with our finding that sero-targeted vaccine strategies are significantly more effective, emphasizes that rapid HCV testing such as a recently developed antibody test (Desbois, Vaghefi et al. 2008) may be a crucial tool in reducing the public health burden of HCV in IDU populations. Our broader results underscore the importance of further research in HCV vaccine development and methods of vaccine delivery.
Acknowledgments
Funding
This work was supported by the US National Institutes of Health grants K01 DA023365 (Hahn), R01 DA016017 (Page-Shafer and Hahn), R01 DA013510 (Getz, Sanchez), and POHC01000726 (Sanchez); a James S McDonnell 21st Century Science Initiative Award (Getz, Wylie, Dill); a Center for Infectious Disease Dynamics Postdoctoral Fellowship (Lloyd-Smith); and University of California Systemwide Biotechnology Research & Education Program Graduate Research and Education in Adaptive Bio-Technology Training Grant (Dill). The funders had no role in study design, data collection and analysis, decision to publish, or preparation of the manuscript.
We thank Ailey Crow for substantial input in the early phases of model development when we were initially using a network framework to carry out simulations, Michael Houghton for reviewing our assumptions about HCV vaccine candidates, James Ryan for reviewing our assumptions about partial immunity after spontaneous clearance, the UFO Study staff and investigators for data collection and the UFO Study participants for their participation.
APPENDIX
Methods for estimation of per-event transmission probabilities
We sought to estimate three unknown quantities: (1) the per-event transmission probability due to RNS in the acute phase (denoted βA,RNS), which was set equal to 10 times the probabilities in the chronic and attenuated acute phases (denoted βC,RNS and βAA,RNS respectively), (2) the per-event transmission probability due to AES in the acute phase (denoted βA,AES), set equal to 10 times the probabilities in the chronic and attenuated acute phases (denoted βC,AES and βAA,AES respectively), and (3) the per-day probability of AES events in the low-risk group. We estimated these by requiring that the average incidence values at Phase 2 equilibrium equaled (to within 1%) the values measured in the UFO study for the three risk groups. The incidence rates we observed in 213 young IDU studied prospectively from 2000 to 2001 were 55% ppy (95% confidence interval [CI]: 36.2–79.7% ppy), 30% ppy (95% CI: 11.9–61.5% ppy), and 15% ppy (95% CI: 9.5–22.6% ppy) for high-, medium-, and low-risk IDU respectively. We allowed the estimated rate of AES per day in the low-risk group to be greater than zero to allow for some HCV transmission because we observed an HCV incidence of 15% ppy in this group. We estimated the infectivity parameters manually, by running the model 100 years past phase II equilibrium (60 years after the start of the epidemic) and adjusting the transmission probabilities one at a time, using time-averaged results over 100 years. We first estimated the transmission probability for AES by fitting to the incidence in the low risk users who only engaged in AES.
Table A1.
Self-reported recent injecting risk behaviors in young IDU in San Francisco, 2000–2001.
| High-risk IDU (n=360) | Medium-risk IDU (n=162) | Low-risk IDU (n=322) | |
|---|---|---|---|
| Median number of days injected, prior 30 (inter-quartile range) | 25 (14–30) | 20 (9–30) | 20 (8–30) |
| Median typical number of injections per day injecting, prior 30 days (inter-quartile range) | 3 (2–4) | 2.5 (2–4) | 2.5 (1.5–4) |
| Median # of injecting events, prior 30 days (number of days injected times usual number of injections per day injecting) (inter-quartile range) | 69 (30–105) | 45 (16–40) | 42 (15–90) |
| Frequency of RNS* (prior 3 months) | |||
| Always | 5% | --- | --- |
| Usually | 7% | --- | --- |
| Sometimes | 22% | --- | --- |
| Rarely | 66% | --- | --- |
| Never | 0% | 100% | 100% |
| Median imputed number RNS* events, prior 30 days (inter-quartile range)*** | 9 (4–15) | 0 | 0 |
| Median number of persons with whom engaged in RNS, prior 3 onths (inter-quartile range) | 1 (1–2) | 0 | 0 |
| Frequency of AES** (prior 3 months) | |||
| Always | 18% | 22% | --- |
| Usually | 17% | 19% | --- |
| Sometimes | 27% | 60% | --- |
| Rarely | 21% | --- | 28% |
| Never | 17% | --- | 72% |
| Median imputed number of AES** events, prior 30 days (inter-quartile range)*** | 12 (3–38) | 17 (6–34) | 0 (0–.7) |
| Median number of partners with whom pooled money to buy drugs, prior 3 months (inter-quartile range)**** | 3 (1–4) | 2 (1–5) | 2 (0–4) |
RNS, receptive needle sharing
AES, ancillary equipment sharing
Imputations multiplied the total number of injections per month by the proportion of injecting events in which risk behavior occurred in the prior 3 months, where Always=1; Usually=.75, Sometimes=.25, Rarely=.1, Never=0
This variable is used as a proxy for number of persons with whom the IDU engaged in AES
Figure A1.

Prevalence of RNA positive HCV after the introduction of a hypothetical HCV vaccine, by targeting strategy: A. no targeting, B. risk targeting, and C. sero-targeting, efficacy, and vaccination rate over time. Figures show the mean of 100 realizations.
Footnotes
Conflict of interest
The authors do not have commercial or other associations that might pose a conflict of interest.
Author contributions
JH wrote the first draft of the manuscript. All authors contributed to conception and design of the study, critically edited the manuscript, and approved the final draft. DW and JD conducted the model coding. KPS and JH collected and analyzed the data in the young IDU.
Publisher's Disclaimer: This is a PDF file of an unedited manuscript that has been accepted for publication. As a service to our customers we are providing this early version of the manuscript. The manuscript will undergo copyediting, typesetting, and review of the resulting proof before it is published in its final citable form. Please note that during the production process errors may be discovered which could affect the content, and all legal disclaimers that apply to the journal pertain.
Works Cited
- Alter M. Transmission of hepatitis C virus -- route, dose, and titer. New England Journal of Medicine. 1994;330(11):744–50. doi: 10.1056/NEJM199403173301111. [DOI] [PubMed] [Google Scholar]
- Altice FL, Bruce RD, et al. Adherence to hepatitis B virus vaccination at syringe exchange sites. J Urban Health. 2005;82(1):151–61. doi: 10.1093/jurban/jti016. [DOI] [PMC free article] [PubMed] [Google Scholar]
- Amon JJ, Garfein RS, et al. Prevalence of Hepatitis C Virus Infection among Injection Drug Users in the United States, 1994–2004. Clin Infect Dis. 2008 doi: 10.1086/588297. [DOI] [PubMed] [Google Scholar]
- Backmund M, Meyer K, et al. Infrequent reinfection after successful treatment for hepatitis C virus infection in injection drug users. Clin Infect Dis. 2004;39(10):1540–3. doi: 10.1086/425361. [DOI] [PMC free article] [PubMed] [Google Scholar]
- Burt RD, Hagan H, et al. Trends in Hepatitis B Virus, Hepatitis C Virus, and Human Immunodeficiency Virus Prevalence, Risk Behaviors, and Preventive Measures among Seattle Injection Drug Users Aged 18–30 Years, 1994–2004. J Urban Health. 2007;84(3):436–54. doi: 10.1007/s11524-007-9178-2. [DOI] [PMC free article] [PubMed] [Google Scholar]
- Busch MP. Insights into the epidemiology, natural history and pathogenesis of hepatitis C virus infection from studies of infected donors and blood product recipients. Transfus Clin Biol. 2001;8(3):200–6. doi: 10.1016/s1246-7820(01)00125-2. [DOI] [PubMed] [Google Scholar]
- Campbell JV, Garfein RS, et al. Convenience is the key to hepatitis A and B vaccination uptake among young adult injection drug users. Drug Alcohol Depend. 2007 doi: 10.1016/j.drugalcdep.2006.09.022. [DOI] [PubMed] [Google Scholar]
- Currie SL, Ryan JC, et al. A prospective study to examine persistent HCV reinfection in injection drug users who have previously cleared the virus. Drug Alcohol Depend. 2008;93(1–2):148–54. doi: 10.1016/j.drugalcdep.2007.09.011. [DOI] [PubMed] [Google Scholar]
- Dalgard O. Follow-up studies of treatment for hepatitis C virus infection among injection drug users. Clin Infect Dis. 2005;40(Suppl 5):S336–8. doi: 10.1086/427449. [DOI] [PubMed] [Google Scholar]
- Dalgard O, Bjoro K, et al. Treatment of chronic hepatitis C in injecting drug users: 5 years’ follow-up. Eur Addict Res. 2002;8(1):45–9. doi: 10.1159/000049487. [DOI] [PubMed] [Google Scholar]
- De P, Roy E, et al. Risk of hepatitis C virus transmission through drug preparation equipment: a systematic and methodological review. J Viral Hepat. 2008 doi: 10.1111/j.1365-2893.2007.00942.x. [DOI] [PMC free article] [PubMed] [Google Scholar]
- Des Jarlais DC, Perlis T, et al. Reductions in hepatitis C virus and HIV infections among injecting drug users in New York City, 1990–2001. Aids. 2005;19(Suppl 3):S20–5. doi: 10.1097/01.aids.0000192066.86410.8c. [DOI] [PubMed] [Google Scholar]
- Desbois D, Vaghefi P, et al. Sensitivity of a rapid immuno-chromatographic test for Hepatitis C antibodies detection. J Clin Virol. 2008;41(2):129–33. doi: 10.1016/j.jcv.2007.11.002. [DOI] [PubMed] [Google Scholar]
- Esposito N, Rossi C. A nested-epidemic model for the spread of hepatitis C among injecting drug users. Math Biosci. 2004;188:29–45. doi: 10.1016/j.mbs.2003.11.001. [DOI] [PubMed] [Google Scholar]
- Folgori A, Capone S, et al. A T-cell HCV vaccine eliciting effective immunity against heterologous virus challenge in chimpanzees. Nat Med. 2006;12(2):190–7. doi: 10.1038/nm1353. [DOI] [PubMed] [Google Scholar]
- Garfein RS, Golub ET, et al. A peer-education intervention to reduce injection risk behaviors for HIV and hepatitis C virus infection in young injection drug users. Aids. 2007;21(14):1923–1932. doi: 10.1097/QAD.0b013e32823f9066. [DOI] [PubMed] [Google Scholar]
- Garfein RS, Vlahov D, et al. Viral infections in short-term injection drug users: the prevalence of the hepatitis C, hepatitis B, human immunodeficiency, and human T-lymphotropic viruses. Am J Public Health. 1996;86(5):655–61. doi: 10.2105/ajph.86.5.655. [DOI] [PMC free article] [PubMed] [Google Scholar]
- GlaxoSmithKline. Twinrix Prescribing Information. Retrieved 11/28/07, from http://us.gsk.com/products/assets/us_twinrix.pdf.
- Glynn SA, Wright DJ, et al. Dynamics of viremia in early hepatitis C virus infection. Transfusion. 2005;45(6):994–1002. doi: 10.1111/j.1537-2995.2005.04390.x. [DOI] [PubMed] [Google Scholar]
- Grebely J, Conway B, et al. Hepatitis C virus reinfection in injection drug users. Hepatology. 2006;44(5):1139–45. doi: 10.1002/hep.21376. [DOI] [PubMed] [Google Scholar]
- Hagan H, Des Jarlais DC. HIV and HCV infection among injecting drug users. Mt Sinai J Med. 2000;67(5–6):423–8. [PubMed] [Google Scholar]
- Hagan H, Des Jarlais DC, et al. HCV synthesis project: preliminary analyses of HCV prevalence in relation to age and duration of injection. Int J Drug Policy. 2007;18(5):341–51. doi: 10.1016/j.drugpo.2007.01.016. [DOI] [PubMed] [Google Scholar]
- Hahn JA. Sex, drugs, and hepatitis C virus. J Infect Dis. 2007;195(11):1556–9. doi: 10.1086/516792. [DOI] [PubMed] [Google Scholar]
- Hahn JA, Page-Shafer K, et al. Hepatitis C virus seroconversion among young injection drug users: relationships and risks. J Infect Dis. 2002;186(11):1558–64. doi: 10.1086/345554. [DOI] [PubMed] [Google Scholar]
- Hahn JA, Page-Shafer K, et al. Hepatitis C virus infection and needle exchange use among young injection drug users in San Francisco. Hepatology. 2001;34(1):180–7. doi: 10.1053/jhep.2001.25759. [DOI] [PubMed] [Google Scholar]
- Houghton M, Abrignani S. Prospects for a vaccine against the hepatitis C virus. Nature. 2005;436(7053):961–6. doi: 10.1038/nature04081. [DOI] [PubMed] [Google Scholar]
- Hutchinson SJ, Bird SM, et al. Modelling the spread of hepatitis C virus infection among injecting drug users in Glasgow: Implications for prevention. Int J Drug Policy. 2006;17:211–221. [Google Scholar]
- Kapadia F, Latka MH, et al. Design and Feasibility of a Randomized Behavioral Intervention to Reduce Distributive Injection Risk and Improve Health-Care Access Among hepatitisC virus Positive Injection Drug Users: The Study to Reduce Intravenous Exposures (STRIVE) J Urban Health. 2007;84(1):99–115. doi: 10.1007/s11524-006-9133-7. [DOI] [PMC free article] [PubMed] [Google Scholar]
- Krahn MD, John-Baptiste A, et al. Potential cost-effectiveness of a preventive hepatitis C vaccine in high risk and average risk populations in Canada. Vaccine. 2005;23(13):1549–58. doi: 10.1016/j.vaccine.2004.09.023. [DOI] [PubMed] [Google Scholar]
- Kretzschmar M, Wiessing LG. Modelling the spread of HIV in social networks of injecting drug users. Aids. 1998;12(7):801–11. doi: 10.1097/00002030-199807000-00017. [DOI] [PubMed] [Google Scholar]
- Lauer GM, Chung RT. Vaccine-induced T-cell responses against HCV: one step taken, more to follow. Gastroenterology. 2007;132(4):1626–8. doi: 10.1053/j.gastro.2007.03.010. [DOI] [PubMed] [Google Scholar]
- Law M, Maruyama T, et al. Broadly neutralizing antibodies protect against hepatitis C virus quasispecies challenge. Nat Med. 2008;14(1):25–7. doi: 10.1038/nm1698. [DOI] [PubMed] [Google Scholar]
- Logvinoff C, Major ME, et al. Neutralizing antibody response during acute and chronic hepatitis C virus infection. Proc Natl Acad Sci U S A. 2004;101(27):10149–54. doi: 10.1073/pnas.0403519101. [DOI] [PMC free article] [PubMed] [Google Scholar]
- Lorvick J, Kral AH, et al. Prevalence and duration of hepatitis C among injection drug users in San Francisco, Calif. Am J Public Health. 2001;91(1):46–7. doi: 10.2105/ajph.91.1.46. [DOI] [PMC free article] [PubMed] [Google Scholar]
- Lum PJ, Hahn JA, et al. Hepatitis B virus infection and immunization status in a new generation of injection drug users in San Francisco. J Viral Hepat. 2008;15(3):229–36. doi: 10.1111/j.1365-2893.2007.00933.x. [DOI] [PubMed] [Google Scholar]
- Lum PJ, Ochoa KC, et al. Hepatitis B virus immunization among young injection drug users in San Francisco, Calif: the UFO Study. Am J Public Health. 2003;93(6):919–23. doi: 10.2105/ajph.93.6.919. [DOI] [PMC free article] [PubMed] [Google Scholar]
- Mathei C, Shkedy Z, et al. Evidence for a substantial role of sharing of injecting paraphernalia other than syringes/needles to the spread of hepatitis C among injecting drug users. J Viral Hepat. 2006;13(8):560–70. doi: 10.1111/j.1365-2893.2006.00725.x. [DOI] [PubMed] [Google Scholar]
- Mather D, Crofts N. A computer model of the spread of hepatitis C virus among injecting drug users. Eur J Epidemiol. 1999;15(1):5–10. doi: 10.1023/a:1007548307196. [DOI] [PubMed] [Google Scholar]
- McGregor J, Marks PJ, et al. Factors influencing hepatitis B vaccine uptake in injecting drug users. J Public Health Med. 2003;25(2):165–70. doi: 10.1093/pubmed/fdg035. [DOI] [PubMed] [Google Scholar]
- Mehta SH, Cox A, et al. Protection against persistence of hepatitis C. Lancet. 2002;359(9316):1478–83. doi: 10.1016/S0140-6736(02)08435-0. [DOI] [PubMed] [Google Scholar]
- Micallef JM, Kaldor JM, et al. Spontaneous viral clearance following acute hepatitis C infection: a systematic review of longitudinal studies. J Viral Hepat. 2006;13(1):34–41. doi: 10.1111/j.1365-2893.2005.00651.x. [DOI] [PubMed] [Google Scholar]
- Micallef JM, Macdonald V, et al. High incidence of hepatitis C virus reinfection within a cohort of injecting drug users. J Viral Hepat. 2007;14(6):413–8. doi: 10.1111/j.1365-2893.2006.00812.x. [DOI] [PubMed] [Google Scholar]
- Murray JM, Law MG, et al. The impact of behavioural changes on the prevalence of human immunodeficiency virus and hepatitis C among injecting drug users. Int J Epidemiol. 2003;32(5):708–14. doi: 10.1093/ije/dyg102. [DOI] [PubMed] [Google Scholar]
- Operskalski EA, Mosley JW, et al. HCV viral load in anti-HCV-reactive donors and infectivity for their recipients. Transfusion. 2003;43(10):1433–41. doi: 10.1046/j.1537-2995.2003.00475.x. [DOI] [PubMed] [Google Scholar]
- Page-Shafer K, Pappalardo BL, et al. Testing strategy to identify cases of acute hepatitis C virus (HCV) infection and project HCV incidence rates. J Clin Microbiol. 2007 doi: 10.1128/JCM.01229-07. [DOI] [PMC free article] [PubMed] [Google Scholar]
- Perz JF, Armstrong GL, et al. The contributions of hepatitis B virus and hepatitis C virus infections to cirrhosis and primary liver cancer worldwide. J Hepatol. 2006 doi: 10.1016/j.jhep.2006.05.013. [DOI] [PubMed] [Google Scholar]
- Pollack HA. Cost-effectiveness of harm reduction in preventing hepatitis C among injection drug users. Med Decis Making. 2001;21(5):357–67. doi: 10.1177/0272989X0102100502. [DOI] [PubMed] [Google Scholar]
- Thiede H, Hagan H, et al. Prevalence and correlates of indirect sharing practices among young adult injection drug users in five U.S. cities. Drug Alcohol Depend. 2007 doi: 10.1016/j.drugalcdep.2007.03.001. [DOI] [PubMed] [Google Scholar]
- Tseng FCR, O’Brien T, et al. Seroprevalence of hepatitis C virus and hepatitis B virus among San Francisco injection drug users, 1998 to 2000. Hepatology. 2007 doi: 10.1002/hep.21765. [DOI] [PMC free article] [PubMed] [Google Scholar]
- van de Laar TJ, Langendam MW, et al. Changes in risk behavior and dynamics of hepatitis C virus infections among young drug users in Amsterdam, the Netherlands. J Med Virol. 2005;77(4):509–18. doi: 10.1002/jmv.20486. [DOI] [PubMed] [Google Scholar]
- Vickerman P, Hickman M, et al. Modelling the impact on Hepatitis C transmission of reducing syringe sharing: London case study. Int J Epidemiol. 2007;36(2):396–405. doi: 10.1093/ije/dyl276. [DOI] [PubMed] [Google Scholar]
- Volz E, Meyers LA. Susceptible-infected-recovered epidemics in dynamic contact networks. Proc Biol Sci. 2007;274(1628):2925–33. doi: 10.1098/rspb.2007.1159. [DOI] [PMC free article] [PubMed] [Google Scholar]