Abstract
We validate, by comparison with experimental data, a theoretical description of the amperometric response of microbiosensors formed via enzyme entrapment. The utility of the theory is further illustrated with two relevant examples supported by experiments: (1) quantitative detection of glucose and (2) quantitative detection of adenosine triphosphate (ATP).
1. Introduction
Miniaturized enzyme based amperometric biosensors are of considerable interest due to their inherent specificity, fast response, and potential for high spatial resolution when combined with SECM. [1-5]. Some biologically relevant analytes require a complex biosensing interface, with co-immobilization of multiple enzymes [3, 6-10]. Immobilization, or entrapment, of enzymes in a polymer matrix formed electrochemically via pH shift induced desolubilization offers the benefits of ease of implementation, retention of enzyme activity, and extended sensor stability [9, 11, 12]. In a companion paper, we present a model which describes the response of polymer entrapped enzyme biosensors with micro-disk electrodes and polymeric matrices formed via pH shift induced polymer deposition [13].
Theoretical prediction of the Faradaic current signal for enzyme microelectrodes based on polymer-entrapped enzymes is a prerequisite to reliable data interpretation and targeted sensor optimization. Due to lack of a first principles model, the design of probes is at present entirely empirical. Furthermore, the calibration of probes provides no insight to the physical basis of the sensor response. The purpose of this work is the demonstration of the validity and utility of a theory of steady-state response of polymer-entrapped enzyme ultramicroelectrodes (UMEs) [13]. This analytical formulation is for disk microelectrodes covered with polymeric matrices formed via pH shift induced polymer deposition [11]. We apply the developed methodology to describe the steady-state current signal from an ultramicroelectrode that responds to changes in glucose and adenosine triphosphate (ATP). The UME acts as the transducer of a biosensor, exploiting enzymatically mediated reactions that involve the analytes, glucose and ATP, to produce a measurable effect. Glucose biosensors have served as the model system for electrochemical biosensor development [14], and ATP is an important analyte due to its pivotal physiological role.
The enzymes utilized in the described sensor, glucose oxidase (GOX) and hexokinase (HEX), are co-immobilized via electrophoretic deposition and entrapment in a small polymer domain atop the active electrode area [9]. The application of the theoretical description to experimental data achieves three main purposes: i) it indicates the validity of the theory; ii) it demonstrates the use of the theory to obtain calibration in terms of physically meaningful parameters; and, iii) it provides an example of the utility of the theory in both data analysis and experimental design.
2. Theory
The measured signal for an amperometric microbiosensor is a Faradaic current produced by a redox reaction of an electroactive species R, which is generated or consumed in the enzymatically catalyzed reaction. The presence of the target analyte, A, affects the net rate of mass transfer to the electrode surface of species R, so that the current signal is indicative of the bulk analyte species concentration, C∞,A. For a polymer-entrapped enzyme UME, the production of R is confined to a polymer domain adjacent to the electrode.
A related work [13] details the development of a closed-form analytical description of the relationship between the steady-state Faradaic current produced by the oxidation or reduction of the electroactive species and the bulk concentration of the analyte species, C∞,A. The steady-state electrode current I is expressed in terms of an equivalent bulk concentration (K) of redox active species R:
| (1) |
In Eq. (1) n is the number of moles of electrons transferred per mole of electroactive species oxidized (− sign) or reduced (+ sign), F is the Faraday constant, DR is diffusivity of the electroactive species in the electrolyte, and a is the radius of the disk electrode. Equation (1) is deceptively simple: all of the complexity hides in K, which is called the “equivalent redox species bulk concentration” because of the similarity between Eq. (1) and the equation for the steady response of a disk UME. The equivalent redox species bulk concentration, K, captures effects of modified electrode geometry and enzyme kinetics, and depends upon the bulk concentrations of the analyte and all co-substrates as well as the transport properties of these species. In addition to the derivation of Eq. (1), the companion paper carefully details the algorithm(s) by which K can be determined [13].
We have derived exact closed-form expressions for K under certain limiting conditions; thus, the prediction of electrode current I using Eq. (1) requires (i) determining whether the conditions that allow for analytical solution are met and (ii) using that information to calculate the equivalent bulk concentration K of the redox active species R [13]. In the companion paper, the steps needed to apply the analytical solution are described assuming that all necessary parameters, e.g., those in Tables I, II, and III, are available.
Table I.
Diffusivities in the Electrolyte (Obtained from Literature) [m2s−1]
Table II.
Enzyme Kinetic Parameters (Obtained from Literature)
| Michaelis Constants GOX reaction [25, 26] [mol m−3] | |||
| KG | KO2 | ||
| 40 | 1 | ||
|
| |||
| Michaelis Constants HEX reaction [34] [mol m−3] | |||
| KMgATP | KMgADP | KG6P | |
| 0.1 | 0.063 | 0.23 | 3 |
|
| |||
| Inhibition Constants HEX reaction [34] [mol m−3] | |||
| KiG | KiMgATP | KiMgADP | KiG6P |
| 0.31 | 1 | 1.6 | 21 |
|
| |||
| Oher Kinetic Constants [25, 26, 41] | |||
| V1 | Keq | ||
| 500[S−1]CT | 5.3 | 1300 | |
| see Table III | |||
Table III.
Parameters for Current Prediction (Obtained Through Calibration)
| Symbol |
Name and
Description |
Comments | Numerical Value(s) |
| α | Disk electrode radius |
Obtained through steady-state amperometric current measurements with a bare electrode.[15] |
12.5 μm |
| Z | Polymer domain size (dimensionless) |
Assuming an oblate hemispheroid, obtained through steady-state amperometric characterization as described in this work. |
0.88 (0.59 for FIA experiments) |
| θ | Partitioning coefficient |
Determined via chronoamperometry (as described in this work) using a redox species that does not interact with the immobilized enzyme(s). We assume that a single θ can describe all species behavior adequately. |
0.89 |
| α | Diffusivity ratio | Ratio of diffusivity in the polymer to diffusivity in the electrolyte. Determined via chronoamperometry (as described in this work) using a redox species that does not interact with enzyme. We assume that a single α can describe all species behavior adequately. |
0.69 |
| CT | Concentration of active enzyme sites for GOX |
The enzyme activity in the polymer is determined as a result of the calibration procedure using the steady-state GOX or GOX/HEX electrode response to glucose. |
Glucose electrode 6.09×10⁻⁵ mol m−3 ATP electrode 1.446×10⁻⁴ mol m−3 |
| V 1 HEX | Maximum enzyme reaction velocity for HEX catalyzed reaction |
The enzyme activity in the polymer is determined as a result of the calibration procedure using the steady-state GOX/HEX electrode response to ATP. |
≈8 mol m−3 s−1 |
In this work we demonstrate the application of the general theory to a specific biosensor for which several parameters are not known a priori. These parameters, which are listed in Table III, are obtained through calibration. The calibration procedure thus provides physically meaningful parameters, which can be grouped as: i) bare metal electrode characteristics (disk radius, a); ii) polymer entrapment domain characteristics (dimensionless size, Z, and transport properties, α and θ); and, iii) enzyme characteristics (total concentration of active enzyme sites, CT, and maximum reaction velocity, ). The characterization of the unmodified bare electrode is a standard procedure [15]. The polymer domain characterization is accomplished using chronoamperometry as described in this work. The diffusivity ratio α and partitioning coefficient θ are obtained from transient current response data, and the polymer domain size can then be calculated using our analytical model. Finally, determination of enzyme activity in the polymer is also accomplished via application of the developed model to published data [9, 16].
3. Experimental Methods
3.1. Ultramicroelectrode preparation
Pt ultramicroelectrodes were prepared by sealing a 25 μm diameter Pt wire (purity >99.99 %, Goodfellow, Devon, PA) inside a 1 mm (outer diameter) borosilicate glass capillary. The capillary was sealed under vacuum using a resistive heating coil. Thereafter, a Pt disk electrode was obtained from consecutive grinding and polishing steps yielding a microelectrode with a final outer diameter of 750 μm. As a final step the Pt electrodes were electrochemically cleaned in 0.5M H2SO4.
GOX and HEX were co-immobilized at the Pt electrode using pH shift induced polymer entrapment as previously described [9, 17]. The polymer solution was prepared by mixing 70 μL of Canguard suspension with 1 mL of HPLC grade water. This solution was kept at 4 °C for 30 minutes. Electrodeposition was performed via multiple (N) deposition cycles.
3.2. Chronoamperometric characterization
The polymer domain characterization procedure, described in the Supporting Information, was followed using a 25 μm diameter platinum electrode immersed in a solution containing 30 mM [Fe(CN)6]4− in 0.5 M KCl supporting electrolyte. For polymer deposit characterization, the electrode was modified using N deposition cycles to immobilize GOX and HEX [9], with measurements taken for N of 1, 3, 5, 10, 15 and 20. Five repeats were obtained at each number of cycles. For the transient electrochemical measurements, a potential step to 600 mV vs SCE was applied to the electrode. For several of the modified electrodes the polymer deposit radius was determined visually using a microscope.
3.3. Flow injection analysis
A calibration of the ATP microbiosensor was performed using flow injection analysis (FIA) [18]. The buffer for the FIA experiment consists of 100 mM phosphate buffer (pH 7.4), containing 5 mM glucose and 5 mM MgCl2. ATP solutions at 1-10 μM concentration range were prepared in the same buffer solution. The peristaltic pump of a FIA system (FIAlab, FIAlab Instruments, Bellevue, WA) was utilized in combination with an 8-way valve to expose the microbiosensor to ATP solutions at different concentrations. An electrochemical flow cell was designed and fabricated with a 5-way manifold for solution inlet and outlet and electrode ports [18]. A flow rate of 8 μL s−1 was selected and a pulse damping module was added to minimize the effects of the pulse generated by the peristaltic pump. The amperometric microbiosensor was biased at 0.65 V versus Ag/AgCl for oxidizing hydrogen peroxide generated by the GOX-catalyzed oxidation of glucose. The electrochemical experiment was controlled by a bipotentiostat (CH Instruments, Austin, TX), and the resulting i-t curve was processed using Matlab software (Matlab 7.0, Mathworks, Natick, MA).
4. Sensor Description
Application of the theory is demonstrated using glucose and adenosine triphosphate (ATP) measurements [9, 19-21]. Both measurements utilize glucose oxidase, which catalyzes the conversion of glucose to gluconolactone using dissolved molecular oxygen as an electron receptor. The electroactive species produced by this reaction is hydrogen peroxide [22]:
| (2) |
The electrode redox reaction is [23]
| (3) |
The theoretical description of entrapped enzyme biosensors [13] accounts for the effect of the enzyme reaction on species concentrations through appropriately defined source terms. We make several simplifying assumptions in their derivation: i) effects of pH differences between the polymer matrix and electrolyte due to different buffering conditions or due to the production of H+ at the electrode are negligible; ii) enzyme activity is uniform throughout the polymer matrix; and iii) kinetic coefficients of the enzyme catalyzed reaction are unaltered by immobilization [24]. Assumption i) is justified solely by the observation that inclusion of a proton transport model would severely complicate the model and require currently unavailable information about proton partitioning and pH buffer kinetics.
4.1. Glucose Sensing: GOX Reaction Source Terms
Generation of the electroactive species, H2O2, due to reaction (2) follows a ping-pong Bi-Bi mechanism [25, 26]. The resulting source terms, which depend on the concentrations of glucose, CG, and oxygen, CO2, are
| (4) |
The Michaelis coefficients, KG and KO2, are provided in Table II (for a pH of 7.4), as is an expression for the maximum rate V1 in terms of the concentration of active enzyme sites, the quantity determined using experimental data [9, 16] in conjunction with our model.
4.2. ATP Sensing: GOX and HEX Reaction Source Terms
The ATP microbiosensor is based on two co-immobilized enzymes, glucose oxidase (GOX) and yeast hexokinase (HEX). The sensor again yields a Faradaic current due to the oxidation of H2O2, which is produced by the GOX catalyzed reaction in Eq. (2). HEX, which catalyzes the transfer of a phosphate from ATP to glucose, competes with the GOX catalyzed reaction for the substrate glucose. The presence of ATP in solution therefore decreases the current magnitude [9, 16].
The mathematical description of the HEX catalyzed reaction kinetics is complicated, as (i) the reaction exhibits product inhibition [27] (ii) the reaction requires a divalent metal cation cofactor, Me, such as Mg2+ [28, 29], and (iii) the reaction of Me with ATP and ADP alters the concentrations of ATPMe, ATP, ADPMe and ADP, all of which may form complexes with the enzyme [30-34]. Further complication arises from the fact that yeast hexokinase exists in two non-interconvertible isomerizations which display differing kinetics, and obtained enzyme may be a mix of the two HEX forms [35]. Finally, and possibly due to the aforementioned factors, reported kinetics constants vary by up to three orders of magnitude [36].
We adopt a simplified mechanism that lacks some details of the actual mechanism, but captures its dominant features. Furthermore, excess Mg2+ and rapid equilibration of the reactions ATP4− + Mg2+ ⇋ ATPMg2− and ADP3− + Mg2+ ⇋ ADPMg− are assumed. The condition of excess Mg2+ may not always be the case in vivo, where free magnesium cation concentrations are typically ~ 0.4 mol m−3 [37]; however, it is frequently the case experimentally, where an optimal level of 5 mol m−3 has been reported for GOX/HEX sensors [38]. Note that the equilibrium constant for the ATP/Mg reaction is 1.17×10⁷ mol−1m3 [39], and reported ATP concentrations are from 0.001 mol m−3 to 2.5 mol m−3 [9, 20, 38, 40]. The net reaction is
| (5) |
The mechanism of the HEX catalyzed reaction is probably random Bi Bi [35]. Unfortunately, published data yielding all the necessary kinetic constants are not available. However, under most conditions the reaction behaves as if it were compulsory ordered Bi Bi [41]:
| (6) |
In the ordered Bi Bi reaction mechanism presented in Eq. (6), HEX, denoted in its uncomplexed state by E, catalyzes the transfer of a phosphate from MgATP to glucose (G) The products are glucose 6-phospate (G6P) and MgADP. The corresponding source terms used in theoretical predictions, which can be derived by writing species conservation equations for differential control volumes, or, equivalently, by applying the schematic method of King and Altman [42], are
| (7) |
All kinetics constants in Eq. (7) are provided in Table II, and are taken from published data [34]. The maximum reaction velocity depends upon the concentration of active enzyme sites and is thus obtained from experimental data [9, 16].
Finally, the source term for glucose includes effects of both the GOX catalyzed reaction and the HEX catalyzed reaction:
| (8) |
5. Calibration Using the Theory
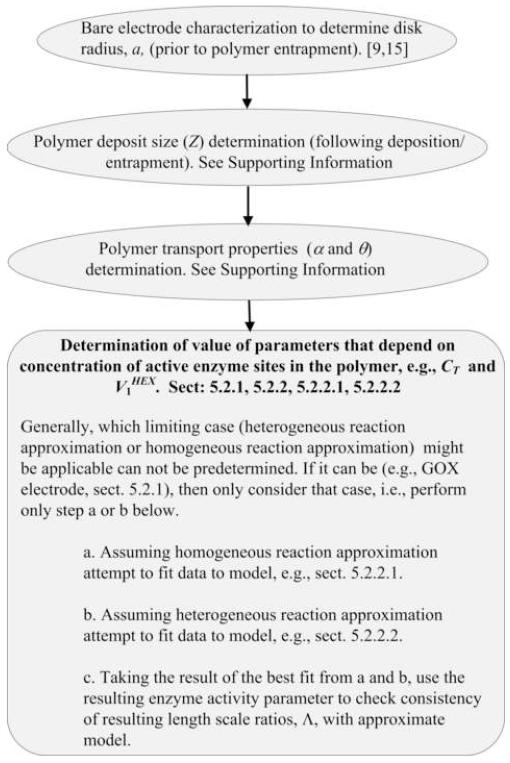
The calibration proceeds through several steps (Fig. 1): first the metal electrode size is determined; then, the polymer transport properties and size of the polymer deposit (given by the nondimensional parameter Z, defined in the Supporting Information) are determined using chronoamperometry; third, the experimentally obtained response of the biosensor to glucose is used to determine the concentration of active enzyme sites for entrapped GOX, CT; and, finally, the experimental ATP response is used to obtain a value for the unknown maximum reaction velocity of the HEX catalyzed reaction, .
Fig. 1.
Flow chart depicting main steps for calibration.
5.1. Polymer Deposit Characterization
Due to a lack of physical property information and for simplicity we assume that partitioning coefficients θi and diffusion coefficient ratios αi are the same for all species. In hydrogels, typical values of the product αθ range from 0.05 to 0.9, with larger solute molecules in general having lower values [43-47].
Determination of α and θ can be performed via a single series of chronoamperometric experiments. The chronoamperometric response of a disk electrode modified with a polymer layer is theoretically described by the solution of a transient diffusion problem for the potential step response of a disk electrode in a semi-infinite medium [48-50] until the growing diffusion layer reaches the polymer/electrolyte interface. Therefore, chronoamperometric methods for determining diffusion coefficients [51] can be modified to obtain α and θ, as described in the Supporting Information.
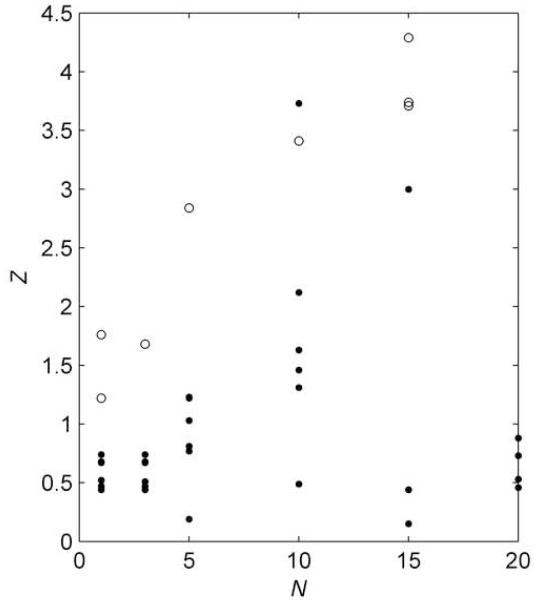
The procedure described in the Experimental Methods section and the Supporting Information was used to obtain and . Electrochemically determined Z are plotted in Fig. 2 for experiments performed with different numbers of deposition cycles, N. For several of the modified electrodes the polymer deposit radius was also determined visually using a microscope. The radii were converted into equivalent Z under the assumption of an oblate hemispheroid shape, and are plotted in Fig. 2 for comparison with the electrochemically determined Z. The following observations can be made: the scatter in deposit size is considerable, and increases with average deposit size; the average deposit size is maximum for N = 15; for N < 5 the deposit size and its variation are relatively small, with Z = 0.59 ± 0.13; for N = 5 the deposit size is given by Z = 0.88 ± 0.39; and, the visual measurements tend to give larger values than the electrochemical measurements. Some of the variability in the deposit sizes may be due to the delicacy of the polymer matrix. Also, the difference between the visual and electrochemical measurements suggests that the oblate hemispheroid may not perfectly match the actual deposit shape: the true shape may be more pancaked.
Fig. 2.
Characterization of polymer deposits using chronoamperometric measurements. Currents were obtained with an electrode immersed in a solution containing 30 mM [Fe(CN)6]4− in 0.5 M KCl supporting electrolyte. A potential step of 600 mV vs SCE was applied to the 25 μm diameter platinum electrode following N deposition cycles. The transient data were used to determine α and θ, and the steady state current yielded Z (filled circles). The open circles are visual measurements of deposit size.
5.2. Enzyme Activity Calibration
In a companion paper [13] a procedure was presented for predicting electrode current assuming known enzyme activity parameters such as CT and . In fact, enzyme activities within the polymer are unknown, but can theoretically be determined using the results of calibration. This determination is an inverse of the previously described process: the current is known (measured) and the enzyme activity parameters are determined.
The first step in the calibration procedure is to apply the model as if the unknown parameters were known. The analytical model is applicable in two limiting cases, described by either the uniform homogeneous reaction approximation or the heterogeneous reaction approximation. These approximations are valid for the limiting cases of widely disparate length scales [13] and selected by considering the ratios of the relevant length scales. When the ratios of the length scale over which species concentration changes due to enzymatic action in the polymer to the length scale for molecular transport in the polymer, determined for all species other than the electroactive species R, are small, the limiting reactant for the relevant reaction will be entirely consumed close to the polymer/electrolyte interface and an approximation of total consumption of the limiting reactant on the polymer surface is applied. We call this approximation the heterogeneous reaction approximation. In contrast, if these length scale ratios are large (much greater than unity) there will be little variation in concentrations of the non-electroactive species, and therefore little variation in the magnitude of source terms within the polymer. Thus the source terms can be approximated as uniform throughout the polymer domain. We call this approximation the uniform homogeneous reaction approximation. More details are available in the companion paper [13].
In the application of the model for calibration in the absence of known enzyme activities, it is not always possible to choose the appropriate approximation beforehand. In some cases, enough information about enzyme activity may be known to limit consideration to one approximation. Otherwise, the current prediction procedure must be performed using both approximations, and then calibration results will indicate which is correct.
5.2.1. GOX Based Glucose Sensor
The goal of this part of the calibration procedure is to determine the concentration of active enzyme sites for entrapped GOX, CT. The first step in the analytical procedure is determining if either the uniform homogeneous reaction approximation or the heterogeneous reaction approximation can be used. This determination is accomplished for each species and reaction combination, by calculation of parameters which are ratios of two length scales: that of species concentration variation due molecular diffusion in the polymer, and that of species concentration variation due to the enzyme catalyzed reaction in the polymer [13]. With one enzyme catalyzed (GOX) reaction and two species with nonzero bulk concentrations, O2 and glucose, calculation of two length scale parameters is required [13]:
| (9) |
and
| (10) |
Assuming that the electrolyte is saturated with oxygen under normal atmospheric conditions, C∞,O2 = 0.26 mol m−3 [52]. Then, using Tables I, II, and III, it is apparent that evaluation of Eqs. (9) and (10) requires the concentration of active enzyme sites, CT, which is the sought after quantity in the calibration. Although CT is not known, an upper bound on CT can be determined (see Supporting Information) and the maximum possible value of CT for the sensor data used to demonstrate calibration [9, 16] is 12.5×10⁻³ mol m−3. Using the limiting value for CT and the maximum glucose concentration in the calibration data [9], C∞,G = 1.5 mol m−3, Eqs. (9) and (10) yield ΛGOX,G ≤ 0.197 and ΛGOX,O2 ≤ 0.29, indicating applicability of the uniform homogeneous reaction approximation [13]. Using the theoretical details and examples provided in the companion paper, application of the uniform homogeneous reaction approximation proceeds as follows [13]:
- Uniform concentrations of glucose and oxygen in the polymer are found that satisfy global mass conservation by simultaneous solution of two nonlinear algebraic equations:
and(11)
In Eqs. (11) and (12), TC, TV and G are parameters that depend upon the polymer deposit size and transport properties [13]:(12) (13)
and(14) (15) The resulting concentrations of glucose and oxygen in the polymer, Cp,G and Cp,O2, respectively, are substituted into Eq. (4), yielding the value of the source term for the electroactive species, i.e., SH2O2.
- This source term for H2O2, SH2O2 is used to determine the equivalent redox species concentration, K, via
(16) The equivalent redox species concentration, K, is used to obtain the predicted electrode current I with Eq. (1).
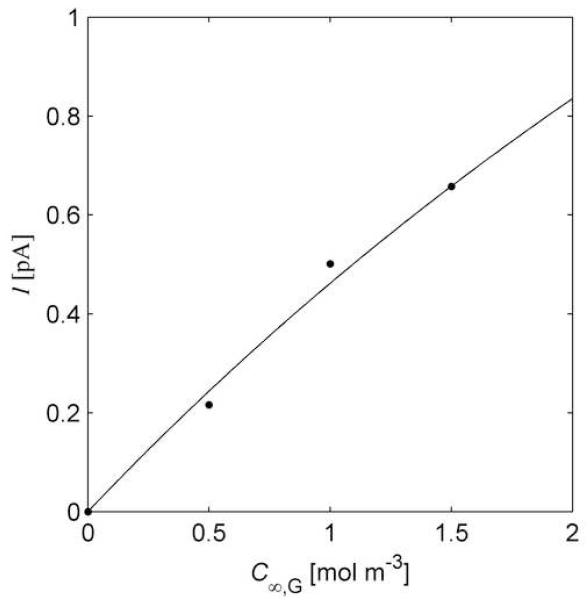
The calibration procedure therefore consists of finding the value of CT for which the predictions of electrode current obtained via steps (i)-(iv) best fit the calibration data. To exemplify this, previously published data for a 25 μm diameter electrode with GOX immobilized using 5 cycles of pulse deposition [9] is displayed in Fig. 3. Figure 3 also shows the theoretical curve for the best fit for CT, yielding CT = 6.09×10⁻⁵ mol m−3.
Fig. 3.
Steady state currents. Currents are obtained for a polymer entrapped glucose oxidase (GOX) electrode in a buffered glucose solution. The plotted points are experimental measurements.[9] The curve is obtained with the uniform homogeneous reaction approximation.
5.2.2. GOX/HEX Based ATP Sensor
The goal of this final step of the calibration procedure is to determine the maximum reaction velocity of the HEX catalyzed reaction, . As is the case for the GOX based glucose sensor, the first step for enzyme activity calibration of the GOX/HEX based ATP sensor is determining whether the enzyme catalyzed reactions can be modeled using homogeneous or heterogeneous approximation.
For the HEX catalyzed reaction there are two species with nonzero bulk concentrations, MgATP and glucose (G), and therefore two length scale parameter calculations are required [13]:
| (17) |
and
| (18) |
In Eqs. (17) and (18), the length scale parameters, ΛHEX,MgATP and ΛHEX,G, are functions of the unknown parameter, , and the bulk concentrations of glucose and ATP. All other parameters are obtained using the data presented in Tables I-III and the following assumptions:
Due to excess Mg2+, the bulk concentration of MgATP, C∞,MgATP, can be assumed to be the concentration of ATP that would be obtained without the presence of Mg2+. Note that the bulk concentrations of MgADP and G6P are zero for calibration;
The diffusion coefficients of MgATP and MgADP are the same as that for ATP, DMgATP = DMgADP = 3.6×10⁻¹⁰ m2s−1 [53]; and,
The diffusion coefficient of G6P is the same as that for glucose.
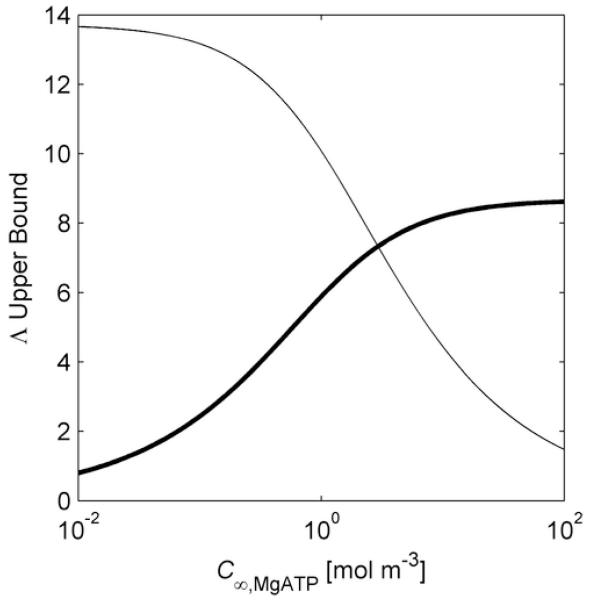
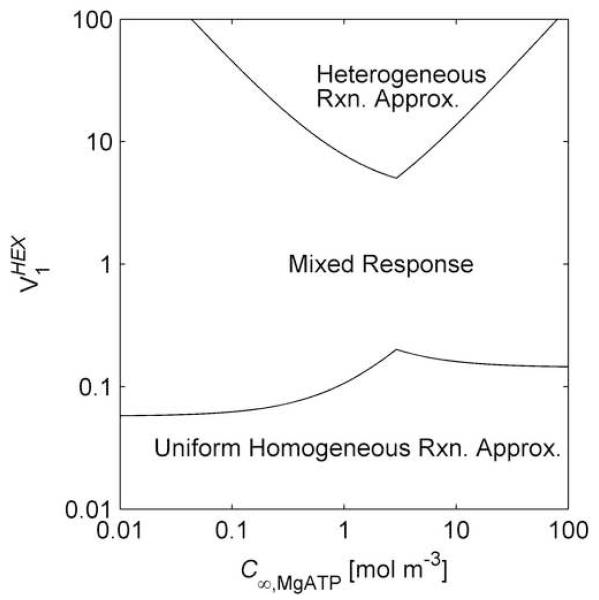
For the conditions from which the calibration data was obtained [9, 16], (See Supporting Information) and C∞,G = 1.5 mol m−3 [9, 16]. Using Eqs. (17) and (18), upper bounds for ΛHEX,MgATP and ΛHEX,G are plotted in Fig. 4 (top) as functions of C∞,MgATP. There is a C∞,MgATP above which the larger parameter is ΛHEX,G, and below which the larger parameter is ΛHEX,MgATP. Thus, for the limiting used to generate Fig. 4 (top), application of the criteria for the heterogeneous reaction approximation [13] indicates its validity for 0.17 mol m−3 < C∞,MgATP < 20 mol m−3.
Fig. 4.
Approximation Applicability. Top Upper bounds on the ratios of the length scale for concentration change due to diffusion to the length scale for concentration change due to homogeneous reaction, for MgATP and glucose (G), considering the hexokinase (HEX) catalyzed reaction. The curves are plots of Eqs. (17) and (18), (thin and thick lines, respectively) using a =12.5×10⁻⁶ m, θ = 0.89, α = 0.69, Z = 0.88, and C∞,G = 1.5 mol m−3 with the maximum hexokinase activity: . Bottom Regime map providing the regions of model approximation applicability for varying ATP concentration and hexokinase activity, for a = 12.5×10⁻⁶ m, θ = 0.89, α = 0.69, Z = 0.88, and C∞,G = 1.5 mol m−3.
By generating curves such as those in Fig. 4 (top) for a range of a regime map of the applicability of the homogeneous and heterogeneous approximations is generated. This regime map, Fig. 4 (bottom), can be used during calibration to check results for consistency. It shows that there is a critical , only above which the heterogeneous reaction approximation is valid, and then for a limited range of C∞,MgATP. Similarly there is a critical for the applicability of the uniform homogeneous reaction approximation, and only if is sufficiently small () the uniform homogeneous reaction approximation will apply for all C∞,MgATP.
Since it is generally not possible to know beforehand which approximation will be applicable, one must predict electrode current changes using both approximations for the HEX catalyzed reaction. In both cases, the resulting electrode current I is used to obtain a current difference, ΔI, which is indicative of ATP concentration:
| (19) |
The electrode current in the absence of ATP, I (C∞,ATP = 0) is obtained as for the glucose microbiosensor analysis. In other words, the first step of ATP sensor calibration is glucose sensor calibration: based on the previously published data [9, 16] I(C∞,ATP = 0) = 1.54 pA with C∞,G = 1.5 mol m−3, which implies a total concentration of active GOX sites, CT = 1.446×10⁻⁴ mol m−3.
5.2.2.1 Uniform Homogeneous Reaction Approximation for HEX Reaction
Assuming for the purposes of calculation that the uniform homogeneous reaction approximation is valid for the HEX reaction, both the GOX catalyzed reaction, Eq. (2), and the HEX catalyzed reaction, Eq. (5), are treated as occurring at uniform (although different) rates in the polymer. The methods described in the companion work are applied by following these steps [13]:
- Uniform concentrations for species G, O2, MgATP, MgADP, and G6P in the polymer are found that satisfy global mass conservation by simultaneous solution of five nonlinear algebraic equations:
(20) (21) (22) (23)
Equations (20)-(24) are supplemented by the source term definitions of Eqs. (4) and (7). The mass balance used to derive Eqs. (20)-(24) accounts for the production of molecular oxygen by the electrode reaction [13].(24) The resulting concentrations of glucose and oxygen in the polymer, Cp,G and Cp,O2, respectively, are substituted into Eq. (4), yielding the value of the source term for the electroactive species, SH2O2.
This source term for H2O2, SH2O2 is used to determine the equivalent redox species concentration, K, via Eq. (16).
The equivalent redox species concentration, K, is used to obtain the predicted electrode current I with Eq. (1).
5.2.2.2. Heterogeneous Reaction Approximation for HEX Reaction
Next we assume, instead, the validity of the heterogeneous reaction approximation for the HEX catalyzed reaction. The heterogeneous reaction approximation is used for the HEX reaction to obtain the species concentrations in the polymer of glucose and oxygen, Cp,G and Cp,O2 respectively, which are then used in the uniform homogeneous reaction model of the GOX catalyzed generation of H2O2. In order for the analysis to be valid, not only must the requirements on HEX activity described previously be met, but also the analyte, MgATP must be the limiting reactant for the HEX reaction [13], which requires
| (25) |
(see Supporting Information). Finally, the effects of product inhibition for the HEX reaction are neglected in the application of the heterogeneous reaction approximation.
Conceptually, the heterogeneous reaction model treats the HEX catalyzed reaction as one that consumes all ATP and a corresponding quantity of glucose at the polymer/electrolyte interface. The GOX catalyzed reaction occurs within the polymer at a uniform rate, and the concentrations of all reactant species in the polymer are uniform[13], yielding for glucose and oxygen
| (26) |
and
| (27) |
The source term SH2O2 appearing in Eqs. (26) and (27) is given by Eq. (4) with CG = Cp,G and CO2 = Cp,O2.
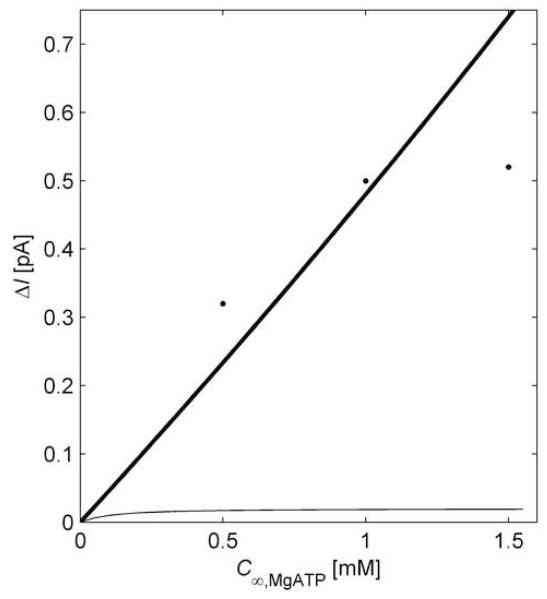
If it is determined that the heterogeneous reaction approximation is indeed valid for the HEX catalyzed reaction, then no further calibration is needed after the glucose sensor calibration has been completed. Figure 5 is a plot of predicted current changes due to changing ATP concentration in a solution containing a bulk glucose concentration of 1.5 mol m−3. The results are obtained by using the uniform homogeneous reaction approximation for the GOX catalyzed reaction with CT = 1.446×10⁻⁴ mol m−3 and either (i) the uniform homogeneous reaction approximation with , or (ii) the heterogeneous reaction approximation (which gives the maximum possible current response). The results are compared to the published data [9, 16] from which the input parameters for the model were derived. The comparison indicates that the response is consistent with that predicted using the heterogeneous reaction approximation. The calibration data can be used to estimate and thus quantify limits on the ATP concentration range for which the heterogeneous reaction approximation will be accurate. The results depicted in Fig. 4 (bottom) indicate that the heterogeneous reaction approximation loses accuracy for C∞,MgATP that are too large or too small, and this prediction is borne out by the data in Fig 5.: agreement is within 27% for C∞,MgATP = 0.5 mol m−3 and within 2% for C∞,MgATP = 1.0 mol m−3, but the theory over-predicts current by 42% for C∞,MgATP = 1.5 mol m−3. Considering these results in light of the regime map in Fig. 4 (bottom), the maximum reaction velocity is near the low end for validity of the heterogeneous reaction approximation, i.e.,
Fig. 5.
Current response of a miniaturized ATP biosensor. Comparison of experimental data [9, 16] (points) and theoretical prediction using the heterogeneous reaction approximation (thick line) and using the uniform homogeneous reaction approximation with (thin line).
The under-prediction of current for lower ATP concentrations, though not dramatic, is not negligible. One possible reason, discussed in the next section, is that at low ATP concentrations the electrode exhibits sensitivity to ATP due to effects fundamentally outside the applicability of the present theory.
5.2.2.3. Flow Injection Analysis
Co-immobilized glucose oxidase/ hexokinase microbiosensors have exhibited sensitivity to ATP concentrations that cannot be explained by the model presented in this work. In this section we present one example of such measurements.
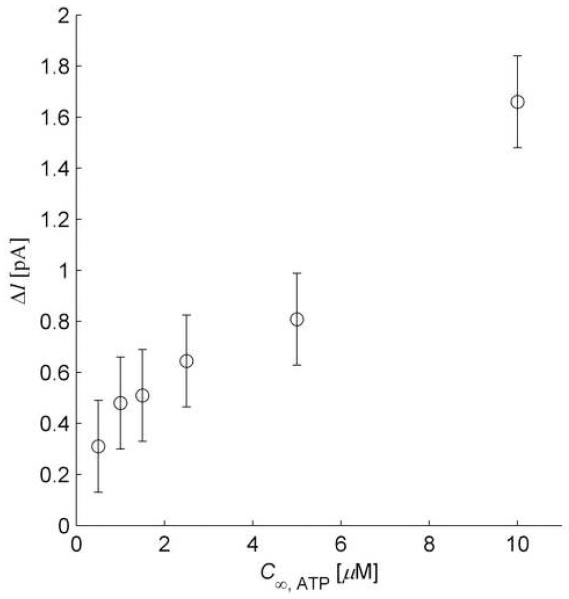
A microbiosensor (UME diameter=25 μm and N = 3 deposition cycles for enzyme entrapment) was calibrated with a bulk glucose concentration C∞,G = 5 mol m−3. The baseline current response due to glucose was 20 pA, yielding through the calibration procedure, CT = 12.5×10⁻⁴ mol m−3. The electrode response was obtained for ATP concentrations of 2.5, 5, and 10 μM, and results are plotted in Fig 6. For C∞,ATP = 10μ M=0.01 mol m−3, the maximum reduction in electrode current predicted by the heterogeneous reaction approximation is only 0.013 pA, a value two orders of magnitude smaller than observed.
Fig. 6.
Flow Injection Analysis Results. Low concentration (μM) response of ATP microbiosensor measured using flow injection analysis. The electrode was a 25 μm diameter platinum disk with glucose oxidase and hexokinase co-immobilized using three electrodeposition pulses.
6. Discussion
Important motivations for the development of a model description of enzyme based microbiosensors (and many other sensors as well) are the ability to rationally optimize sensor design as well as improved data interpretation. Additionally, because the model relies upon assumptions regarding the dominant physics governing sensor response, it can serve as a litmus test of the accuracy of accepted underlying sensor principles. If the model cannot account for observed behavior, than the assumptions upon which the model rests need to be reexamined.
6.1. Optimization and Data Interpretation
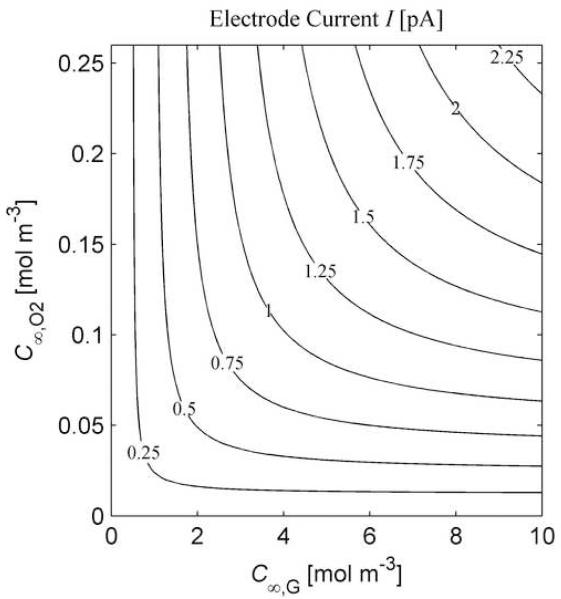
In the absence of a physics-based model, optimization is entirely empirical, and extrapolation of calibration results is unthinkable. With a physics-based model it is reasonable to vary geometric parameters and operational conditions, and then predict the result on electrode current. Furthermore, a physics-based model, using experimentally determined parameters obtained through calibration, can be expected to remain accurate beyond the limited range of conditions under which calibration was performed. For instance, in Fig 7. the results of an analysis on the sensitivity of the glucose microbiosensor to variations in dissolved oxygen content are presented. The plot in Fig 7. can be used to assess the relative sensitivity of the electrode to variations in oxygen content. In general, a line C∞,O2 = 0.025C∞,G marks a boundary between two regimes of electrode sensitivity. For combinations of concentrations below and to the right the boundary, the electrode is more sensitive to changes in oxygen concentration, while for combinations of concentrations above and to the left, the electrode is more sensitive to changes in glucose concentration. It is possible to perform a myriad of similar analyses, investigating, for example, the effect of varying deposit size (Z) and the impact of variations in enzyme activity.
Fig. 7.
Combined Glucose and Oxygen Effects. Effects of varying substrate concentrations on predicted electrode response, predicted using the uniform homogeneous reaction approximation. The parameters used are the same as those for Fig. 2. The plot can be used to assess the relative sensitivity of the electrode to variations in oxygen content.
6.2. Indicator of Incomplete Understanding
Flow injection analysis with a GOX/ HEX based ATP sensor showed anomalous sensitivity to low (μM) ATP concentrations which could not be explained by our theory. The response was, in fact, several orders of magnitude greater than theoretically possible. Experimental errors and/or failures of the model may contribute to this discrepancy between data and prediction. Assuming that the error is not in the experimental data since similar responses have been obtained for a large number of miniaturized ATP sensors [54], we hypothesize that the GOX/HEX ATP electrode response in some circumstances depends upon effects other than the competition for glucose by two different homogeneous reactions. It has been previously reported that the oxidation of H2O2 on platinum can be inhibited by species not involved in the overall reaction, either through interaction of the interfering species with binding sites on the platinum surface [55], or through other mechanisms [56]. The FIA results therefore may be due to coupling of the HEX catalyzed reaction to a reversible inhibition mechanism.
7. Conclusion
We have applied a first-principles theoretical model [13] to analyze the steady-state amperometric response of entrapped enzyme ultramicroelectrodes. Comparison between model results and experiments validate the theoretical approach, and demonstrate the manner in which UME calibration becomes a measurement of transport properties and enzyme kinetics parameters. Because the results of the calibration procedure are quantities with specific meanings in a physics-based electrode model, the resulting description can be used to predict changes in electrode response as experimental conditions or electrode parameters are altered, leading to targeted optimization efforts and improved data interpretation.
We have demonstrated that the model successfully predicts the performance of both glucose (GOX) and ATP (GOX/HEX) microbiosensors. Following calibration, the model can be used to explore the sensor response to a variety of conditions. In particular, the sensitivity to ATP as a function of C∞,G, C∞,O2, and Z is of interest for sensor optimization. Similarly, the analytical model can be used to obtain the best relative enzyme activities and polymer deposit size given anticipated environmental conditions in terms of glucose and oxygen concentration.
Supplementary Material
Acknowledgement
This research was supported by the NIH grant RO1 EB000508-01A1.
Footnotes
Publisher's Disclaimer: This is a PDF file of an unedited manuscript that has been accepted for publication. As a service to our customers we are providing this early version of the manuscript. The manuscript will undergo copyediting, typesetting, and review of the resulting proof before it is published in its final citable form. Please note that during the production process errors may be discovered which could affect the content, and all legal disclaimers that apply to the journal pertain.
References
- [1].Wightman RM. Science. 2006;311:1570. doi: 10.1126/science.1120027. [DOI] [PubMed] [Google Scholar]
- [2].Gyurcsányi RE, Jágerszki G, Kiss G, Tóth K. Bioelectrochemistry. 2004;63:207. doi: 10.1016/j.bioelechem.2003.12.011. [DOI] [PubMed] [Google Scholar]
- [3].Dale N, Hatz S, Tian F, Llaudet E. Trends in Biotechnology. 2005;23:420. doi: 10.1016/j.tibtech.2005.05.010. [DOI] [PubMed] [Google Scholar]
- [4].Bard AJ, Li X, Zhan W. Biosensors & Bioelectronics. 2006;22:461. doi: 10.1016/j.bios.2006.04.028. [DOI] [PubMed] [Google Scholar]
- [5].Yasukawa T, Kaya T, Matsue T. Electroanalysis. 2000;12:653. [Google Scholar]
- [6].Guilbault GG, Lubrano GJ. Analytica Chimica Acta. 1973;64:439. doi: 10.1016/S0003-2670(01)82476-4. [DOI] [PubMed] [Google Scholar]
- [7].Scheller FK, Kirstein L, Schubert F, Wollenberger U, Olsson B, Gorton L, Johansson G, Albery WJ, Scheller F, Thomas JDR. Philosophical Transactions of the Royal Society of London. (Series B).Biological Sciences. 1987;316:85. doi: 10.1098/rstb.1987.0019. [DOI] [PubMed] [Google Scholar]
- [8].Mueller A. Mini-Reviews in Medicinal Chemistry. 2005;5:231. doi: 10.2174/1389557053175326. [DOI] [PubMed] [Google Scholar]
- [9].Kueng A, Kranz C, Mizaikoff B. Biosensors and Bioelectronics. 2004;19:1301. doi: 10.1016/j.bios.2003.11.023. [DOI] [PubMed] [Google Scholar]
- [10].Limoges B, Marchal D, Mavre F, Savéant JM. J. Am. Chem. Soc. 2006;128:6014. doi: 10.1021/ja060801n. [DOI] [PubMed] [Google Scholar]
- [11].Kurzawa C, Hengstenberg A, Schuhmann W. Analytical Chemistry. 2002;74:355. doi: 10.1021/ac010830a. [DOI] [PubMed] [Google Scholar]
- [12].Ngounou B, Neugebauer S, Frodl A, Reiter S, Schuhmann W. Electrochimica Acta. 2004;49:3855. [Google Scholar]
- [13].Kottke PA, Kranz C, Kwon YK, Masson J-F, Mizaikoff B, Fedorov AG. Journal of Electroanalytical Chemistry. 2008;612:208. doi: 10.1016/j.jelechem.2007.09.031. [DOI] [PMC free article] [PubMed] [Google Scholar]
- [14].Bakker E, Qin Y. Analytical Chemistry. 2006;78:3965. doi: 10.1021/ac060637m. [DOI] [PMC free article] [PubMed] [Google Scholar]
- [15].Kwak J, Bard AJ. Analytical Chemistry. 1989;51:1221. [Google Scholar]
- [16].Kueng A, Kranz C, Mizaikoff B. Biosensors and Bioelectronics. 2007 in press. [Google Scholar]
- [17].Schuhmann W, Kranz C, Wohlschlaeger H, Strohmeier J. Biosensors & Bioelectronics. 1997;12:1157. doi: 10.1016/s0956-5663(97)00086-9. [DOI] [PubMed] [Google Scholar]
- [18].Masson J-F, Kranz C, Booksh KS, Mizaikoff B. Biosensors & Bioelectronics. 2006 doi: 10.1016/j.bios.2007.04.013. Submitted. [DOI] [PubMed] [Google Scholar]
- [19].Kueng A, Kranz C, Lugstein A, Bertagnolli E, Mizaikoff B. Angewandte Chemie International Edition. 2005;44:3419. doi: 10.1002/anie.200461556. [DOI] [PubMed] [Google Scholar]
- [20].Kueng A, Kranz C, Mizaikoff B. Biosensors and Bioelectronics. 2005;21:346. doi: 10.1016/j.bios.2004.10.020. [DOI] [PubMed] [Google Scholar]
- [21].Scheller F, Pfeiffer D. Analytica Chimica Acta. 1980;117:383. [Google Scholar]
- [22].Gibson QH, Swoboda BEP, Massey V. The Journal of Biological Chemistry. 1964;239:3927. [PubMed] [Google Scholar]
- [23].Hall SB, Khudaisha EA, Hart AL. Electrochimica Acta. 1998;32:468. [Google Scholar]
- [24].Hinberg I, Kapoulas A, Korus R, Odriscol K. Biotechnology and Bioengineering. 1974;16:159. doi: 10.1002/bit.260160202. [DOI] [PubMed] [Google Scholar]
- [25].Bright HJ, Appleby M. The Journal of Biological Chemistry. 1969;244:3625. [PubMed] [Google Scholar]
- [26].Parker JW, Schwartz CS. Biotechnology and Bioengineering. 1987;30:724. doi: 10.1002/bit.260300605. [DOI] [PubMed] [Google Scholar]
- [27].Hammes GG, Kochavi D. Journal of the American Chemical Society. 1962;84:2073. [Google Scholar]
- [28].Hammes GG, Kochavi D. Journal of the American Chemical Society. 1962;84:2076. [Google Scholar]
- [29].Zewe V, Fromm HJ, Fabiano R. Journal of Biological Chemistry. 1964;239:1625. [PubMed] [Google Scholar]
- [30].Fromm HJ, Zewe V. Journal of Biological Chemistry. 1962;237:3027. [PubMed] [Google Scholar]
- [31].Rudolph FB, Fromm HJ. Journal of Biological Chemistry. 1971;246:6611. [PubMed] [Google Scholar]
- [32].Kosow DP, Rose IA. Journal of Biological Chemistry. 1970;245:198. [PubMed] [Google Scholar]
- [33].Viola RE, Morrison JF, Cleland WW. Biochemistry. 1980;19:3131. doi: 10.1021/bi00555a003. [DOI] [PubMed] [Google Scholar]
- [34].Viola RE, Raushel FM, Rendina AR, Cleland WW. Biochemistry. 1982;21:1295. doi: 10.1021/bi00535a029. [DOI] [PubMed] [Google Scholar]
- [35].Colowick SP. In: Group Transfer Part B. Boyer PD, editor. Vol. IX. Academic Press, Inc.; New York, NY: 1973. [Google Scholar]
- [36].Garfinkel L, Garfinkel D, Matsiras P, Matschinsky B. Biochemical Journal. 1987;244:351. doi: 10.1042/bj2440351. [DOI] [PMC free article] [PubMed] [Google Scholar]
- [37].Corkey BE, Duszynski J, Rich TL, Matschinsky B, Williamson JR. J. Biol. Chem. 1986;261:2567. [PubMed] [Google Scholar]
- [38].Compagnone D, Guilbault GG. Analytica Chimica Acta. 1997;340:109. [Google Scholar]
- [39].Hammes GG, Kochavi D. Journal Of The American Chemical Society. 1962;84:2069. [Google Scholar]
- [40].Llaudet E, Hatz S, Droniou M, Dale N. Analytical Chemistry. 2005;77:3267. doi: 10.1021/ac048106q. [DOI] [PubMed] [Google Scholar]
- [41].Leskovac V. Comprehensive Enzyme Kinetics. Kluwer Academic/Plenum Pub.; New York: 2003. [Google Scholar]
- [42].King EL, Altman C. Journal of Physical Chemistry. 1956;60:1375. [Google Scholar]
- [43].Van Stroe-Biezen SAM, Everaerts FM, Janssen LJJ, Tacken RA. Analytica Chimica Acta. 1993;273:553. [Google Scholar]
- [44].Matsuyama H, Teramoto M, Urano H. Journal of Membrane Science. 1997;126:151. [Google Scholar]
- [45].Brown W, Chitumbo K. Journal of the Chemical Society-Faraday Transactions I. 1975;71:1. [Google Scholar]
- [46].Brown W, Chitumbo K. Journal of the Chemical Society-Faraday Transactions I. 1975;71:12. [Google Scholar]
- [47].Brown W, Kloow G, Chitumbo K, Amu T. Journal of the Chemical Society-Faraday Transactions I. 1976;72:485. [Google Scholar]
- [48].Aoki K, Osteryoung J. Journal of Electroanalytical Chemistry. 1981;122:19. [Google Scholar]
- [49].Shoup D, Szabo A. Journal of Electroanalytical Chemistry. 1982;140:237. [Google Scholar]
- [50].Aoki K, Osteryoung J. Journal of Electroanalytical Chemistry. 1984;160:335. [Google Scholar]
- [51].Winlove CP, Parker KH, Oxenham RKC. Journal of Electroanalytical Chemistry. 1984;170:293. [Google Scholar]
- [52].Perry JH, editor. Chemical Engineers’ Handbook, Prepared by a Staff of Specialists. McGraw-Hill; New York: 1950. [Google Scholar]
- [53].Hubley MJ, Locke BR, Moerland TS. Biochimica Et Biophysica Acta-General Subjects. 1996;1291:115. doi: 10.1016/0304-4165(96)00053-0. [DOI] [PubMed] [Google Scholar]
- [54].Masson J-F, Kranz C, Gauda E, Mizaikoff B. 2007. Manuscript in preparation.
- [55].Hall SB, Khudaisha EA, Hart AL. Electrochimica Acta. 1999;44:4573. [Google Scholar]
- [56].Hall SB, Khudaisha EA, Hart AL. Electrochimica Acta. 2000;45:3573. [Google Scholar]
Associated Data
This section collects any data citations, data availability statements, or supplementary materials included in this article.


