Abstract
The calcium-sensing receptor (CaR) elicits oscillatory Ca2+i mobilization associated with dynamic, inhibitory protein kinase C-mediated phosphorylation of CaRT888. While modest CaR stimulation elicits Ca2+i oscillations, greater stimulation either increases oscillation frequency or elicits sustained responses by an unknown mechanism. Here, moderate CaR stimulation (2.5 mm Ca2+o, 10 min) increased CaRT888 phosphorylation (160-kDa mature receptor) 5-fold in CaR stably transfected HEK-293 cells, whereas 3–5 mm Ca2+o treatments were without apparent effect. Treatment with 2 mm Ca2+o caused sustained CaRT888 phosphorylation (≥20 min) and oscillatory Ca2+i mobilization. However, 5 mm Ca2+o increased CaRT888 phosphorylation only briefly while eliciting sustained Ca2+i mobilization, suggesting that greater CaR activation induces rapid CaRT888 dephosphorylation, thus permitting sustained Ca2+i responses. Indeed, 5 mm Ca2+o stimulated protein phosphatase 2A activity and induced CaRT888 dephosphorylation following acute phorbol ester pretreatment, the latter effect being mimicked by CaR-positive allosteric modulators (NPS-R467 and l-Phe). Finally, the phosphatase inhibitor calyculin-A reversed CaR-induced inhibition of parathyroid hormone secretion from bovine parathyroid slices and normal human parathyroid cells, demonstrating the physiological importance of phosphorylation status on parathyroid function. Therefore, high Ca2+o-stimulated protein kinase C acts in concert with high Ca2+o-induced phosphatase activity to generate and maintain CaR-induced Ca2+i oscillations via the dynamic phosphorylation and dephosphorylation of CaRT888.
Keywords: Calcium/Intracellular Release, G Proteins/Coupled Receptors (GPCR), Receptors/Phosphatases, Signal Transduction/Calcium, Signal Transduction/Phorbol Esters, Signal Transduction/Phosphoprotein Phosphatases, Signal Transduction/Phosphoprotein Phosphatases/PP1/PP2A
Introduction
The calcium-sensing receptor (CaR)3 regulates parathyroid hormone secretion (PTH) and renal Ca2+ reabsorption and is thus crucial to the control of extracellular Ca2+ (Ca2+o) homeostasis (1, 2). The parathyroid CaR acts in response to increasing Ca2+o concentration by mobilizing Ca2+i release and other intracellular signals to suppress PTH production and release. These effects can be reversed in dispersed bovine parathyroid cells by modulation of protein kinase C (PKC) activity (3–10).
Of the five predicted PKC consensus sites in human CaR (11), mutation of the intracellular domain residue Thr-888 elicits the greatest effect on the Ca2+o sensitivity of PI-PLC (12). Phosphomimetic substitution of this site (CaRT888D) lowers the Ca2+o sensitivity of the receptor (13) while nonphosphorylatable CaRT888A is more sensitive to Ca2+o and promotes sustained rather than oscillatory Ca2+i mobilization (14, 15). This is the basis for the hypothesis that dynamic CaRT888 phosphorylation is required for oscillatory Ca2+i mobilization, an effect that had been proposed previously for other class C G protein-coupled receptors (16–18).
However, two unresolved issues require attention. One concerns the nature of CaRT888 dephosphorylation and whether receptor activation can modulate phosphatase activity. The second relates to the observation that at maximal or near maximal levels of CaR activity, PKC-mediated inhibition is overcome to elicit sustained elevations in Ca2+i. Here, we show that heightened CaR activation accelerates CaRT888 dephosphorylation and provide evidence that the rate of dephosphorylation may set the frequency of CaR-induced Ca2+i oscillations. Thus, we propose that both high Ca2+o-induced PKC and high Ca2+o-induced phosphatase activities, acting in concert, are required to produce the cycles of CaRT888 phosphorylation/dephosphorylation necessary to mediate CaR-induced Ca2+i oscillations.
EXPERIMENTAL PROCEDURES
Materials
Fura-2/AM was from Molecular Probes, Inc. (Invitrogen). Horseradish peroxidase-conjugated anti-mouse and anti-rabbit secondary antibodies were from Dako (Ely, Cambridgeshire, UK). Unless stated otherwise, all other chemicals were purchased from Sigma-Aldrich (Poole, Dorset, UK).
Cell Culture
HEK-293 cells, stably transfected with human parathyroid CaR (11), were a gift from Dr. E. F. Nemeth (NPS Pharmaceuticals). Cells were grown in Dulbecco's modified Eagle's medium supplemented with 10% heat-inactivated fetal bovine serum (Invitrogen) and 200 μg/ml hygromycin B (Boehringer-Mannheim, Lewes, Sussex, UK).
CaR Phosphorylation Assays
Cells were grown to 80–90% confluence in 35 mm culture dishes, and CaRT888 phosphorylation was assayed as described previously (15) using experimental buffer (20 mm HEPES (pH 7.4), 125 mm NaCl, 4 mm KCl, 0.5 mm CaCl2, 0.5 mm MgCl2, and 5.5 mm glucose. Experiments were performed at 37 °C prior to lysis on ice in radioimmune precipitation assay buffer supplemented with 1 mm N-ethylmaleimide and with protease and phosphatase inhibitors described previously (15).
Immunoblotting
CaRT888 phosphorylation was then quantified by semi-quantitative immunoblotting as described previously (15, 19), using an affinity-purified phospho-specific anti-CaRpT888 antibody (15). Anti-CaR mouse monoclonal antibody, raised to amino acids 214–235 (ADD) of the extracellular domain of the human parathyroid CaR was from Affinity Bioreagents (Golden, CO).
Intracellular Ca2+ Assay
Relative changes in intracellular Ca2+ concentration were assayed in CaR-HEK cells grown on glass coverslips as described previously (15, 20). Briefly, cells were loaded with 1 μm Fura-2/AM in the dark in experimental buffer supplemented with 0.1% bovine serum albumin. Cells were then equilibrated and assayed at room temperature in experimental buffer containing the baseline [Ca2+]o appropriate for the ensuing experiment (0.5 mm unless otherwise stated).
Protein Phosphatase 2A (PP2A) Assay
PP2A activity was assayed using a kit (DuoSet® IC human active PP2A) from R&D Systems (Abingdon, UK) according to the manufacturer's instructions. Briefly, following experimental treatment and lysis, cellular PP2A was bound to the well of a 96-well plate and assayed for its ability to release phosphate from a PP2A-specific substrate.
Bovine PTH Secretion Assay
Bovine superior parathyroid glands were dissected from freshly killed cattle (<30 months old), and excess fatty tissue was removed. Three slices (∼1 mm) were then made in cross-section and placed in the 0.5 mm CaCl2 experimental buffer supplemented with 1 mg/ml bovine serum albumin at 37 °C for 1 h. A base layer of BioGel P4 (∼1 ml) was used to pack a polyprep column attached to a constant perfusion pump and set up in a water bath at 37 °C (21). The three preincubated slices were transferred to the column and packed with Sephadex beads (∼1 ml), and the mixture perifused with experimental buffer at a rate of 1.5 ml/min. for a 20-min equilibration period. During the experimental period, cumulative samples were collected constantly over 4-min periods on ice. The PTH-containing samples were quickly frozen in cryotubes at −80 °C to minimize hormone breakdown. Analysis of the hormone levels in the samples was carried out using the Immutopics bovine intact PTH enzyme-linked immunosorbent assay kit (Immunodiagnostic Systems Limited, Boldon, Tyne & Wear, UK) according to the manufacturer's instructions.
Preparation of Bovine Parathyroid Particulate Fraction
Following treatment with calyculin A (100 nm) and phorbol 12-myristate 13-acetate (PMA) (1 μm) in the experimental buffer described above, parathyroid glands were homogenized in a HEPES buffer (12 mm HEPES (pH 7.6) and 300 mm mannitol) supplemented with 1 mm N-ethylmaleimide and protease and phosphatase inhibitors (15). The homogenate was then centrifuged at 2,500 × g (15 min) with the postnuclear supernatant then centrifuged at 100,000 × g (30 min) to give a particulate protein pellet. Samples were normalized for protein content by assaying according to the method of Bradford (22). The protein equivalency of the subsequent sample loading volumes was demonstrated by temporary staining of blots with Ponceau S and confirmed by immunoblotting with total CaR antibody (ADD).
Human Parathyroid Cell Preparation
Samples from normal parathyroid cell transplants were obtained at neck surgery at the Royal North Shore Hospital and North Shore Private Hospital (St. Leonards, New South Wales, Australia) and the Mater Misericordiae Hospital (North Sydney, New South Wales, Australia). Excess normal parathyroid tissue (∼5% of the total), typically taking the form of single 1–1.5 mm diameter “chips,” was obtained from parathyroid autotransplants during thyroid surgery as described previously (21). All procedures were performed under guidelines established by the relevant institutional ethics committees, and all patients provided written informed consent for the use of the tissue for experimental purposes.
The method for the preparation of normal human parathyroid cells has been described recently (23). In brief, parathyroid tissue stored overnight in minimum essential medium at 4 °C was digested for 20 min in minimum essential medium containing 1 mg/ml collagenase and 0.1 mg/ml DNase I at 37 °C with brief oxygenation. The tissue was triturated by repeated passage through the tip of a 5-ml syringe, filtered (200 μm pore size nylon filter), sedimented (70 g, 2.5 min), washed (2 × 5 ml of bovine serum albumin-containing minimum essential medium), and finally resuspended in 2 ml bovine serum albumin-containing minimum essential medium. The remaining undigested tissues were returned to medium containing collagenase and DNase I and incubated for a further 20 min at 37 °C followed by trituration and centrifugal isolation as above.
Determination of PTH Secretion from Perifused Human Parathyroid Cells
The method for the determination of PTH secretion from normal human parathyroid cells has also been described recently (23) and is similar to the method described above for bovine cells. Briefly, cells were perifused in 4–5-kDa cut-off gel filtration micro beads with PTH appearing in the void volume. Gel filtration media were pre-equilibrated with physiological saline (125 mm NaCl, 4.0 mm KCl, 1.25 mm CaCl2, 1.0 mm MgCl2, 0.8 mm Na2HPO4, 20 mm HEPES (NaOH) (pH 7.4) supplemented with 0.1% d-glucose, 1× basal amino acid mixture (total concentration 2.8 mm) as defined previously (23) and 1 mg/ml bovine serum albumin. 4–10 × 104 cells were loaded onto a 0.4-ml bed volume of Bio-gel P-4 in a small perifusion column, gently covered with 0.4 ml bead volume of Sephadex G-25 and perifused (1.5 ml/min) at 37 °C with the physiological saline solution described above in various concentrations of Ca2+o in the absence or presence of the PP2A inhibitor calyculin A as required. 2-min (3 ml) samples were collected on ice, transferred to dry ice prior to storage at −80 °C, and then analyzed for intact human PTH (1–84) using a third generation, two-site chemiluminescence assay on an Immulite 2000 autoanalyzer.
Statistical Analysis
Data are presented as means ± S.E., and statistical significance was determined by one-way or repeated measures ANOVA or Friedman with appropriate post test, or by unpaired t test, using GraphPad Prism.
RESULTS
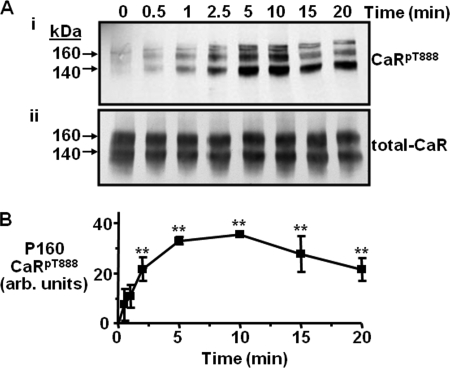
Acute treatment of CaR-HEK cells with the phorbol ester PMA (1 μm) increased the immunoreactivity of two protein bands of approximate molecular mass 140 and 160 kDa obtained by immunoblotting using the custom-generated phospho-specific polyclonal antibody raised against CaR residue Thr-888 (anti-pCaRT888) (Fig. 1), as shown previously (15). In the current experiments, cells were incubated in PMA (1 μm) for various times up to 20 min resulting in a significant, time-dependent change in the levels of CaRT888 phosphorylation (Fig. 1). The anti-CaRpT888 immunoreactivity of the 160 kDa mature protein increased significantly by 2 min (p < 0.05), reaching a peak by 10 min (p < 0.001) and declined from 15–20 min (Fig. 1). Similar changes in the phosphorylation of the 140 kDa core glycosylated CaR protein were observed (see supplemental Fig. S1). In response to acute PMA treatment, the level of total CaR was unchanged as demonstrated by immunoblotting with the monoclonal CaR antibody ADD (Fig. 1). Therefore, despite the continued presence of PMA, the induction of CaRT888 phosphorylation was not sustained beyond 10 min.
FIGURE 1.
Phosphorylation of the CaRT888 residue by PMA in CaR-HEK cells. A, representative immunoblots showing CaRpT888 (i) and total CaR (ii) immunoreactivity following treatment with 0.5 mm Ca2+o and 1 μm PMA for different lengths of time up to 20 min. B, quantification showing the mean changes in CaRpT888 expressed in arbitrary (arb.) units (n = 4). **, p < 0.01 versus control by repeated measures ANOVA (Dunnett's post test).
Concentration Dependence of Ca2+o Effect on CaRT888 Phosphorylation
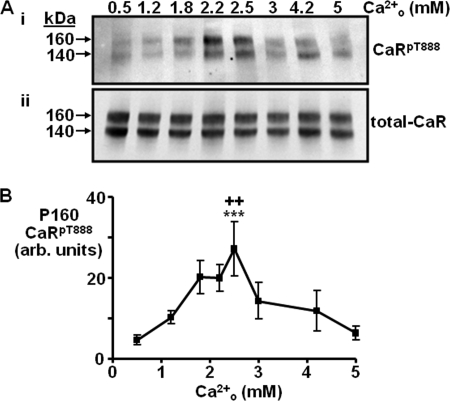
CaR-HEK cells were next exposed to various concentrations of Ca2+o (0.5–5 mm) for 10 min, and the resulting level of CaRT888 phosphorylation was quantified using the anti-CaRpT888 antibody. As the Ca2+o concentration increased from 0.5 to 2.5 mm, CaRT888 phosphorylation also increased, reaching a maximum at 2.5 mm (p < 0.001; Fig. 2). As the Ca2+o concentration increased between 2.5–5 mm however, CaRT888 phosphorylation declined to reach baseline levels following 10 min of exposure to 5 mm Ca2+o (Fig. 2; see supplemental Fig. S2 for replicates). In consequence, there was a biphasic concentration response relationship between Ca2+o and 160-kDa protein CaRT888 phosphorylation. In contrast, the amount of 140 kDa, core-glycosylated CaR phosphorylated on Thr-888 increased from 0.5 to ∼2 mm Ca2+o and remained at that level from 2–5 mm Ca2+o (supplemental Fig. S3). Total CaR abundance was not affected by the acute Ca2+o treatments as confirmed by Western blotting using total CaR antibody (Fig. 2).
FIGURE 2.
Effect of Ca2+o concentration on CaRT888 phosphorylation in CaR-HEK cells. A, representative Western blot showing CaRpT888 (i) and total CaR immunoreactivity (ii) following treatment for 10 min with different concentrations of Ca2+o up to 5 mm. B, quantification of the changes in CaRT888 phosphorylation expressed in arbitrary (arb.) units for the 160-kDa protein (n = 7). ***, p < 0.001 versus 0.5 mm Ca2+o. ++, p < 0.01 versus 5 mm Ca2+o by repeated measures ANOVA (Tukey post test).
Ca2+o-induced CaRT888 Phosphorylation as a Function of Time
Although it is possible that Ca2+o-induced P160 CaRT888 phosphorylation is paradoxically inhibited at higher Ca2+o concentrations, an alternative explanation for the biphasic concentration-effect relationship (Fig. 2) is that disproportionate dephosphorylation occurs at Ca2+o concentrations >2.5 mm. That is, above 2.5 mm Ca2+o, phosphatase activity is increased with respect to PKC activity such that CaRT888 phosphorylation levels return to baseline sooner, i.e. by ∼10 min. To test this possibility, cells were incubated at various times up to 20 min in the presence of either 2 mm Ca2+o, i.e. close to the concentration that gave the greatest apparent phosphorylation of the 160-kDa band, or, 5 mm Ca2+o, the concentration that appeared to have no effect at the time point tested in Fig. 2.
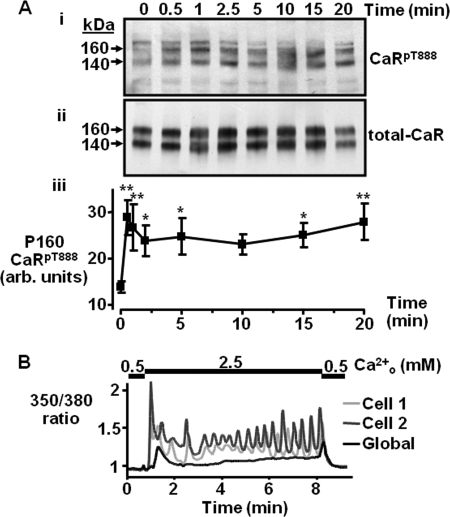
Treatment of CaR-HEK cells with 2 mm Ca2+o caused a rapid increase in 160 kDa CaRT888 phosphorylation, reaching significance after only 30 s of exposure (p < 0.01; Fig. 3A). This level of phosphorylation of the 160-kDa band was largely maintained throughout the time course with the band still being significantly more phosphorylated than control after 20 min (p < 0.05). Phosphorylation of the 140 kDa band exhibited a similar time-course (supplemental Fig. S4A). Total CaR abundance remained constant at each time point tested (Fig. 3A). Therefore, 2 mm Ca2+o elicited rapid and sustained CaRT888 phosphorylation in CaR-HEK cells. Using the ratiometric fluorescent dye Fura-2, an increase in Ca2+o from 0.5 mm baseline to 2.5 mm was shown to elicit a rapid increase in Ca2+i levels in the form of oscillations (Fig. 3B, see also supplemental Fig. 5).
FIGURE 3.
Impacts of a moderate Ca2+o concentration on time-dependent CaRT888 phosphorylation and Ca2+i mobilization. A, representative Western blot showing CaRpT888 (i) and total CaR immunoreactivity (ii) following treatment with 2 mm Ca2+o for increasing times up to 20 min. Quantification of the changes in CaRT888 phosphorylation expressed in arbitrary (arb.) units for the 160-kDa CaR band is shown in panel iii (n = 11). *, p < 0.05, **, p < 0.01 versus t0 by repeated measures ANOVA (Dunnett's post test). B, representative trace showing Ca2+i changes (Fura-2 ratio) in two single cells (light and dark gray lines) or a “global” cluster of cells (black) in response to 2.5 mm Ca2+o (n = 3).
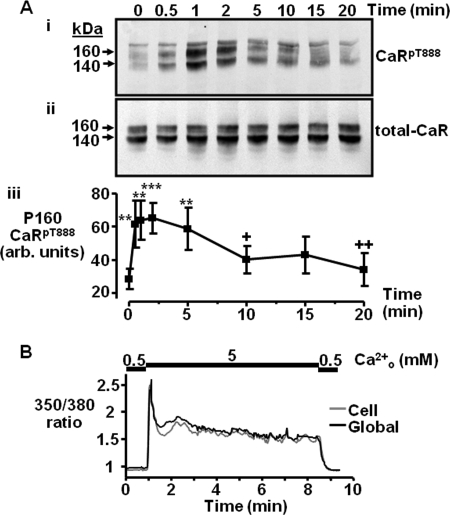
In contrast, exposure of the cells to 5 mm Ca2+o for various time points up to 20 min revealed a different time-course of response for CaRT888 phosphorylation (Fig. 4A). Initially, exposure of the cells to 5 mm Ca2+o resulted in a rapid increase in 160 kDa CaRT888 phosphorylation, with significance achieved after only 30 s (p < 0.01). The response peaked by 2 min (p < 0.001) but then declined until by 10 min, it was significantly lower than the maximal level of phosphorylation achieved (p < 0.05) and was indistinguishable from zero time control levels. The 140 kDa intracellular CaR exhibited a similar time-dependent increase in phosphorylation, being significantly different from baseline after 30 s (p < 0.01) and peaking by 2 min (p < 0.001), but unlike the 160-kDa band, it was still phosphorylated significantly even after 20 min (supplemental Fig. S4B). Again, the level of CaR abundance (total CaR) remained constant at each time point tested (Fig. 4A). It appears therefore that for the mature form of CaR, stimulation with Ca2+o induces rapid feedback phosphorylation of the receptor at all concentrations of Ca2+o up to 5 mm. However, stimulation with Ca2+o may also induce dephosphorylation of the CaR where the relative rates of phosphorylation/dephosphorylation are determined by the extent of CaR activation. In Fura2-loaded cells, 5 mm Ca2+o induced a rapid increase in Ca2+i levels, which was much larger than for the response to 2.5 mm Ca2+o (+469%, p < 0.05), and the individual cellular responses were largely sustained/non-oscillatory (Fig. 4B).
FIGURE 4.
Impacts of a maximally effective Ca2+o concentration on time-dependent CaRT888 phosphorylation and Ca2+i mobilization. A, representative Western blot showing CaRpT888 (i) and total CaR (ii) immunoreactivity following exposure to 5 mm Ca2+o for different lengths of time up to 20 min. Quantification of the changes in CaRT888 phosphorylation expressed in arbitrary (arb.) units for the 160-kDa CaR band is shown in panel iii (n = 5). **, p < 0.01, ***, p < 0.001 versus t0; +, p < 0.05, ++, p < 0.01 versus 1-min treatment by repeated measures ANOVA (Tukey post test). B, representative trace showing Ca2+i changes in a single cell (gray) or global cluster of cells (black) in response to 5 mm Ca2+o (n = 3).
Effect of Positive Allosteric Modulation on CaRT888 Phosphorylation
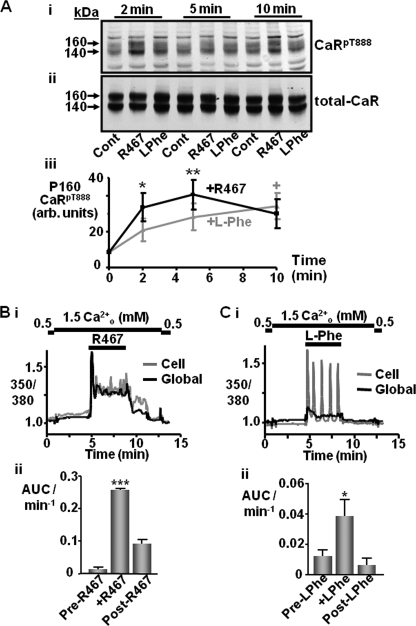
In light of the possibility that orthosteric stimulation of the receptor, i.e. with Ca2+o, can induce both CaRT888 phosphorylation and dephosphorylation at different rates, the effects of the positive allosteric modulator NPS-R467 (24) and the less potent CaR positive allosteric modulator l-phenylalanine (25) were next investigated. Incubation in 1.2 mm Ca2+o for 2, 5, or 10 min elicited only marginal CaRT888 phosphorylation of the 160-kDa band (Fig. 5A) as shown earlier (Fig. 2). However, when cotreated with NPS-R467, a significantly greater level of CaRT888 phosphorylation was seen after 2 min (p < 0.05) most likely as the calcimimetic sensitizes the CaR to the ambient Ca2+o (24). Following exposure to 5 min NPS-R467, the level of phosphorylation of the 160-kDa band declined, returning to baseline by 10 min (Fig. 5A). Together with the data from the concentration-effect experiments, this would suggest that addition of the calcimimetic NPS-R467 to the 1.2 mm Ca2+o-containing buffer elicits a response that is rapid and transient similar to the response elicited by 5 mm Ca2+o alone. In contrast, while cotreatment with 10 mm l-Phe (in the presence of 1.2 mm Ca2+o) failed to induce significant CaRT888 phosphorylation (160-kDa mature protein) after 2 min, phosphorylation levels were raised significantly after 10 min, consistent with the more sustained response evoked by 2 mm Ca2+o alone (see Fig. 3).
FIGURE 5.
Induction of CaRT888 phosphorylation by the positive allosteric CaR modulators l-Phe and NPS-R467. A, representative immunoblots showing CaRpT888 (i) and total CaR (ii) immunoreactivity in CaR-HEK cells following treatment with 1.2 mm Ca2+o in the presence or absence of 1 μm NPS-R467 or 10 mm l-Phe for 2, 5, and 10 min. Quantification of the changes in 160 kDa CaRpT888 immunoreactivity is shown in panel iii (n = 9). *, p < 0.05, **, p < 0.01 (R-467), +p < 0.05 (l-Phe) versus 1.2 mm Ca2+o by one-way ANOVA (Dunnett's post test). Representative traces showing Ca2+i changes in a single cell (gray) or global cluster of cells (black) in response to 1 μm NPS-R467 (Bi) or 10 mm l-Phe (Ci) (in the presence of 1.5 mm Ca2+o). Quantification of the Ca2+i changes is shown as area under the curve/min in panels Bii and Cii (n = 3). *, p < 0.05, ***, p < 0.001 versus responses before and after allosteric treatments, by repeated measures ANOVA. arb., arbitrary; Cont, control.
In Fura2-loaded cells, NPS-R467 induced a rapid and sustained increase in Ca2+i levels (in the presence of 1.5 mm Ca2+o; Fig. 5B) similar to the response to 5 mm Ca2+o. As with calcimimetic cotreatment, Ca2+i concentration increased rapidly following the addition of 10 mm l-Phe (in the presence of 1.5 mm Ca2+o), compared with the response seen in the presence of 1.5 mm Ca2+o alone (Fig. 5C). However the “global” change was lower than for the response to 1 μm NPS-R467 (R467 response, 829% greater than l-Phe response, p < 0.001) and, significantly, the individual cellular responses were mostly slow Ca2+i oscillations, consistent with previous studies (26). Therefore, whereas at 1.5 mm Ca2+o, NPS-R467 (1 μm) mimicked the response of 5 mm (i.e. high) Ca2+o on CaRT888 phosphorylation and Ca2+i mobilization, 10 mm l-Phe appeared to mimic more closely the CaRT888 phosphorylation and Ca2+i oscillatory responses to 2–2.5 mm (moderate) Ca2+o concentration. Consistent with this idea, the mutant receptor CaRT888A exhibits not oscillatory but sustained responses to l-Phe (supplemental Fig. 6) or moderate Ca2+o concentrations (14, 15).
CaR-induced Dephosphorylation of CaRT888
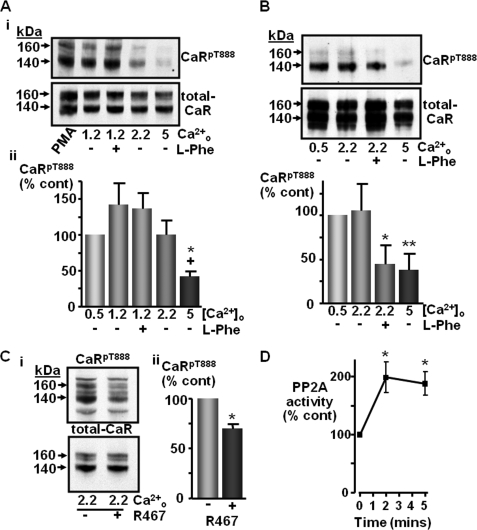
Next, it was investigated whether CaR activation can stimulate CaRT888 dephosphorylation directly. To test this hypothesis, CaR-HEK cells were initially exposed to PMA (1 μm in 0.5 mm Ca2+o-containing buffer) for 10 min to induce maximal phosphorylation of CaRT888 (with 250 nm GF109203X added for the final 30 s) and then incubated for a further 30 s in the absence of PMA but again in the presence of the PKC inhibitor GF109203X (27) in buffer at a Ca2+o concentration of either 0.5, 1.2, 2.2, or 5 mm (Fig. 6). GF109203X was used to prevent further phosphorylation thereby allowing endogenous phosphatase activity to dephosphorylate the CaRT888 as described previously (15). Incubation in any of the PMA-free Ca2+o-containing buffers for the final 30 s resulted in a reduction in mature 160 kDa CaRT888 phosphorylation (Fig. 6) and in the 140-kDa core-glycosylated form (supplemental Fig. S7A), presumably due to endogenous phosphatase activity. Exposure to 5 mm Ca2+o significantly enhanced the dephosphorylation of P160 CaRT888 (p < 0.05; Fig. 6A) and also the P140 CaRT888 (supplemental Fig. S7B). By eliminating any further CaR-induced phosphorylation of CaRT888 in the final 30 s using the PKC inhibitor, this experiment reveals that exposure to high Ca2+o concentration elicits CaRT888 dephosphorylation. Thus, CaRT888 dephosphorylation is not “passive” but also dependent on receptor activation (15).
FIGURE 6.
CaR-induced dephosphorylation of CaRT888. A, representative Western blots (i) showing anti-CaRpT888 or total CaR immunoreactivity following a 10-min pretreatment of CaR-HEK cells with 1 μm PMA (including 250 nm GF109203X for the final 30 s) followed by a further 30-s incubation in buffer (250 nm GF109203X) containing either 0.5, 1.2 (± 10 mm l-Phe), 2.2, or 5 mm Ca2+o. Panel ii shows quantification of the relative change in 160 kDa CaRT888 phosphorylation expressed as a percentage of response in 0.5 mm Ca2+o (n = 10). *, p < 0.05 versus 1.2 mm Ca2+o; +, p < 0.05 versus 1.2 mm Ca2+o and 10 mm l-Phe by ANOVA. B, identical experiment in which PMA-pretreated cells were incubated for the final 30 s in buffer containing 0.5 and 2.2 (± 10 mm l-Phe) or 5 mm Ca2+o (+GF109203X) (n = 8). *, p < 0.05, **, p < 0.01 versus 2.2 mm Ca2+o by repeated measures ANOVA. C, identical experiment in which PMA-pretreated cells were incubated for the final 30 s in buffer containing 2.2 mm Ca2+o (+GF109203X) in the presence or absence of 1 μm NPS-R467. Quantification of the relative change in CaRT888 phosphorylation expressed as a % of control (cont; n = 11). *, p < 0.05 versus 2.2 mm Ca2+o by paired t test. D, effect of 5 mm Ca2+o on PP2A activity after 2 and 5 min of treatment. *, p < 0.05 by Friedman (n = 7).
To determine whether the concentration-dependent, Ca2+o-induced decrease in CaRT888 phosphorylation was indeed a result of Ca2+o acting upon the CaR, and not due to a CaR-independent pathway, the effects of CaR-positive allosteric modulators on CaRT888 dephosphorylation were examined. The amino acid l-Phe (10 mm) was without effect in the presence of 1.2 mm Ca2+o (Fig. 6A) but elicited significant CaRT888 dephosphorylation in the presence of 2.2 mm Ca2+o (Fig. 6B). Similarly, the calcimimetic NPS-R467 (1 μm) also decreased CaRT888 phosphorylation in 2.2 mm Ca2+o-containing buffer (Fig. 6C; supplemental Fig. 7C). These acute treatments had no effect on the level of total-CaR present within the cells (Fig. 6). These data indicate that the increased rate of CaRT888 dephosphorylation induced by elevated Ca2+o concentration is dependent on CaR activation. Next, to confirm whether high Ca2+o concentration directly activates PP2A, CaR-HEK cells were incubated for up to 5 min in buffer containing 0.5 or 5 mm Ca2+o and then lysed and processed for the human active PP2A assay. Indeed, high Ca2+o concentration increased PP2A activity significantly within 2 min, an effect that was sustained until 5 min (Fig. 6D).
Effect of Phosphatase Inhibition on PTH Secretion from Bovine Parathyroid Slices
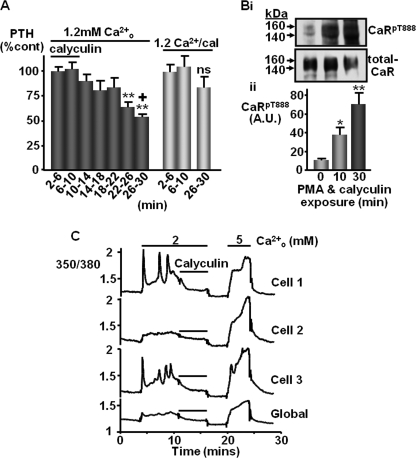
We next assessed whether CaRT888 phosphorylation status has a functional impact upon PTH secretion and thus may contribute to the modulation of calcium homeostasis in vivo. Therefore, we investigated the effect of administering calyculin A on the secretion of PTH from freshly isolated bovine parathyroid glands. The PP1/PP2A protein phosphatase inhibitor calyculin-A was chosen as it had been previously found to promote net CaRT888 phosphorylation in PMA-treated CaR-HEK cells (15). Slices of bovine parathyroid gland were perifused (21) with 1.2 mm Ca2+o, a concentration that partially activates the CaR and submaximally suppresses PTH secretion (1–3; see also supplemental Fig. 8), in the presence of the PP1/PP2A phosphatase inhibitor calyculin-A (100 nm). Following removal of calyculin A, suppression of PTH secretion was observed within 20 min (p < 0.01; Fig. 7), whereas in the continued presence of calyculin A, PTH secretion was maintained (p < 0.05 versus slices in which calyculin was removed; Fig. 7A).
FIGURE 7.
Removal of calyculin A permits Ca2+o-induced suppression of PTH secretion. A, bovine parathyroid slices were perifused in 1.2 mm Ca2+o-containing buffer in the presence of 100 nm calyculin A (cal) for 10 min followed by perifusion in the presence or absence of 100 nm calyculin A for 20 min. PTH secretion (quantified by enzyme-linked immunosorbent assay) is shown as % control (control being the mean value for the first 10 min due to the variability of secretion in the absence of its suppression). **, p < 0.01 versus 2–6 min of control by repeated measures ANOVA; +, p < 0.05 versus 26–30 min in continuous calyculin A treatment, by unpaired t test (n = 6). B, bovine parathyroid slices were incubated for up to 30 min in buffer containing 100 nm calyculin A and 1 μm PMA and then homogenized, and their particulate fractions were collected and processed for immunoblotting using CaRpT888 and total CaR antibodies. *, p < 0.05, **, p < 0.01 versus control (cont) by one-way ANOVA (n = 8). C, in Fura 2-loaded bovine parathyroid cells, the rise in [Ca2+]i elicited by increasing [Ca2+]o from 0.8 to 2 mm, was suppressed by cotreatment with calyculin (100 nm, n = 6). Following washout, exposure to 5 mm Ca2+o demonstrated continued responsiveness of the cells. The three upper traces show representative single cell responses, whereas the lower trace shows the combined response of a cluster of eight cells (global). A.U., arbitrary units. ns, not significant.
In separate parathyroid slices incubated (as described under “Experimental Procedures”) in the absence or presence of 100 nm calyculin (plus 1 μm PMA), significant CaRT888 phosphorylation was observed after both 10- and 30-min time points (Fig. 7B). Thus, the maintenance of PTH secretion in the presence of calyculin A is consistent with the hypothesis that blocking CaRT888 dephosphorylation deactivates the inhibitory impact of the receptor on PTH secretion. This was further demonstrated in Fura2-loaded parathyroid cells in which calyculin A suppressed high Ca2+o-induced Ca2+i mobilization (Fig. 7C).
Human Parathyroid Cell Experiments
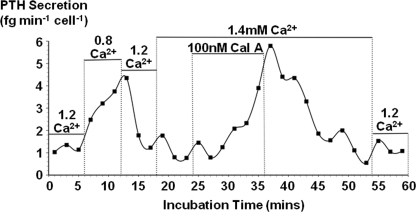
Finally, we also tested the effect of calyculin A on high Ca2+-induced suppression of PTH secretion from perifused normal human parathyroid cells. In the absence of calyculin A, PTH secretion from these cells was reversibly stimulated by low Ca2+o concentrations (0.8 or 1.0 mm) and suppressed at higher Ca2+o concentrations (1.2 or 1.4 mm) as expected (1, 2). In three similar experiments, in the presence of elevated Ca2+o, 100 nm calyculin A induced a progressive increase in PTH secretion over 10–15 min (0.95 ± 0.19 fg min−1 cell−1 PTH secretion in 1.4 mm Ca2+o before calyculin A treatment, 5.26 ± 0.77 at the peak of the calyculin response; p < 0.01 by unpaired t test), which slowly recovered to baseline levels upon return to the control solution.
DISCUSSION
PKC-mediated modulation of class C G protein-coupled receptor signaling is emerging as a significant determinant of receptor function for these receptors. It was first shown that mGluR5-induced intracellular Ca2+ oscillations could be abolished by PKC activators (16–18). Initially, mGluR5T840, located in the juxtamembrane region of the intracellular domain of the receptor, was proposed to be the PKC site that mediates this response (16). However, mutation of mGluR5T840 did not prevent oscillations (28), whereas the adjacent residue mGluR5S839 has since been identified as the PKC site most likely responsible (29). Given the sequence and structural homology between the CaR and the mGluRs (1, 11), it is perhaps not surprising that a number of functional features of mGluR signaling also apply to the CaR.
Having previously shown that CaRT888 is subject to agonist-induced phosphorylation (15), we demonstrate here, for the first time, agonist-induced dephosphorylation of a class C G protein-coupled receptor. Such receptor-elicited dephosphorylation of this protein kinase C site could help explain the control of signal oscillation frequency observed in CaR (30), given that CaRT888 dephosphorylation appears to increase oscillation frequency and/or initiate sustained Ca2+i mobilization in response to heightened CaR activation. In contrast, Ca2+i oscillation frequency in mGluR5-transfected cells is largely independent of agonist concentration (18). Therefore, it is possible that mGluR5 dephosphorylation is not agonist concentration-dependent to the same extent as CaR. Nevertheless, calyculin-A decreases Ca2+i oscillation frequency in both mGluR5- and CaR-transfected cells (15, 18) and thus phosphatase activity is a signaling determinant for both receptors. While the identity of the protein phosphatase responsible for CaRT888 dephosphorylation was not determined here, we have shown previously that CaRT888 dephosphorylation can be inhibited by the PP1/PP2A inhibitors calyculin-A and endothall, with the PP1 inhibitor tautomycin being relatively ineffective and that PP2A colocalizes with phosphorylated CaR in CaR-HEK cells (15). Furthermore in the current study, elevated Ca2+o concentration stimulated PP2A activity (Fig. 6D). Thus together, these data suggest strongly that PP2A is at least partly responsible for CaRT888 dephosphorylation.
Despite their widespread usage in studies of CaR activity, HEK-293 cells are merely a model for endogenous CaR expression e.g. by parathyroid cells. Nevertheless, the CaR responses in both cell systems show a significant number of similarities including inositol 1,4,5-trisphosphate-generated Ca2+i mobilization (including Ca2+i oscillations), suppression of cAMP formation, mitogen-activated protein kinase (MAPK) activation, and a lack of electrical excitability (2). Furthermore, when HEK-293 cells are transfected with the PTH and CaR genes, CaR activation increases the instability of the PTH mRNA transcript, just as for parathyroid cells (31). Finally, this and our previous study (15) demonstrate that in both cell types, CaR-induced Ca2+i mobilization can be attenuated reversibly by PKC activation or PP1/PP2A inhibition and that CaRT888 is phosphorylated upon PKC activation.
After finding evidence of a role for a calyculin A-sensitive phosphatase in CaR-HEK cells, we explored the functional impact of calyculin A on PTH secretion from perifused bovine parathyroid slices and normal human parathyroid cells. CaR stimulation suppresses PTH secretion (2), but it was demonstrated here that cotreatment with calyculin A prevented and even reversed high Ca2+o-induced suppression of PTH secretion (Figs. 7 and 8). Subsequent removal of calyculin A restored the normal Ca2+o-induced suppression of PTH secretion.
FIGURE 8.
Calyculin A attenuates Ca2+o-induced suppression of PTH secretion in normal human parathyroid cells. Human parathyroid cells were prepared and perifused as described under “Experimental Procedures.” Cells were first perifused in 1.2 mm Ca2+o corresponding to the midpoint of the normal range (1.1–1.3 mm). Lowering Ca2+o concentration to 0.8 mm reversibly stimulated PTH secretion, whereas subsequent 1.4 mm Ca2+o exposure suppressed PTH. However, in the continued presence of 1.4 mm Ca2+o, cotreatment with 100 nm calyculin A elicited a progressive increase in PTH secretion to levels similar to or even exceeding those observed at 0.8 mm Ca2+o. Upon the removal of calyculin A, PTH secretion levels slowly returned to their control levels. The result shown is representative of three independent experiments.
The mechanism responsible for 140 kDa CaRT888 phosphorylation is unclear. Deglycosylation of the 140-kDa CaR band using endoglycosidase H (32, 33) reveals it to be the high mannose/core-glycosylated form of the CaR, whereas the 160-kDa CaR band is only susceptible to deglycosylation using PNGaseF, indicative of mature glycosylation (32, 33). Indeed, only the 160-kDa protein can be detected on the cell membrane (34), albeit as a small fraction of the total 160-kDa CaR pool. The ability of Ca2+o to induce phosphatidylinositol hydrolysis in cells expressing various glycosylation-deficient CaR mutants declines in proportion to the reduction in cell surface expression of the mutant CaRs (33). Similarly, tunicamycin, which prevents mature glycosylation of the CaR (32, 35), decreased CaR-induced phosphatidylinositol hydrolysis (35). Together, these findings suggest that plasma membrane expression is required for CaR activity and that the phosphorylation of the 140-kDa CaR protein is likely to occur secondary to 160 kDa CaR activation on the membrane. However, we cannot exclude the possibility that the immature 140-kDa form of the CaR is activated intracellularly, for example, in response to elevated intravesicular Ca2+ levels, thereby inducing its own PKC-mediated phosphorylation. It should be noted in this regard that whereas the Ca2+o concentration-dependence of 160 kDa CaRT888 phosphorylation was clearly biphasic, CaRT888 phosphorylation of the 140-kDa band was sustained even after 20 min in the presence of 5 mm Ca2+o (supplemental Fig. 5). Therefore, the phosphatase responsible for dephosphorylation of the 160-kDa protein was less effective at, or had less access to, the 140-kDa protein. Thus, the CaR-stimulated phosphatase activity we report here is capable of dephosphorylating 160-kDa CaRT888 in response to CaR activation, but not 140-kDa CaR. It should be noted that if dephosphorylation of 160-kDa CaR occurs mostly, if not exclusively, at the membrane, then the current data may have underestimated the magnitude of the effect at the membrane as the immunoblots here include all p160 CaR, whether derived from the plasma membrane or intracellular organelles.
Together, the data presented in the current study demonstrate a biphasic Ca2+o concentration-dependence for CaRT888 phosphorylation in CaR-HEK cells that is most likely due to a disproportionate rise in CaRT888 dephosphorylation at higher levels of receptor stimulation, thus permitting more Ca2+i mobilization. Although the calyculin A-sensitive phosphatase responsible for mediating this effect has not yet been identified, this work highlights the functional importance of phosphatase-regulatory mechanisms in the control of CaR function and the findings from the experiments on bovine parathyroid slices suggest that these effects may also be physiologically important for the regulation of calcium homeostasis in vivo.
Supplementary Material
Acknowledgments
We thank Drs. Ed Nemeth (Toronto, Canada), Austin Elliott, and Jason Bruce (University of Manchester) and Kathryn Bailey (University of Manchester) for advice and technical assistance. We also thank Professor Leigh Delbridge of the Department of Surgery at the University of Sydney for providing specimens of human parathyroid tissue under institutional guidelines and Margaret Wilkinson and Cameron Wood of PaLMS laboratories Royal North Shore Hospital, St. Leonards New South Wales for performing the PTH assays. Lastly, the authors thank J&B Fitton, Ltd. for help in obtaining bovine parathyroid glands.
This work was supported by a United Kingdom Biotechnology and Biological Sciences Research Council studentship (to W. M.) and by a grant from Kidney Research UK (IN4/2008).

The on-line version of this article (available at http://www.jbc.org) contains supplemental Figs. S1–S8.
- CaR
- calcium-sensing receptor
- mGluR
- metabotropic glutamate receptor
- PKC
- protein kinase C
- l-Phe
- l-phenylalanine
- PTH
- parathyroid hormone
- PP2A
- protein phosphatase 2A
- PMA
- phorbol 12-myristate 13-acetate
- ANOVA
- analysis of variance
- HEK
- human embryonic kidney.
REFERENCES
- 1.Brown E. M., Gamba G., Riccardi D., Lombardi M., Butters R., Kifor O., Sun A., Hediger M. A., Lytton J., Hebert S. C. (1993) Nature 366, 575–580 [DOI] [PubMed] [Google Scholar]
- 2.Brown E. M., MacLeod R. J. (2001) Physiol. Rev. 81, 239–297 [DOI] [PubMed] [Google Scholar]
- 3.Nemeth E. F., Wallace J., Scarpa A. (1986) J. Biol. Chem. 261, 2668–2674 [PubMed] [Google Scholar]
- 4.Kobayashi N., Russell J., Lettieri D., Sherwood L. M. (1988) Proc. Natl. Acad. Sci. U.S.A. 85, 4857–4860 [DOI] [PMC free article] [PubMed] [Google Scholar]
- 5.Morrissey J. J. (1988) Am. J. Physiol. 254, E63–E70 [DOI] [PubMed] [Google Scholar]
- 6.Nygren P., Gylfe E., Larsson R., Johansson H., Juhlin C., Klareskoq L., Akerström G., Rastad J. (1988) Biochim. Biophys. Acta 968, 253–260 [DOI] [PubMed] [Google Scholar]
- 7.Membreño L., Chen T. H., Woodley S., Gagucas R., Shoback D. (1989) Endocrinology 124, 789–797 [DOI] [PubMed] [Google Scholar]
- 8.Racke F. K., Nemeth E. F. (1993) J. Physiol. 468, 141–162 [DOI] [PMC free article] [PubMed] [Google Scholar]
- 9.Racke F. K., Nemeth E. F. (1993) J. Physiol. 468, 163–176 [DOI] [PMC free article] [PubMed] [Google Scholar]
- 10.Clarke B. L., Hassager C., Fitzpatrick L. A. (1993) Endocrinology 132, 1168–1175 [DOI] [PubMed] [Google Scholar]
- 11.Garrett J. E., Capuano I. V., Hammerland L. G., Hung B. C., Brown E. M., Hebert S. C., Nemeth E. F., Fuller F. (1995) J. Biol. Chem. 270, 12919–12925 [DOI] [PubMed] [Google Scholar]
- 12.Bai M., Trivedi S., Lane C. R., Yang Y., Quinn S. J., Brown E. M. (1998) J. Biol. Chem. 273, 21267–21275 [DOI] [PubMed] [Google Scholar]
- 13.Jiang Y. F., Zhang Z., Kifor O., Lane C. R., Quinn S. J., Bai M. (2002) J. Biol. Chem. 277, 50543–50549 [DOI] [PubMed] [Google Scholar]
- 14.Young S. H., Wu S. V., Rozengurt E. (2002) J. Biol. Chem. 277, 46871–46876 [DOI] [PubMed] [Google Scholar]
- 15.Davies S. L., Ozawa A., McCormick W. D., Dvorak M. M., Ward D. T. (2007) J. Biol. Chem. 282, 15048–15056 [DOI] [PubMed] [Google Scholar]
- 16.Kawabata S., Tsutsumi R., Kohara A., Yamaguchi T., Nakanishi S., Okada M. (1996) Nature 383, 89–92 [DOI] [PubMed] [Google Scholar]
- 17.Nash M. S., Young K. W., Challiss R. A., Nahorski S. R. (2001) Nature 413, 381–382 [DOI] [PubMed] [Google Scholar]
- 18.Nash M. S., Schell M. J., Atkinson P. J., Johnston N. R., Nahorski S. R., Challiss R. A. (2002) J. Biol. Chem. 277, 35947–35960 [DOI] [PubMed] [Google Scholar]
- 19.Ward D. T., McLarnon S. J., Riccardi D. (2002) J. Am. Soc. Nephrol. 13, 1481–1489 [DOI] [PubMed] [Google Scholar]
- 20.Davies S. L., Gibbons C. E., Vizard T., Ward D. T. (2006) Am. J. Physiol. Cell Physiol. 290, C1543–1551 [DOI] [PubMed] [Google Scholar]
- 21.Conigrave A. D., Mun H. C., Delbridge L., Quinn S. J., Wilkinson M., Brown E. M. (2004) J. Biol. Chem. 279, 38151–38159 [DOI] [PubMed] [Google Scholar]
- 22.Bradford M. M. (1976) Anal. Biochem. 72, 248–254 [DOI] [PubMed] [Google Scholar]
- 23.Mun H. C., Brennan S. C., Delbridge L., Wilkinson M., Brown E. M., Conigrave A. D. (2009) J. Clin. Endocrinol. Metab. 94, 3567–3574 [DOI] [PMC free article] [PubMed] [Google Scholar]
- 24.Nemeth E. F., Steffey M. E., Hammerland L. G., Hung B. C., Van Wagenen B. C., DelMar E. G., Balandrin M. F. (1998) Proc. Natl. Acad. Sci. U.S.A. 95, 4040–4045 [DOI] [PMC free article] [PubMed] [Google Scholar]
- 25.Conigrave A. D., Quinn S. J., Brown E. M. (2000) Proc. Natl. Acad. Sci. U.S.A. 97, 4814–4819 [DOI] [PMC free article] [PubMed] [Google Scholar]
- 26.Young S. H., Rozengurt E. (2002) Am. J. Physiol. Cell Physiol. 282, C1414–1422 [DOI] [PubMed] [Google Scholar]
- 27.Davies S. P., Reddy H., Caivano M., Cohen P. (2000) Biochem. J. 351, 95–105 [DOI] [PMC free article] [PubMed] [Google Scholar]
- 28.Dale L. B., Babwah A. V., Bhattacharya M., Kelvin D. J., Ferguson S. S. (2001) J. Biol. Chem. 276, 35900–35908 [DOI] [PubMed] [Google Scholar]
- 29.Kim C. H., Braud S., Isaac J. T., Roche K. W. (2005) J. Biol. Chem. 280, 25409–25415 [DOI] [PubMed] [Google Scholar]
- 30.Breitwieser G. E., Gama L. (2001) Am. J. Physiol. Cell Physiol 280, C1412–1421 [DOI] [PubMed] [Google Scholar]
- 31.Galitzer H., Lavi-Moshayoff V., Nechama M., Meir T., Silver J., Naveh-Many T. (2009) BMC Biol. 7, 17. [DOI] [PMC free article] [PubMed] [Google Scholar]
- 32.Bai M., Quinn S., Trivedi S., Kifor O., Pearce S. H., Pollak M. R., Krapcho K., Hebert S. C., Brown E. M. (1996) J. Biol. Chem. 271, 19537–19545 [DOI] [PubMed] [Google Scholar]
- 33.Ray K., Clapp P., Goldsmith P. K., Spiegel A. M. (1998) J. Biol. Chem. 273, 34558–34567 [DOI] [PubMed] [Google Scholar]
- 34.Bai M., Trivedi S., Brown E. M. (1998) J. Biol. Chem. 273, 23605–23610 [DOI] [PubMed] [Google Scholar]
- 35.Fan G., Goldsmith P. K., Collins R., Dunn C. K., Krapcho K. J., Rogers K. V., Spiegel A. M. (1997) Endocrinology 138, 1916–1922 [DOI] [PubMed] [Google Scholar]
Associated Data
This section collects any data citations, data availability statements, or supplementary materials included in this article.


