Abstract
Recent work has led to the identification of novel endocytic compartments with functional roles in both protein trafficking and growth factor signal transduction. The phosphatidylinositol 3-phosphate binding, FYVE domain-containing protein WDFY2 is localized to a distinct subset of early endosomes, which are localized close to the plasma membrane. Here, we find that the serine/threonine kinase Akt interacts with these endosomes in an isoform-specific manner. Using quantitative fluorescence microscopy we demonstrate specific co-localization of WDFY2 with endogenous Akt2, but not Akt1. Moreover, depletion of WDFY2 leads to impaired phosphorylation of Akt in response to insulin due to isoform specific reduction of Akt2, but not Akt1, protein levels, and to a marked reduction in the insulin-stimulated phosphorylation of numerous Akt substrates. This is accompanied by an impairment in insulin-stimulated glucose transport and, after prolonged silencing, a reduction in the level of expression of adipogenic genes. We propose that WDFY2-enriched endosomes serve as a scaffold that enables specificity of insulin signaling through Akt2.
Keywords: Adipocyte, Dual Specificity Kinase, Endosomes, Glucose Transport, Insulin, Akt Protein Kinase B, Endocytosis, Endosome, Glucose Transport, Signaling
Introduction
The early endocytic pathway is increasingly being recognized as a complex and heterogeneous membrane population in which distinct endosomal populations are specialized for the trafficking of different receptor types (1, 2). Complexity and specialization in the endosomal pathway are achieved by the action of small GTPases and by the generation of specific phosphoinositides on the endosomal surface. One of the best studied examples of this mechanism is the specific and temporal targeting of proteins containing FYVE domains to phosphatidylinositol 3-phosphate (3–6), which is present almost exclusively in endosomal membranes. The human genome encodes for >30 proteins that contain FYVE domains, several of which are highly conserved and which may contribute in different ways toward establishing the complexity and functionality of the endocytic pathway. We recently characterized one of these proteins, WDFY2, named for its content of WD40 motifs and a FYVE domain (7). In Caenorhabditis elegans, WDFY2 depletion impairs endocytosis in coelomocytes, and in mammalian cells it defines a distinct set of endosomes that lack the canonical markers EEA1 and Rab5 and are further distinguished by their close proximity to the plasma membrane (7, 8).
In addition to internalization, the endosomal pathway plays a critical role in modulating signal transduction. Growth factor receptors are internalized immediately following activation, and both their fate and their signaling functions are affected by their transit through the endocytic pathway (9–13). Different receptors traffic through distinct early endosomal compartments (1, 2), and their signaling functions are modulated by the specific nature of the endosomes through which they traffic. For example, signaling by transforming growth factor β is influenced by the endosomal localization of the SMAD-interacting protein SARA, which is found in endosomes containing the canonical marker EEA1 (14, 15).
In another example, the endosomal proteins APPL3 (adaptor protein containing PH domain, PTB domain, and leucine zipper motif) 1 and APPL2, which reside in an endosomal population devoid of EEA1 (16), regulate signaling by interacting with downstream effectors, such as the protein kinase Akt (16–21). It has been proposed that the interaction of Akt with APPL facilitates the phosphorylation of specific substrates (21). Interestingly, WDFY2 has been identified in a yeast two-hybrid screen as an interacting partner with protein kinases Akt and protein kinase Cζ (22, 23). In addition, recent studies indicate that endosomes that contain APPLs bind WDFY2 as they lose APPL (8). These studies suggest that WDFY2 may have a specific role in modulating signaling through Akt downstream of the interaction of this kinase with APPL.
Akt constitutes a node for many signaling cascades downstream of phosphatidylinositol 3,4,5-trisphosphate, regulating metabolism, protein synthesis, cell growth, and survival (24, 25). This diversity in Akt signaling is orchestrated by three mammalian isoforms, Akt1, Akt2, and Akt3, that share a conserved structure with three functional domains: an N-terminal PH domain, a kinase domain, and a C-terminal regulatory domain containing a phosphorylation site (FXXF(S/T)Y) (26). These isoforms share ∼80% sequence homology and phosphorylate substrates containing the minimal consensus sequence RXRXX(S/T), where S/T is the phosphorylation site and X any amino acid. Studies in isoform-specific Akt knock-out mice indicate that the three isoforms have overlapping but distinct physiological functions (25). For example, Akt2−/− mice display a strong metabolic phenotype, with diabetes type II-like symptoms (27, 28), not seen in Akt1−/− or Akt3−/− mice (29, 30). Similarly, on a cellular level, siRNA knockdown studies of Akt1 and Akt2 in 3T3-L1 adipocytes revealed Akt2 as the primary isoform involved in insulin signaling despite the presence of both Akt1 and Akt2 in these cells (31). The mechanisms that fine tune the activities of the three Akt isoforms for them to achieve their specific physiological functions are not clear.
Here, we investigate the role of WDFY2-enriched endosomes in Akt signaling in mature 3T3-L1 adipocytes. Using quantitative image analysis, we find an isoform-specific selective interaction between WDFY2 and Akt2, as opposed to the Akt1 isoform. We observe that WDFY2 depletion leads to decreased levels of Akt2 protein levels and attenuated insulin-stimulated phosphorylation of Akt. The functional importance of the isoform-specific interaction between WDFY2 and Akt2 was demonstrated by decreased insulin-stimulated glucose uptake and a global attenuation of phospho-Akt substrate phosphorylation in WDFY2-depleted cells. Together, these results indicate that WDFY2 serves as a molecular scaffold that enables signaling specificity, demonstrating a mode of regulation that distinguishes between Akt1 and Akt2.
EXPERIMENTAL PROCEDURES
Tissue Culture and Gene Silencing
3T3-L1 cells were obtained from American Type Culture Collection and were grown under 5% CO2 in Dulbecco's modified Eagle's medium supplemented with 10% fetal bovine serum, 50 units of penicillin/ml, and 50 μg of streptomycin/ml, which was replaced every 48 h unless otherwise stated. Three days after confluence, the medium was replaced with Dulbecco's modified Eagle's medium containing a differentiation mixture consisting of 0.5 mm 3-isobutyl-1-methylxanthine (Sigma), 0.25 μm dexamethasone (Sigma), and 1 μm insulin (Sigma). 72 h later, the medium was replaced with Dulbecco's modified Eagle's medium. Gene silencing was conducted 4 days after differentiation through electroporation (10 nmol of siRNA/15-cm plate). Scrambled (Scr) siRNA or siRNA oligonucleotides against mouse WDFY2 were obtained from Dharmacon. Electroporation was performed using a Bio-Rad Gene Pulser II (0.18 kV and 960 microfarads).
Antibodies and Fluorescent Probes
Rabbit antibodies to the full-length WDFY2 protein were affinity-purified against full-length bacterially expressed WDFY2. Mouse antibodies to the N terminus of EEA1, rabbit PAS antibody (RXRXXS/T) (catalog no. 9614, 1:1000 dilution), phospho-Akt (Ser473) antibody (catalog no. 9271), Akt2 (5B5) rabbit monoclonal antibody (catalog no. 2964), and Akt1 (2H10) mouse monoclonal antibody (catalog no. 2967) were from Cell Signaling. Mouse anti-β-actin antibody was from Sigma. Secondary detection was with Alexa Fluor-coupled species-specific antibodies obtained from Molecular Probes (Eugene, OR).
2-Deoxyglucose Uptake
3T3-L1 adipocytes were plated in a 24-well multiwell tissue culture plate and differentiated. The cells were serum-starved for 2 h in Krebs-Ringer HEPES buffer (130 mm NaCl, 5 mm KCl, 1.3 mm CaCl2, 1.3 mm MgSO4, and 25 mm HEPES, pH 7.4, supplemented with 0.5% bovine serum albumin, and 2 mm sodium pyruvate) and then stimulated with 1 or 100 nm insulin for 30 min. Glucose uptake was initiated by addition of [1,2-3H]2-deoxy-d-glucose at a final assay concentration of 100 μm, for 5 min, at 37 °C. The cells were washed in ice-cold phosphate-buffered saline and lysed with 0.4 ml of 1% Triton X-100. 3H content was determined by scintillation counting. Nonspecific deoxyglucose uptake was measured in the presence of 20 μm cytochalasin B and subtracted from each determination to obtain specific uptake.
Quantitative Real-time PCR (qRT-PCR)
mRNA isolation was performed using the TRIzol reagent protocol (Invitrogen). Prior to mRNA collection, the cells were washed twice with ice-cold phosphate-buffered saline. The concentration and purity of mRNA were determined by absorbance measurement at 260/280 nm. 2 μg of mRNA was used for cDNA synthesis (20-μl reaction) using an iScript cDNA synthesis kit (Bio-Rad). For RT-PCR, 1 μl of cDNA was used for detection of specific gene targets. Primers used were designed using PrimerBank and were synthesized by Operon. Ferritin was used as an internal control. Quantitative RT-PCR was run using the MyIQ Real-time PCR system (Bio-Rad).
Immunoblotting
The cells were washed twice with ice-cold phosphate-buffered saline and scraped into lysis buffer (1% SDS, 120 mm NaCl, 1.6 mm HEPES, pH 7.4, 800 mm NaF, 4 μm NaPPi, and protease inhibitors) and homogenized by seven passages through a 27-gauge needle. The samples were centrifuged for 5 min at 500 × g, and protein concentration was determined by BCA (Pierce). 10 μg of proteins was separated on SDS-PAGE and transferred to nitrocellulose. The membranes were blocked with 5% nonfat milk in Tris-buffered saline with 0.1% Tween 20 and incubated with primary antibodies overnight. Anti-rabbit or anti-mouse IgG horseradish peroxidase-conjugated antibodies (Promega) were used in combination with enhanced chemiluminescence (PerkinElmer Life Sciences) for detection.
Optical System and Image Analysis
Epifluorescence images were taken using a Zeiss Axiovert 200 inverted microscope with a Zeiss 100 × 1.40 NA oil-immersion objective equipped with a Zeiss AxioCam HR CCD camera with 1300 × 1030 pixel resolution. To visualize WDFY2-enriched endosomes, images were smoothed by convolving with a small, two-dimensional Gaussian spot that preserved the mean intensity. The local background around the endosomes was estimated by convolving with a larger, two-dimensional Gaussian and subtracting this from the smoothed images. From this we generated a binary masking image by setting the intensity of all positive-valued pixels to 1 and all other pixels to 0. We then multiplied the mask by the original images (32).
Yeast Two-hybrid Assays
Strains were made by co-transforming two vectors (pGAD-T7 and pGBK-T7) into AH109 (mat a) yeast (Clontech) using standard yeast transformation procedures (lithium acetate transformation). AH109 contains MEL1, ADE2, HIS3, and LACZ, reporter genes, such that interaction of the bait and prey constructs will allow transcription of these four gene products. Vectors used were: pGAD-T7 (empty vector), pGBK-T7 (empty vector), pGBK-T7-WDFY2, pGAD-T7-Akt1, and pGAD-T7-Akt2. Co-transformed strains were maintained on Synthetic defined-Trp-Leu agar plates. Strains were grown overnight (∼16 h) on a 30 °C wheel in Synthetic defined-Trp-Leu + kanamycin. Cultures were back-diluted to A = 0.1 in Synthetic defined-Trp-Leu-Ade-His + kanamycin medium, and after 18–20 h at 30 °C a quantitative X-α-gal assay was performed as described (33). Cultures were combined with X-α-gal buffer, and 145 μl was added to a row or column on a 96-well plate. One row/column contained medium and X-α-gal buffer only as a blank. Once cell cultures with X-α-gal buffer were added to 96-well plates, plates were placed on a shaker at room temperature, and readings were done at different time points in a Tecan SAFIRE II at 410 and 600 nm, to monitor α-galactosidase activity and growth, respectively. Averages of 8 wells from each strain were calculated, and the average blank reading was subtracted.
RESULTS
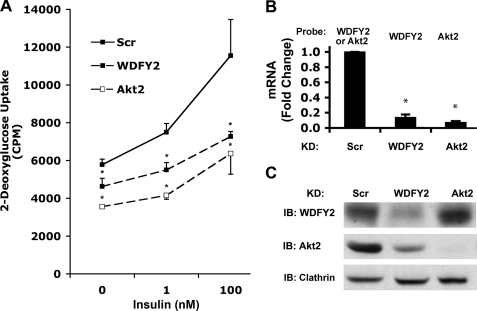
To elucidate the function of WDFY2-enriched endosomes in a specific functional context, we utilized 3T3-L1 adipocytes, where both trafficking of GLUT4 and signaling through the insulin receptor can be evaluated. Depletion of WDFY2 led to a significant inhibition of insulin-stimulated glucose uptake in 3T3-L1 adipocytes (Fig. 1A). This effect was due to the combination of decreased insulin sensitivity and reduced basal uptake of glucose compared with cells exposed to Scr siRNA and was comparable with that seen upon depletion of Akt2, a known required signaling component in insulin-stimulated glucose uptake. The effectiveness of WDFY2 and Akt2 knockdown by siRNA oligonucleotides was evaluated by measuring both mRNA and protein levels of each. Compared with Scr, WDFY2 and Akt2 knockdown cells showed a highly significant ∼85–90% decrease in their respective mRNA (Fig. 1B). The levels of WDFY2 protein, evaluated by immunoblotting, were found to be reduced by ∼60% (Fig. 1C, top panel), and Akt2 protein was reduced to undetectable levels (Fig. 1C, middle panel, right lane). Analysis of GLUT4 by immunofluorescence did not reveal significant alterations in the levels of the transporter (not illustrated). However, an unexpected marked reduction of Akt2 protein levels was observed in WDFY2-depleted cells (Fig. 1C, middle panel), suggesting that the impairment in insulin-stimulated glucose transport seen in response to WDFY2 depletion is due to impaired signaling through the Akt pathway.
FIGURE 1.
Effect of WDFY2 depletion on insulin-stimulated glucose uptake. A, 3T3-L1 adipocytes, day 5 of differentiation, were transfected with Scr, WDFY2, or Akt2 siRNA. 48 h after transfection, the cells were serum-starved (3 h), and 2-deoxyglucose uptake was measured after 30 min of insulin stimulation (1 or 100 nm) (n = 3, mean cpm ± S.E. (error bars), p < 0.01, Student's t test). B, WDFY2 and Akt2 mRNA levels were determined by qRT-PCR (n = 3, p < 0.01, Student's t test). C, lysates from A were subjected to SDS-PAGE, and WDFY2 and Akt2 protein levels were analyzed by immunoblotting (IB). Clathrin was used as a loading control.
Effects of WDFY2 Depletion on Akt
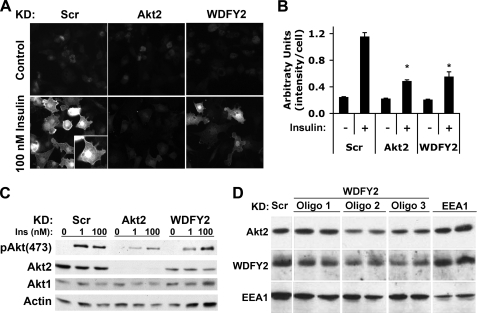
To determine whether WDFY2 depletion impaired Akt activation, we used a phospho-specific antibody to Akt serine 473. Insulin stimulation resulted in a pronounced increase in staining intensity in all regions of the cell, predominating in the cell periphery and in the nucleus (Fig. 2A, lower left panel). Staining in cells depleted of Akt2 was much dimmer and probably corresponded to the remaining phosphorylated Akt1 (Fig. 2A, compare upper left and upper and lower center panels). Consistent with a negative effect of WDFY2 depletion on Akt signaling, pAkt(473) immunofluorescence in insulin-stimulated WDFY2 knockdown cells was significantly reduced compared with insulin-stimulated controls (Fig. 2A, compare lower left with lower right panels). Quantification of the average intensity/cell from several independent experiments revealed an average decrease of 50–60% in pAkt(473) staining intensity in response to either Akt2 or WDFY2 knockdown in insulin stimulated cells (Fig. 2B).
FIGURE 2.
Effect of WDFY2 depletion on Akt phosphorylation. A, 3T3-L1 adipocytes transfected with Scr, WDFY2, or Akt2 siRNA 48 h prior to the experiment were serum-starved and insulin-stimulated for 15 min (100 nm). The cells were briefly washed and fixed in 4% formaldehyde (15 min) and 95% methanol (5 min) prior to immunofluorescence analysis of pAkt(473). B, average intensity of immunofluorescence staining in control and insulin-stimulated cells from A is shown. 20 frames representing a total of ∼375 cells per group were analyzed and are presented as mean intensity/cell ± S.E. (error bars), p < 0.01, Student's t test. C, 3T3-L1 adipocytes transfected with Scr, WDFY2, or Akt2 siRNA 48 h prior to the experiment were serum-starved and insulin (Ins)-stimulated for 15 min (1 or 100 nm). Lysates were subjected to SDS-PAGE and immunoblotting using pAkt(473), Akt2, Akt1, and actin antibodies. D, 3T3-L1 adipocytes were transfected with Scr, WDFY2, or EEA1 siRNA 48 h prior to lysis. Three different WDFY2 oligonucleotides (Oligos) 1–3 were used. Lysates were subjected to SDS-PAGE and immunoblotting using antibodies to Akt2, WDFY2, and EEA1.
To corroborate the immunofluorescence results, we analyzed whole cell extracts by Western blotting. Depletion of WDFY2 caused a significant decrease in the levels of pAkt in response to insulin, in particular at submaximal insulin concentration (Fig. 2C, top panel). Surprisingly, analysis of total Akt proteins levels revealed that WDFY2 depletion caused a selective decrease in the levels of the Akt2 isoform (Fig. 2C, second panel from top), leaving Akt1 and control proteins such as actin unaffected (Fig. 2C, bottom two panels). This result is noteworthy because Akt2 and Akt1 are highly homologous, and the mechanisms by which insulin action is dependent specifically on Akt2 are unknown. To evaluate the specificity of the observed effects of WDFY2 depletion on Akt2, several different oligonucleotides directed to WDFY2 (WDFY2a, b, and c) and knockdown of another FYVE-domain protein, EEA1, were analyzed (Fig. 2D). The decrease in Akt2 protein levels correlated with the effectiveness of the WDFY2 knockdown and was unaltered in response to EEA1 knockdown, revealing specificity for WDFY2 and Akt2 interactions.
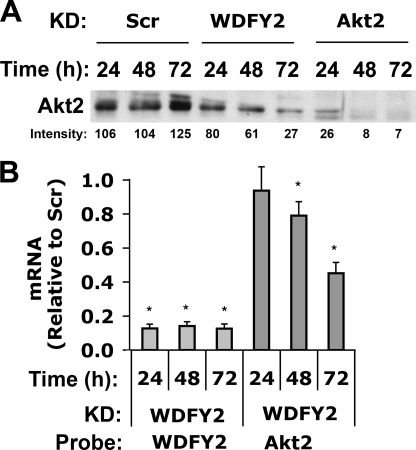
To determine whether the decreased levels of Akt2 protein observed in response to WDFY2 knockdown were due to transcriptional or post-transcriptional responses, Akt2 mRNA and protein levels were analyzed after 24, 48, and 72 h of WDFY2 knockdown. Akt2 protein levels were diminished at 24 h and continued to decrease significantly with time (Fig. 3A). Interestingly, the initial drop in Akt2 levels, after 24 h, was not coupled to a reduction in Akt2 mRNA (Fig. 3B). However, at 48 and 72 h of WDFY2 knockdown Akt2 mRNA start to fall to significantly lower levels (Fig. 3B). These results suggest that the initial event following WDFY2 knockdown is a decrease in Akt2 protein levels.
FIGURE 3.
Time course of the effect of WDFY2 depletion on Akt2 mRNA and protein levels. A, 3T3-L1 adipocytes transfected with Scr, WDFY2, or Akt2 siRNA were analyzed for the expression of Akt2 by Western blotting 24, 48, and 72 h after transfection (n = 3, representative blot). B, WDFY2 and Akt2 mRNA levels were determined 24, 48, and 72 h after knockdown of WDFY2 using qRT-PCR (n = 3, mean ± S.E. (error bars), p < 0.01, Student's t test).
Localization of Endogenous Akt1 and Akt2 Relative to WDFY2
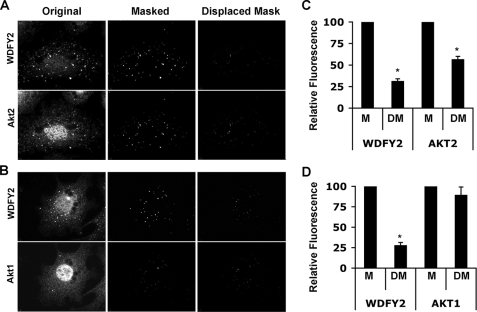
WDFY2 is localized on a population of early endosomes that lack canonical early endosome markers and reside close to the plasma membrane (7). The mechanism by which WDFY2 exerts a selective effect on Akt2 levels, but not the highly homologous kinase Akt1, could involve a preferential interaction of WDFY2 with Akt2 in response to normal cellular compartmentalization of these two kinases. To explore this possibility, the localization of endogenous WDFY2 relative to endogenous Akt1 and Akt2 was analyzed. 3T3-L1 adipocytes were stimulated with insulin, fixed, and stained with antibodies to endogenous WDFY2, and either Akt1 or Akt2. Both Akt1 and Akt2 were seen in the nuclear region as well as diffusely distributed in the cytoplasm (Fig. 4, A and B, lower panels). In addition, punctate staining was consistently seen in both starved and insulin-stimulated cells stained for Akt2, being more predominant in cells stimulated with insulin (Fig. 4A, lower panels). WDFY2 staining was much more punctate, corresponding to its localization to endosomes (Fig. 4, A and B, upper panels).
FIGURE 4.
Co-localization of endogenous Akt isoforms with WDFY2. 3T3-L1 adipocytes at day 7 of differentiation were serum-starved and stimulated with 100 nm insulin for 30 min. Endogenous WDFY2 and Akt2 or Akt1 was detected by fluorescent immunostaining. A and B, the left panels display raw images of WDFY2, Akt2, or Akt1. Digital binary masks revealing the regions encompassed by WDFY2 endosomes exclusively were generated. The product of the raw images and the binary mask were labeled as Masked and are displayed in the center panels. As a control for nonspecificity the generated mask was shifted 10 pixels in the x and y planes and referred to as Displaced Mask. The product of the raw image and the Displaced Mask is displayed in the right panels. C and D, quantification of fluorescence intensity in the Masked (M) or Displaced Masked (DM) WDFY2 and Akt2 or Akt1 images (average of 5–10 cells, mean ± S.E. (error bars), p < 0.01, Student's t test).
Because of the broad distribution of Akt1 and Akt2, image overlaps alone would be inadequate to evaluate whether meaningful co-localization of either of these kinases with WDFY2 exists. To address this issue, we generated binary masks of the images of WDFY2 to delineate the regions corresponding to WDFY2-enriched endosomes. When superimposed on each image, these masks reveal the signal specifically present in the regions occupied by WDFY2-enriched endosomes (Fig. 4, A and B, center panels). To measure the fluorescence intensity outside WDFY2-containing endosomes, the masks were displaced by 10 pixels in the x and y axes. As expected, when the masks were superimposed on images of WDFY2, the fluorescence intensity in the mask was much higher than that in the displaced mask (Fig. 4, A and B, compare upper center and right panels). When the corresponding Akt2 image was analyzed, significantly higher fluorescence intensity was detected within the mask corresponding to WDFY2 endosomes than in the displaced mask (Fig. 4A, compare lower center and right panels). In contrast, when Akt1 staining was analyzed, similar fluorescence intensity was detected within the mask corresponding to WDFY2 endosomes than within the displaced mask (Fig. 4B, compare lower center and right panels). These results are quantified in Fig. 4, C and D, in which the fluorescence intensity in the displaced mask is expressed relative to that inside the mask from 5–10 cells from independent experiments. These results indicate that, at steady state, endogenous Akt2 associates with WDFY2-enriched endosomes to a much greater extent that endogenous Akt1.
Effects of Akt2 Depletion on Akt Substrate Phosphorylation
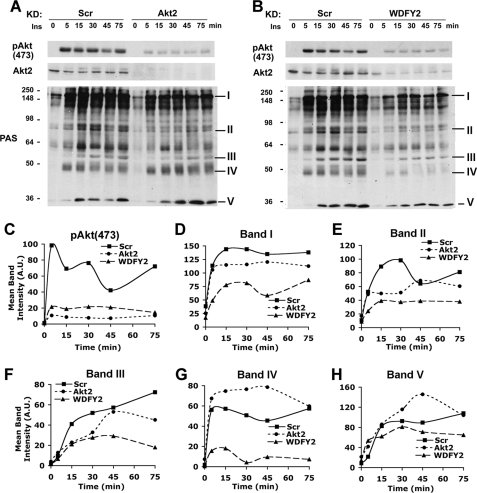
The decrease in Akt2 levels may underlie the decrease in insulin-stimulated glucose transport seen in cells depleted of WDFY2. For this to be the case, the decrease in Akt2 levels would have to be of a magnitude sufficient to impair its signaling functions. To determine first the relationship between Akt2 levels and Akt substrate phosphorylation, we analyzed cell extracts by Western blotting with anti-pAkt (473) and with an antibody (PAS) to the phospho-Akt substrate motif RXRXXpS/T. Cells transfected with Scr or Akt2-directed siRNAs were treated with 10 nm insulin for 5, 15, 30, 45, and 75 min (Fig. 5A). In Scr siRNA-transfected cells (Fig. 5, A and B, left), maximal pAkt(473) levels were reached within 5 min of insulin addition. In Akt2 knockdown cells (Fig. 5A, right), pAkt(473) levels were diminished at every time point after insulin addition, and Akt2 protein levels were reduced to undetectable levels. Immunoblotting with PAS antibody revealed numerous substrates phosphorylated in response to insulin (Fig. 5, A and B, left). Although some of these (b and I) displayed a time course of phosphorylation that closely paralleled that of pAkt(473) (compare Fig. 5, C and D), others (b and II) showed maximal phosphorylation at significantly later time points (compare Fig. 5, C and E), or a continuous increase over the time period studied (b and III, Fig. 5F).
FIGURE 5.
Effect of WDFY2 depletion on the dynamics of Akt substrate phosphorylation. A and B, 3T3-L1 adipocytes transfected with Scr, Akt2 (A), or WDFY2 (B) siRNA on day 5 of differentiation were serum-starved and stimulated on day 7 with 10 nm insulin (Ins) for 0, 5, 15, 30, 45, or 75 min prior to lysis (n = 3, representative blot). Immunoblots were probed with pAkt(473), Akt2, or PAS antibodies. C–H, densitometric quantification of pAkt(473) (C) and bands I–V (D–H) in Scr versus Akt2 or WDFY2 immunoblots.
This result suggests that the phosphorylation of some of the proteins detected by the PAS antibody is under complex regulation, possibly reflecting variations in Akt substrate affinity, spatial constraints, phosphatase activities, or phosphorylation by kinases other than Akt2. This latter possibility is suggested by the finding that phosphorylation of some of the proteins detected by the PAS antibody in response to insulin was in fact increased in Akt2-depleted cells (Fig. 5A, bands IV and V, and Fig. 5, G and H). This finding suggests the presence of at least one kinase that can phosphorylate the RXRXXpS/T motif and is negatively regulated by Akt2. In addition, Akt2 depletion resulted in pronounced changes in the kinetics of phosphorylation of some substrates more than in their maximal phosphorylation level (Fig. 5A, band III, and Fig. 5F).
Effects of WDFY2 Depletion on Akt Substrate Phosphorylation
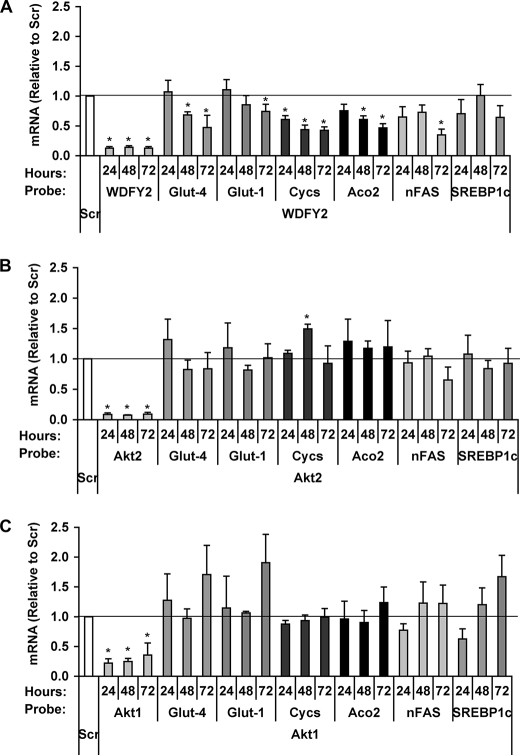
In cells depleted of WDFY2 (Fig. 5B, right), phosphorylation of Akt and of virtually all substrates detected with the PAS antibody was significantly reduced at all time points measured. This decrease in substrate phosphorylation was consistently more pronounced in WDFY2-depleted than in Akt2-depleted cells (compare lower right panels in Fig. 5, A and B). Moreover, the phosphorylation of substrates such as bands IV and V, which was increased by Akt2 depletion, was also impaired by WDFY2 depletion (Fig. 5, A, B, G, and H). The broader cellular requirements for WDFY2 than for Akt2 are also reflected by changes in gene expression patterns following knockdown of these two proteins (Fig. 6). Indeed, we found that expression levels of numerous adipogenic and metabolic genes, including Glut-4, Glut-1, Cycs, Aco2, and nFAS, were more significantly decreased after WDFY2 knockdown than after individual Akt2 or Akt1 knockdowns, consistent with the finding that WDFY2 depletion impairs adipocyte differentiation (34). The finding that WDFY2 depletion has a broader effect on insulin-stimulated RXRXXpS/T substrate phosphorylation than depletion of Akt2 could reflect the need for WDFY2 for the activity of other insulin-sensitive kinases that can phosphorylate this motif. Also, it is possible that Akt1 may phosphorylate these substrates in Akt2-depleted cells, and WDFY2 may be necessary for this compensatory function of Akt1, even though under normal conditions it interacts preferentially with Akt2.
FIGURE 6.
Differential effects of WDFY2 and Akt2 knockdown on mRNA of proteins key to adipocyte function. 3T3-L1 adipocytes were transfected with Scr, WDFY2 (A), Akt2 (B), or Akt1 (C) siRNA on day 4 of differentiation. Samples collected 24, 48, or 72 h after transfection were assayed for mRNA levels of WDFY2, Akt2, and Akt1, respectively, in addition to Glut-4, Glut-1, Cycs, Aco2, nFAS, and SREBP1c using qRT-PCR (n = 4, mean ± S.E. (error bars), p < 0.01, Student's t test).
Preferential Interaction of WDFY2 with Akt2 Compared with Akt1
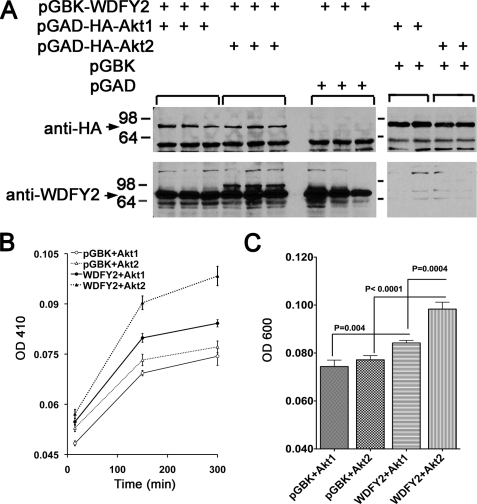
The preferential co-localization of Akt2 in endosomes containing WDFY2 and the finding that knockdown of WDFY2 preferentially affects the levels and activity of Akt2 suggest a preferential interaction between WDFY2 and Akt2 in vivo. All Akt isoforms share 80% homology at the amino acid level throughout the functional domains common to all Akt isoforms. The isoform specificity of WDFY2 binding may result from a higher affinity in the interaction between the WD domains of WDFY2 with Akt2 compared with Akt1. These differences, however, are lost in overexpression studies, where WDFY2 can interact with Akt1 when both proteins are co-expressed (22) (data not shown). The difficulty in recapitulating isoform-specific behaviors of Akt isoforms upon overexpression has also been noted in studies describing a differential interaction of Akt isoforms with PH domain leucine-rich repeat protein phosphatases (35). To determine whether a significant difference exists in the ability of WDFY2 to interact with Akt1 or Akt2, we analyzed the interactions between full-length WDFY2 and full-length, hemagglutinin-tagged constructs of Akt2 and Akt1 in a quantitative yeast two-hybrid assay (Fig. 7A). A significant albeit weak interaction between WDFY2 and full-length Akt1 and Akt2 was detected by both growth and α-galactosidase in this assay, and the interaction of WDFY2 with Akt2 was significantly greater than that with Akt1 (Fig. 7, B and C). These results indicate that subtle structural differences between these isoforms affect the affinity for WDFY2. These differences may be functionally relevant in mammalian cells, accounting for the differential localization of Akt2 and its sensitivity to WDFY2 levels.
FIGURE 7.
Interactions between WDFY2 and Akt1 or Akt2 in a yeast two-hybrid assay. Yeast were co-transformed with the indicated vectors and grown as described under “Experimental Procedures.” A, cells were lysed and analyzed by immunoblotting with anti-HA or anti-WDFY2 antibodies to confirm similar levels of expression of both Akts and expression of WDFY2 proteins. B, cells were added to 96-well multiwell dishes, and α-galactosidase expression was measured over time. Similar results were obtained when measuring growth. C, quantification of growth after 300 min, where the statistical significance of the differences was calculated by two-tailed Student's t tests, is indicated in the figure.
DISCUSSION
The mechanisms by which the different isoforms of Akt control specific aspects of cell function are not fully understood. Here, we find that the endosomal protein WDFY2 interacts preferentially with endogenous Akt2 and promotes the maintenance of Akt2 protein levels. This interaction is critical, as depletion of WDFY2 leads to generalized impairment in downstream substrate phosphorylation and in downstream effects of Akt2, such as insulin-stimulated glucose transport. Together with recent work demonstrating an important role for the endosomal protein APPL1 in the stimulation by Akt2 of glucose transporter translocation, our results underscore the critical role of the endocytic pathway in insulin signaling through Akt, and in fine tuning the specific roles of Akt isoforms in cell physiology. Thus, further experiments in vitro with purified proteins will be necessary to determine the structural basis and the detailed kinetics of the interactions between WDFY2 and each Akt isoform, to determine whether this mechanism could account for our observations in live cells.
Indirect mechanisms could also underlie the isoform-specific interaction between endogenous Akt2 and WDFY2. Immunofluorescence analysis of endogenous Akt1 and Akt2 shown here indicates a substantial amount of these kinases sequestered in the nucleus. Thus, subtle changes in the extent of nuclear translocation may lead indirectly to a preferential interaction of Akt2 with endosomal components. Further experiments to analyze the general determinants of Akt subcellular localization are necessary to test this hypothesis.
A salient effect of WDFY2 depletion is a decrease in total protein levels of Akt2, raising the question of how steady-state levels of Akt isoforms are controlled. The decrease in Akt2 protein levels seen in WDFY2-depleted cells occurs prior to a decrease in Akt2 mRNA levels, suggesting that posttranscriptional mechanisms such as increased degradation may be involved. Ubiquitination and degradation of Akt have been demonstrated to occur and be important during the establishment of neuronal polarity (36). Ubiquitination and degradation of Akt have also been implicated in the induction of insulin resistance by tumor necrosis factor and in tumorigenesis (37, 38). However, it is not known whether the turnover of Akt1 and Akt2 proceeds at different rates or is controlled by distinct mechanisms. The association of Akt2 with WDFY2 on early endosomes may protect the kinase from ubiquitination and proteosomal degradation, whereas the sequestration of Akt1 in the nucleus may fulfill a similar protective role.
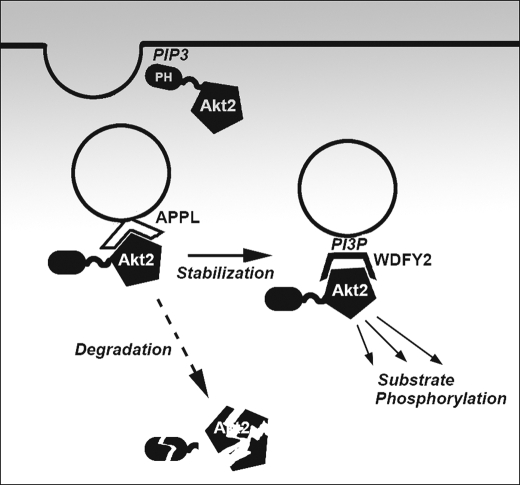
The findings that Akt interacts with two proteins that are localized to endosomes raises the possibility that these interactions may be functionally related. APPL1 has been shown to interact in adipocytes with Akt2, and its depletion leads to impairments in insulin-stimulated Akt phosphorylation and glucose uptake (20). Paradoxically, overexpression of full-length APPL1 also suppresses insulin action (20). These results, together with recent studies suggesting that APPL-enriched endosomes become enriched in WDFY2 as they lose APPL (8), suggest a model in which Akt2 may be transferred from APPL to WDFY2 to allow sustained substrate phosphorylation by this kinase (Fig. 8). Knockout of APPL may impair insulin action by preventing the initial localization of Akt2 to the endocytic pathway, but overexpression may then impair the transfer of Akt2 to WDFY2. A role for WDFY2 in sustaining Akt2 signaling is suggested by immunofluorescence data where cells overexpressing WDFY2 display enhanced phospho-Akt staining in response to insulin (data not shown). Further experiments imaging Akt dynamics relative to APPL and WDFY2 in live cells will be required to test this hypothesis.
FIGURE 8.
Model for role of WDFY2 in endosomal control of Akt2 signaling. In this model the initial event in Akt2 activation is the interaction of its PH domain with phosphatidylinositol 3,4,5-trisphosphate (PIP3) generated at the plasma membrane. Subsequently, the kinase interacts with APPL in the initial phase of endocytosis, when the levels of phosphatidylinositol 3,4,5-trisphosphate decrease. Phosphatidylinositol 3-phosphate (PI3P) is then generated, and WDFY2 replaces APPL on endosomes. Akt2 binds to WDFY2 and becomes stabilized and protected from degradation. Substrate phosphorylation can proceed from WDFY2-enriched endosomes.
Acknowledgments
We thank James Young and Alison Burkart for helpful suggestions during the course of this work.
This work was supported, in whole or in part, by NIDDK/National Institutes of Health Grant 5 P30 DK32520 (to the imaging core services) and by Grant DK60837.
- AAPL
- adaptor protein containing PH domain, PTB domain, and leucine zipper motif
- siRNA
- small interfering RNA
- qRT-PCR
- quantitative real-time PCR
- Scr
- scrambled
- pAkt(473)
- phospho-specific antibody to Akt serine 473
- EEA1
- early endosome antigen-1
- X-α-gal
- 5-bromo-4-chloro-3-indolyl α-d-galactopyranoside.
REFERENCES
- 1.Lakadamyali M., Rust M. J., Zhuang X. (2006) Cell 124, 997–1009 [DOI] [PMC free article] [PubMed] [Google Scholar]
- 2.Leonard D., Hayakawa A., Lawe D., Lambright D., Bellve K. D., Standley C., Lifshitz L. M., Fogarty K. E., Corvera S. (2008) J. Cell Sci. 121, 3445–3458 [DOI] [PMC free article] [PubMed] [Google Scholar]
- 3.Corvera S., D'Arrigo A., Stenmark H. (1999) Curr. Opin. Cell Biol. 11, 460–465 [DOI] [PubMed] [Google Scholar]
- 4.Driscoll P. C. (2001) Nat. Struct. Biol. 8, 287–290 [DOI] [PubMed] [Google Scholar]
- 5.Leevers S. J., Vanhaesebroeck B., Waterfield M. D. (1999) Curr. Opin. Cell Biol. 11, 219–225 [DOI] [PubMed] [Google Scholar]
- 6.Lindmo K., Stenmark H. (2006) J. Cell Sci. 119, 605–614 [DOI] [PubMed] [Google Scholar]
- 7.Hayakawa A., Leonard D., Murphy S., Hayes S., Soto M., Fogarty K., Standley C., Bellve K., Lambright D., Mello C., Corvera S. (2006) Proc. Natl. Acad. Sci. U.S.A. 103, 11928–11933 [DOI] [PMC free article] [PubMed] [Google Scholar]
- 8.Zoncu R., Perera R. M., Balkin D. M., Pirruccello M., Toomre D., De Camilli P. (2009) Cell 136, 1110–1121 [DOI] [PMC free article] [PubMed] [Google Scholar]
- 9.Kittler J. T., Moss S. J. (2001) Traffic 2, 437–448 [DOI] [PubMed] [Google Scholar]
- 10.Raiborg C., Bache K. G., Mehlum A., Stenmark H. (2001) Biochem. Soc. Trans. 29, 472–475 [DOI] [PubMed] [Google Scholar]
- 11.Wiley H. S., Burke P. M. (2001) Traffic 2, 12–18 [DOI] [PubMed] [Google Scholar]
- 12.von Zastrow M. (2001) Biochem. Soc. Trans. 29, 500–504 [DOI] [PubMed] [Google Scholar]
- 13.Mosesson Y., Mills G. B., Yarden Y. (2008) Nat. Rev. Cancer 8, 835–850 [DOI] [PubMed] [Google Scholar]
- 14.Di Guglielmo G. M., Le Roy C., Goodfellow A. F., Wrana J. L. (2003) Nat. Cell Biol. 5, 410–421 [DOI] [PubMed] [Google Scholar]
- 15.Hayes S., Chawla A., Corvera S. (2002) J. Cell Biol. 158, 1239–1249 [DOI] [PMC free article] [PubMed] [Google Scholar]
- 16.Miaczynska M., Christoforidis S., Giner A., Shevchenko A., Uttenweiler-Joseph S., Habermann B., Wilm M., Parton R. G., Zerial M. (2004) Cell 116, 445–456 [DOI] [PubMed] [Google Scholar]
- 17.Lin D. C., Quevedo C., Brewer N. E., Bell A., Testa J. R., Grimes M. L., Miller F. D., Kaplan D. R. (2006) Mol. Cell. Biol. 26, 8928–8941 [DOI] [PMC free article] [PubMed] [Google Scholar]
- 18.Mao X., Kikani C. K., Riojas R. A., Langlais P., Wang L., Ramos F. J., Fang Q., Christ-Roberts C. Y., Hong J. Y., Kim R. Y., Liu F., Dong L. Q. (2006) Nat. Cell Biol. 8, 516–523 [DOI] [PubMed] [Google Scholar]
- 19.Nechamen C. A., Thomas R. M., Dias J. A. (2007) Mol. Cell. Endocrinol. 260–262, 93–99 [DOI] [PMC free article] [PubMed] [Google Scholar]
- 20.Saito T., Jones C. C., Huang S., Czech M. P., Pilch P. F. (2007) J. Biol. Chem. 282, 32280–32287 [DOI] [PubMed] [Google Scholar]
- 21.Schenck A., Goto-Silva L., Collinet C., Rhinn M., Giner A., Habermann B., Brand M., Zerial M. (2008) Cell 133, 486–497 [DOI] [PubMed] [Google Scholar]
- 22.Fritzius T., Burkard G., Haas E., Heinrich J., Schweneker M., Bosse M., Zimmermann S., Frey A. D., Caelers A., Bachmann A. S., Moelling K. (2006) Biochem. J. 399, 9–20 [DOI] [PMC free article] [PubMed] [Google Scholar]
- 23.Fritzius T., Frey A. D., Schweneker M., Mayer D., Moelling K. (2007) FEBS J 274, 1552–1566 [DOI] [PubMed] [Google Scholar]
- 24.Dummler B., Hemmings B. A. (2007) Biochem. Soc. Trans. 35, 231–235 [DOI] [PubMed] [Google Scholar]
- 25.Franke T. F. (2008) Oncogene 27, 6473–6488 [DOI] [PubMed] [Google Scholar]
- 26.Hanada M., Feng J., Hemmings B. A. (2004) Biochim. Biophys. Acta 1697, 3–16 [DOI] [PubMed] [Google Scholar]
- 27.Cho H., Mu J., Kim J. K., Thorvaldsen J. L., Chu Q., Crenshaw E. B., III, Kaestner K. H., Bartolomei M. S., Shulman G. I., Birnbaum M. J. (2001) Science 292, 1728–1731 [DOI] [PubMed] [Google Scholar]
- 28.Garofalo R. S., Orena S. J., Rafidi K., Torchia A. J., Stock J. L., Hildebrandt A. L., Coskran T., Black S. C., Brees D. J., Wicks J. R., McNeish J. D., Coleman K. G. (2003) J. Clin. Invest. 112, 197–208 [DOI] [PMC free article] [PubMed] [Google Scholar]
- 29.Cho H., Thorvaldsen J. L., Chu Q., Feng F., Birnbaum M. J. (2001) J. Biol. Chem. 276, 38349–38352 [DOI] [PubMed] [Google Scholar]
- 30.Easton R. M., Cho H., Roovers K., Shineman D. W., Mizrahi M., Forman M. S., Lee V. M., Szabolcs M., de Jong R., Oltersdorf T., Ludwig T., Efstratiadis A., Birnbaum M. J. (2005) Mol. Cell. Biol. 25, 1869–1878 [DOI] [PMC free article] [PubMed] [Google Scholar]
- 31.Jiang Z. Y., Zhou Q. L., Coleman K. A., Chouinard M., Boese Q., Czech M. P. (2003) Proc. Natl. Acad. Sci. U.S.A. 100, 7569–7574 [DOI] [PMC free article] [PubMed] [Google Scholar]
- 32.Bellve K. D., Leonard D., Standley C., Lifshitz L. M., Tuft R. A., Hayakawa A., Corvera S., Fogarty K. E. (2006) J. Biol. Chem. 281, 16139–16146 [DOI] [PubMed] [Google Scholar]
- 33.Evans D. R., Swirsding K. A., Taillon B. E., Simons J. F. (2004) BioTechniques 37, 840–843 [DOI] [PubMed] [Google Scholar]
- 34.Fritzius T., Moelling K. (2008) EMBO J. 27, 1399–1410 [DOI] [PMC free article] [PubMed] [Google Scholar]
- 35.Brognard J., Sierecki E., Gao T., Newton A. C. (2007) Mol. Cell 25, 917–931 [DOI] [PubMed] [Google Scholar]
- 36.Yan D., Guo L., Wang Y. (2006) J. Cell Biol. 174, 415–424 [DOI] [PMC free article] [PubMed] [Google Scholar]
- 37.Medina E. A., Afsari R. R., Ravid T., Castillo S. S., Erickson K. L., Goldkorn T. (2005) Endocrinology 146, 2726–2735 [DOI] [PubMed] [Google Scholar]
- 38.Xiang T., Ohashi A., Huang Y., Pandita T. K., Ludwig T., Powell S. N., Yang Q. (2008) Cancer Res. 68, 10040–10044 [DOI] [PMC free article] [PubMed] [Google Scholar]


