Abstract
Adipocyte differentiation is a well defined process that is under the control of transcriptional activators and repressors. We show that histone deacetylase (HDAC) inhibitors efficiently block adipocyte differentiation in vitro. This effect is specific to adipogenesis, as another mesenchymal differentiation process, osteoblastogenesis, is enhanced upon HDAC inhibition. Through the systematic genetic deletion of HDAC genes in cultured mesenchymal precursor cells, we show that deletion of HDAC1 and HDAC2 leads to reduced lipid accumulation, revealing redundant and requisite roles of these class I HDACs in adipogenesis. These findings unveil a previously unrecognized role for HDACs in the control of adipogenesis.
Keywords: Cell/Apoptosis, Lipid/Fatty Acid, Cell Differentiation, Gene Regulation, Stem Cell, HDAC1, HDAC2, Adipogenesis, Anti-obesity Therapeutics, Gene Regulation
Introduction
In humans, unused caloric energy resulting from an excessive net caloric intake is converted to triglycerides and stored in fat depots for further usage. In principle, the fat mass of these depots can increase either by hypertrophy (an increase of adipocyte size) or by hyperplasia (and increase in adipocyte number). It has been recently demonstrated that fat cell number is primarily determined by early adulthood and that subsequent changes in fat mass occur mainly through increases in adipocyte volume (1). However, ∼10% of fat cells are renewed annually in adults. The molecular mechanisms driving the turnover of adipocyte tissue in adults are incompletely understood, but it has been speculated that a combination of cell death and neo-adipogenesis from mesenchymal precursor cells is responsible for maintaining the fat cell number pre-set in early adulthood (1).
Adipogenesis is a tightly orchestrated process in which mesenchymal precursor cells differentiate into mature fat cells and express batteries of genes encoding enzymes involved in lipid biosynthesis, transport, and storage. This process is under the control of a cascade of well characterized transcription factors, including C/EBPβ,3 SREBPs, and PPARγ (2). Studies in cultured cells have shown that these adipogenic core transcription factors interact with histone acetyltransferases, which stimulate transcription by acetylating nucleosomal histones, thereby relaxing chromatin structure (3). Histone deacetylases (HDACs), a conserved family of chromatin-modifying enzymes that repress transcription by deacetylating nucleosomal histones, also associate with these adipogenic transcription factors (3), counteracting the functions of histone acetyltransferases. Thus, in the classic model of adipocyte differentiation, HDACs are thought to inhibit the adipogenic program by directly repressing the transcriptional activity of pro-adipogenic transcription factors (4).
There are five classes of HDACs that display distinct patterns of expression, regulation, and substrate preference. Class I HDACs (HDAC1, -2, -3, and -8) are expressed in a wide range of tissues and efficiently deacetylate histones (5). In contrast, class IIa HDACs (HDAC4, -5, -7, and -9) display preferential expression in muscle and neural tissues and contain a divergent catalytic domain that has minimal catalytic activity and is not required for transcriptional repression. Class IIb HDACs (HDAC6 and -10) are the main cytoplasmic deacetylases, whereas Class III HDACs, also called sirtuins, are mainly nuclear and use NAD as a substrate (5). Little is known about the class IV HDAC, HDAC11 (5).
The activity of class I HDACs can be efficiently blocked by pharmacological inhibitors (such as suberoylanilide hydroxamic acid (SAHA, Zolinza®)), and this inhibition is well tolerated in humans. In this regard, we and others have shown that HDAC inhibitors prevent pathological cardiac growth and remodeling in response to numerous forms of stress (6–8). Recently, the FDA approved the HDAC inhibitor SAHA for the treatment of cutaneous T-cell lymphoma (9). Many other clinical trials have been performed to test the efficacy of different HDAC inhibitors as anticancer agents (10). HDAC inhibitors also enhance long term memory in animal models of dementia and improve the symptoms in several models of neurodegenerative disease (11–14). Remarkably, HDAC inhibition has also been reported to enhance lifespan in lower eukaryotes (15–17). The precise mechanisms and molecular targets that mediate these actions of HDAC inhibitors in vivo remain to be defined and represent a major issue in the field.
In the course of studying the role of different HDAC isoforms in development, we and others found that deletion of HDAC3 leads to a profound pro-adipogenic phenotype in liver and heart, indicative of an inhibitory role of this HDAC in adipogenesis (18, 19). This prompted us to study the role of the different HDAC isoforms in this process. Here, we show that pharmacological HDAC inhibition leads to a robust block of adipogenesis in vitro. By genetic deletion of class I HDACs in mesenchymal precursor cells, we demonstrate that HDAC1 and -2 play redundant roles as positive regulators of adipogenesis.
EXPERIMENTAL PROCEDURES
Cell Culture and Adipocyte Differentiation
3T3-L1 cells were cultured in Dulbecco's modified Eagle's medium supplemented with 10% fetal calf serum and antibiotics. Mouse embryonic fibroblasts were prepared from embryonic day (E) 12.5 embryos and cultured in Dulbecco's modified Eagle's medium supplemented with 10% fetal calf serum and antibiotics.
Lentiviral infections of mouse embryonic fibroblasts were performed according to a modified version of previously described methods (20). Briefly, 293T cells were cultured in Dulbecco's modified Eagle's medium supplemented with 10% fetal bovine serum and antibiotics. The cells were then transfected with either GFP-CRE or GFP-deleted CRE fusion vectors using FuGENE (Roche Applied Science). After 12 h of transfection, the cells were incubated with fresh medium. At 36 h post-transfection, the medium containing the lentiviruses was collected, added with Polybrene (4 μg/ml), filtered, and transferred to the target cells.
Primary, calvarial pre-osteoblasts were isolated as previously described (21). In brief, murine pre-osteoblasts were isolated from 1.5-day-old pups and cultured in Dulbecco's modified Eagle's medium containing 10% fetal bovine serum. After reaching confluence, the pre-osteoblasts were induced to differentiate for 14 days using 50 μg/ml ascorbic acid, 10 mm β-glycerophosphate, and 100 nm dexamethasone. The calcified matrix deposited by the mature osteoblasts was visualized using silver nitrate staining. Briefly, cells were fixed in 10% formalin for 10 min, stained with 5% silver nitrate, and refixed in 5% sodium thiosulfate for 5 min.
To induce adipogenesis and accumulation of lipid droplets in 3T3-L1 and mouse embryonic fibroblasts, cells were cultured to confluence, and after 48 h (time 0) they were incubated with 1.72 μm insulin (Sigma), 625 nm dexamethasone (Sigma), 2 μm rosiglitazone (Cayman Chemical), and 0.5 mm isobutylmethylxanthine (Sigma) for 2 days. The cell culturing medium was then supplemented with only 1.72 μm insulin, 625 nm dexamethasone, and 2 μm rosiglitazone for 6 additional days, changing the medium every 48 h. Eventually, either TSA (Sigma), Scriptaid (Calbiochem), SAHA (Calbiochem), sodium butyrate, sodium propionate, or sodium acetate (Sigma) were added to the medium as stated in the text.
Lipids accumulated within the cells were visualized by Oil red O staining. Briefly, cells were fixed in 10% formalin for 10 min and stained for 2 h. Quantification of the amount of fat accumulated in the cells was performed by resolubilization of the Oil red O with isopropyl alcohol and spectrophotometric reading of the obtained solution at 515 nm.
Histology
Tissues were fixed in 4% paraformaldehyde, embedded in paraffin, and sectioned at 5-μm intervals. Sections were stained with hematoxylin and eosin using standard procedures. For neutral lipid staining, hearts were fixed in 4% paraformaldehyde, cryoembedded, stained with Oil red O, and counterstained with hematoxylin.
Indirect Immunofluorescence
3T3-L1 cells were plated onto glass coverslips and cultured until confluence. To detect C/EBPβ, post-confluent cells were induced to differentiate as described above for 18 h and eventually incubated with 100 nm TSA (Sigma). Cells were then fixed, blocked with bovine serum albumin, and incubated with anti-C/EBPβ primary antibody (mouse monoclonal, 1:200 dilution, Santa Cruz Biotechnology) for 1 h at room temperature. For BrdUrd labeling, post-confluent cells were induced to differentiate and incubated with 30 μg/ml BrdUrd for 4 h. Cells were then fixed, treated with 1.5 m HCl, permeabilized, blocked with bovine serum albumin, and incubated with anti-BrdUrd primary antibody (mouse monoclonal, 1:200 dilution, Roche Applied Science) for 1 h at room temperature. Coverslips were then washed 5 times with phosphate-buffered saline, and incubated with fluorescein isothiocyanate-conjugated secondary antibody (1:200 dilution, Vector Laboratories). After washing, coverslips were mounted on glass slides using VectaShield mounting medium with 4′,6-diamidino-2-phenylindole (Vector Laboratories), and visualized with a fluorescence microscope.
Gene Expression Profiling and RT-PCR
Total RNA was purified from cells using TRIzol reagent according to manufacturer's instructions. Quantitative real-time PCR was performed using TaqMan probes purchased from ABI. A probe for 18 S cDNA was used to normalize the amount of starting template entering the amplification step. For RT-PCR, total RNA served as template for reverse transcription using random hexamer primers. Primer sequences are available on request.
RESULTS
HDAC Inhibitors Block Adipogenesis in Vitro
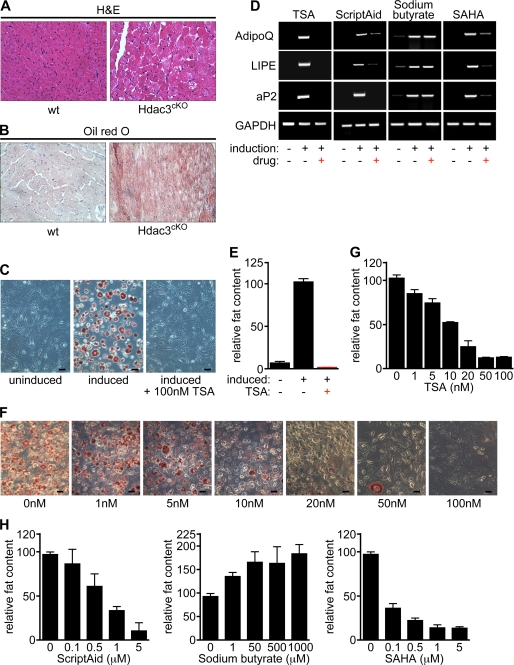
We have previously shown that deletion of HDAC3 in the heart leads to the dysregulation of a gene program associated with fatty acid uptake and oxidation leading to dramatic myocardial lipid accumulation (Fig. 1, A and B). This phenotype is not seen in cardiomyocytes deficient for either HDAC1, HDAC2, or HDAC8, indicating that fatty acid and adipocyte homeostasis might be under the control of distinct HDAC isoforms (19, 22).
FIGURE 1.
HDAC inhibitors block adipogenesis in vitro. A, deletion of HDAC3 in cardiomyocytes leads to cardiomyopathy as shown by hematoxylin and eosin staining of histological sections of wild-type and HDAC3-null hearts. B, lipid accumulation in heart tissue lacking HDAC3 visualized by staining with Oil Red O (ORO) following a 24-h fasting. Red staining indicates the presence of neutral lipids. C, treatment of pre-adipocytes (3T3-L1 cells) with a hormone inducer mixture for 8 days led to effective adipogenesis, which can be monitored by staining with ORO. Adipocyte differentiation is completely blocked by 100 nm TSA. Size bars: 60 μm. D, up-regulation of adipogenic marker genes in induced 3T3-L1 cells is blocked by incubation with TSA, Scriptaid, and SAHA but not sodium butyrate as shown by RT-PCR for different markers of terminally differentiated adipocytes, such as hormone-sensitive lipase (LIPE), adiponectin (AdipoQ), and adipocyte lipid-binding protein (aP2). Glyceraldehyde-3-phosphate dehydrogenase (GAPDH) was detected as a control. E, quantification of adipogenesis in 3T3-L1 cells as shown in panel C by measuring the absorbance of resolubilized ORO. Treatment of 3T3-L1 cells induced to differentiate with 100 nm TSA causes the almost complete block of adipocyte differentiation. F and G, reduced adipocyte differentiation at various concentrations of TSA shows a dose-response correlation. H, treatment of 3T3-L1 cells with Scriptaid or SAHA causes the block of adipocyte differentiation in a dose-response manner. On the contrary, treatment of 3T3-L1 cells with the short-chain fatty acid sodium butyrate enhances lipid accumulation.
As a first step toward exploring the potential role of HDAC activity in adipogenesis, we treated the 3T3-L1 pre-adipocyte cell line with the pan-HDAC inhibitor trichostatin A (TSA). Adipogenic induction of 3T3-L1 cells with isobutylmethylxanthine, insulin, and dexamethasone results in robust adipogenesis within 8 days, which can be monitored by Oil Red O staining (ORO) of lipid droplet accumulation. In contrast, the treatment of 3T3-L1 cells with TSA led to a complete block of adipogenesis as measured by the lack of ORO-positive fat accumulation and the failure to up-regulate the expression of adipocyte-specific marker genes, including hormone-sensitive lipase (LIPE), adiponectin (AdipoQ), and adipocyte lipid-binding protein (aP2) (Fig. 1, C–E). This inhibition was dose-dependent and occurred at concentrations of TSA as low as 10–50 nm (Fig. 1, F and G).
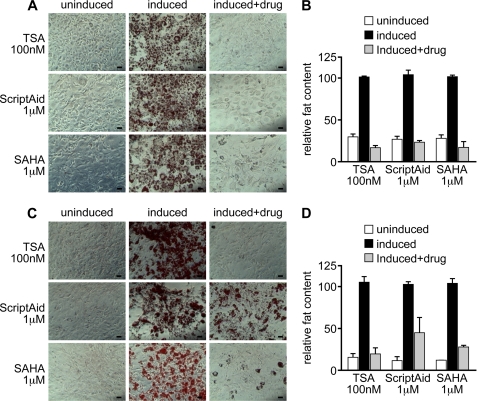
We next tested whether inhibition of adipogenesis is specific to TSA and 3T3-L1 cells or if it extends to different inhibitors and different in vitro systems. In addition to TSA, the HDAC inhibitors Scriptaid as well as the recently FDA-approved inhibitor SAHA robustly blocked adipocyte differentiation in 3T3-L1 cells (Figs. 1D, 1H, 2A, and 2B and supplemental Fig. S1A) as well as in mouse embryonic fibroblasts (MEFs) (Fig. 2, C and D).
FIGURE 2.
Different HDAC inhibitors block adipogenesis in multiple in vitro differentiation systems. Different HDAC inhibitors (TSA, Scriptaid, and SAHA) block adipocyte differentiation in either 3T3-L1 cells (A and B) or mouse embryonic fibroblasts (C and D). In A and C, 3T3-L1 cells and mouse embryonic fibroblasts, respectively, were induced to differentiate using a hormone inducer cocktail for 8 days and treated with various HDAC inhibitors at different concentrations, as stated in the text. In B and D, the lipids accumulated within the cells were stained with Oil Red O and quantified by resolubilization with isopropanol. Size bars: 60 μm.
Fatty Acids Such as Sodium Butyrate Enhance Adipogenesis
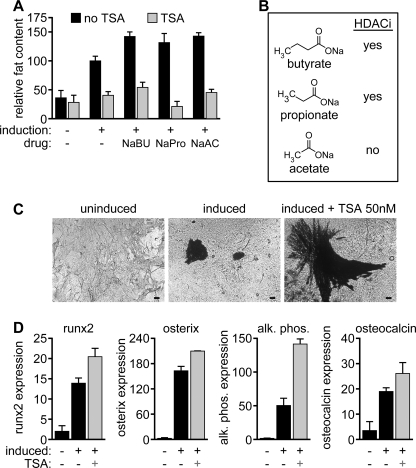
There is disagreement as to the role of HDAC inhibitors in adipogenesis. Some reports have described an enhancement of adipogenesis upon HDAC inhibition (23). Notably, in these reports the authors use the short-chain fatty acid (SCFA) sodium butyrate as an HDAC inhibitor (23, 24). Because SCFAs have been described as pro-adipogenic (25, 26), we examined the effect of butyrate and other SCFAs on adipocyte differentiation. Indeed, treatment of 3T3-L1 cells with sodium butyrate increased adipogenesis as measured by ORO quantification (Figs. 1D, 1H, 3A, and 3B and supplemental Fig. S1A). This effect, however, was completely blocked by co-incubation with TSA. In addition, treatment of 3T3-L1 cells with other SCFAs such as sodium propionate and sodium acetate increased adipogenesis, and again this effect was completely abolished by TSA (Fig. 3A). Of the tested SCFAs, sodium propionate had little, and sodium acetate had a negligible effect on HDAC activity (27, 28), indicating that the enhancing effect of SCFAs on adipogenesis is independent of an effect on HDAC activity.
FIGURE 3.
Effects of fatty acids and HDAC inhibitors on adipogenesis and osteoblastogenesis. A and B, treatment of 3T3-L1 cells with the short chain fatty acid HDAC inhibitors sodium butyrate (1 mm) and sodium propionate (1 mm) enhances adipogenesis. This effect is completely abolished by TSA (100 nm). The short-chain fatty acid sodium acetate also enhances adipogenesis without having HDAC activity. C and D, primary, calvarial pre-osteoblasts were isolated and induced to differentiate. Calcified matrix deposited by mature osteoblasts was visualized using silver nitrate staining. Size bars: 60 μm. Expression of osteoblast-specific markers (Runx2, Osterix, Alkaline Phosphatase, and Osteocalcin) was determined by quantitative real-time PCR.
HDAC Inhibition Enhances Osteogenesis
To test whether the inhibitory effect of HDAC inhibitors was specific to adipogenesis or represented a more general block of mesenchymal cell differentiation, we examined the effect of TSA on primary pre-osteoblasts, which terminally differentiate and secrete mineralized matrix in vitro. Treatment of pre-osteoblasts with TSA enhanced differentiation, as measured by the production of silver-stainable calcified matrix (Fig. 3C). Additionally, expression of the osteoblast markers Runt-related transcription factor 2 (Runx2), Osterix, Alkaline Phosphatase, and Osteocalcin was increased upon TSA treatment (Fig. 3D).
HDAC Inhibitors Act Upstream of PPARγ to Block Adipogenesis
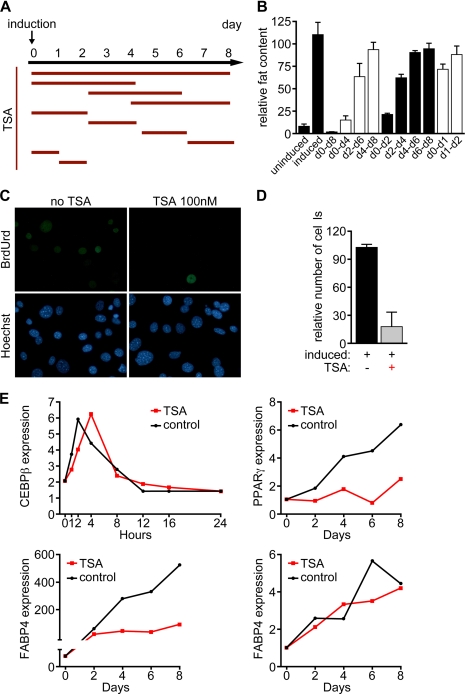
To define the temporal window in the pathway of adipogenesis in which HDAC inhibitors act, we performed a detailed time-course analysis of the actions of TSA on 3T3-L1 cells. Treatment for the first 48 h after induction almost completely blocked adipocyte differentiation, whereas treatment at later time points had only minor effects (Fig. 4, A and B). In support of the evidence that TSA acts early in the cascade of events that define the adipogenic program, TSA treatment of 3T3-L1 cells led to a dramatic reduction of proliferation during the clonal expansion phase of adipocyte differentiation, as measured by BrdUrd incorporation (Fig. 4, C and D).
FIGURE 4.
Time course analysis of adipogenic inhibition by TSA. A and B, 3T3-L1 cells were induced to differentiate at day 0 with a hormone inducer mixture and treated with TSA (100 nm). Red bars in A are representative of the duration of the TSA treatment. Quantification of the fat accumulated in 3T3-L1 cells was performed by ORO staining and resolubilization of the dye bound to the lipid droplets within the cells with isopropanol. Incubation of 3T3-L1 cells with TSA (100 nm) for the first 48 h of adipogenesis induction mediated most of the inhibitory effect. C and D, TSA leads to a dramatic reduction of proliferation during the clonal expansion phase of adipocyte differentiation as measured by BrdUrd incorporation. C, immunofluorescence in 3T3-L1 cells induced to differentiate into adipocytes using anti-BrdUrd antibody after a 4-h pulse with BrdUrd. Hoechst staining was used to visualize cell nuclei. D, quantification of the BrdUrd-positive cells in C. E, transcriptional profiling of adipogenic marker genes shows that the TSA treatment blocks the expression of PPARγ and Fabp4 but does not reduce the extent of the up-regulation of SREBP-1c or C/EBPβ transcription.
We next profiled the expression of several adipocyte markers by quantitative real-time PCR. Treatment with TSA led to a significant down-regulation of the late adipocyte marker aP2 (adipocyte lipid-binding protein, also known as Fabp4). The expression of PPARγ, a mid to late marker of adipogenesis, was also significantly reduced by TSA treatment. However, the expression of SREBP-1c, as well as the expression of C/EBPβ, an early marker of adipogenesis was relatively insensitive to TSA (Fig. 4, E–H). Similar results were obtained with the other HDAC inhibitors Scriptaid and SAHA (supplemental Fig. S1, B and D). As expected, treatment of 3T3-L1 cells with the short chain fatty acid sodium butyrate did not result in the down-regulation of the adipocyte markers examined (supplemental Fig. S1C). We conclude that HDAC inhibitors act upstream of PPARγ but downstream of C/EBPβ to control adipogenesis.
Redundant Control of Adipogenesis by HDAC1 and HDAC2
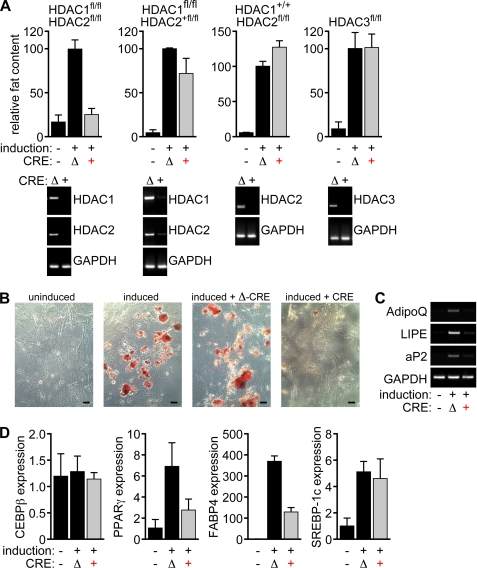
In an effort to identify the specific HDAC isoforms responsible for the actions of HDAC inhibitors on the adipogenic program, we generated embryonic fibroblasts from mice with conditional alleles for HDAC1, -2, and -3. After deletion using lentiviral Cre delivery, cells were differentiated using isobutylmethylxanthine, dexamethasone, insulin, and rosiglitazone. Deletion of any of these three HDACs individually had no discernable influence on adipogenesis (Fig. 5). Because HDAC1 and -2 have been shown to act redundantly to regulate various gene programs in other cell types, we also generated fibroblasts from mice with compound conditional alleles encoding these isoforms. As shown in Fig. 5, deletion of HDAC1 and -2 together led to an almost complete block of adipogenesis. In contrast, adipogenesis occurred normally when only three of the four alleles of HDAC1 and -2 were deleted. These results demonstrate that HDAC1 and HDAC2 redundantly control adipogenesis.
FIGURE 5.
Genetic deletion of HDAC1 and HDAC2 blocks adipogenesis. Primary MEFs with the indicated genotypes were generated and genetic deletion was achieved using lentiviral Cre delivery. In detail, MEFs with different combinations of floxed alleles for HDAC1 and HDAC2 were obtained from E12.5 embryos. Subsequently the MEFs were infected with Cre-expressing lentiviruses or deleted Cre-expressing lentiviruses. After 8 days of adipogenesis induction using a hormone inducer mixture, the MEFs were stained with ORO. The red dye bound to the lipid droplets within the differentiated MEFs was resolubilized in isopropanol for the quantification of fat accumulation. A, deletion of HDAC3, as well as deletion of up to three alleles of HDAC1 and HDAC2, is not sufficient to significantly affect the extent of lipid accumulation within the MEFs. On the other hand, deletion of all four alleles of HDAC1 and HDAC2 completely blocks adipogenesis. Efficiency of Cre-mediated take-out was tested by RT-PCR. Glyceraldehyde-3-phosphate dehydrogenase (GAPDH) was detected as a control. B, ORO staining of uninduced MEFs, MEFs induced to differentiate into adipocytes, and MEFs infected with either GFP-Cre-expressing lentiviruses (CRE) or GFP-deleted Cre-expressing lentiviruses (Δ-CRE) after 8 days of adipogenesis induction. Size bars: 60 μm. C and D, up-regulation of adipogenic marker genes in MEFs is blocked upon deletion of HDAC1 and HDAC2 after 8 days of induction of adipogenesis as shown by RT-PCR and quantitative real-time PCR for different markers of terminally differentiated adipocytes, such as adiponectin (AdipoQ), hormone-sensitive lipase (LIPE), and adipocyte lipid-binding protein (aP2). GAPDH was detected as a control. The transcription of SREBP-1c and C/EBPβ is not affected by the deletion of HDAC1 and HDAC2 in MEFs after 8 days of induction.
DISCUSSION
The results of this study reveal a unique and unexpected role for HDACs in adipogenesis. We have shown that HDAC inhibitors potently block adipocyte differentiation. Their action is mediated, at least in part, by HDAC1 and HDAC2, as deletion of these isoforms leads to a complete block of adipogenesis in vitro.
HDAC Inhibitors Specifically Block the Early Stage of Adipogenesis
We have previously observed that deletion of HDAC3 leads to a profound pro-adipogenic phenotype in cardiomyocytes (19). To further explore this phenotype, and the involvement of HDACs in lipid homeostasis, we initially tested pharmacological HDAC inhibition in an in vitro model of adipogenesis. Unexpectedly, we did not see an enhancement of adipogenesis but a complete block of adipocyte differentiation. This is in contrast to previously published reports of enhanced adipogenesis in pre-adipocytes treated with the HDAC inhibitors sodium butyrate and valproic acid (23). We confirmed our initial observation, namely that TSA blocks adipogenesis in the 3T3-L1 model, by using different HDAC inhibitors (i.e. TSA, SAHA, and Scriptaid) in two different in vitro models (3T3-L1 cells and mouse embryonic fibroblasts).
When trying to reconcile our data with previously published results we realized that valproic acid and sodium butyrate are short chain fatty acids, a class of chemicals that has previously been demonstrated to enhance adipogenesis. We thus hypothesized that the adipogenic effect of valproic acid and butyrate is due to their SCFA nature and not to the fact that these molecules are also HDAC inhibitors. Indeed, when 3T3-L1 cells were treated with valproic acid and butyrate we also observed increased adipogenesis. However, adipogenesis was completely blocked upon co-incubation with TSA, indicating that the pro-adipogenic effect was not due to HDAC inhibition but to the SCFA nature of valproic acid and sodium butyrate.
We next tested if HDAC inhibitors nonspecifically block mesenchymal differentiation or if their effects are specific to adipogenesis. We used osteogenesis as an alternative mesenchymal differentiation model and treated primary osteoblasts with TSA. Strikingly, TSA treatment had no detrimental effect on osteoblastogenesis but actually increased in vitro osteoblast differentiation as measured by extracellular matrix calcification and the up-regulation of osteoblastic marker genes.
Based on the time course for the inhibition of adipogenesis by HDAC inhibitors, which seem to exert their action within the first 48 h of induction, we conclude that this inhibition occurs downstream of C/EBPβ but upstream of PPARγ. We speculate that HDAC inhibitors can block adipogenesis by affecting the acetylation state of C/EBPβ, consequently causing C/EBPβ to be sequestered in transcriptional inactive chromatin regions (supplemental Fig. S1E). Alternatively, HDAC inhibitors could block adipogenesis by ultimately reducing the C/EBPβ DNA-binding affinity and its transcriptional activation potential. To rule out that the observed phenotype is due to toxicity of the used drugs we used a genetic approach to delete HDAC isoforms in mesenchymal cells. Previous studies have shown that HDAC1 and HDAC2 often redundantly control gene programs that govern cellular differentiation (5, 19, 22, 29). We thus used MEFs with conditional alleles for HDAC1 and HDAC2 to delineate the genetic requirement for HDACs in adipogenic differentiation. The fact that only the deletion of HDAC1 and HDAC2 together, but not the deletion of either HDAC1 or HDAC2 alone, causes a potent inhibition of lipid accumulation within the MEFs upon induction of adipogenesis supports the conclusion that HDAC1 and HDAC2 regulate adipocyte differentiation in a redundant fashion.
HDAC inhibitors are one of the most surprising classes of drugs, as they interfere with a core transcriptional process but nevertheless display therapeutic benefit in a wide variety of clinical disease models. Additionally, they are well tolerated in humans, even in formulations that nonspecifically inhibit all class I HDACs (16). It is highly likely that the development of isoform-specific inhibitors will lead to even better therapeutic efficacy. Here we provide evidence that adipogenesis and adipocyte homeostasis are under the control of HDAC1 and HDAC2. It would be interesting to determine if this previously unrecognized function of HDAC1 and HDAC2 could be effectively targeted by isoform-selective HDAC inhibitors within a clinical setting and whether lipid storage or metabolism are altered in human patients undergoing HDAC inhibitor therapy.
Supplementary Material
This work was supported, in whole or in part, by National Institutes of Health Grant 5-R01-HL083371 (to E. N. O.). This work was also supported by the Donald W. Reynolds Center for Clinical Cardiovascular Research and the Robert A. Welch Foundation.

The on-line version of this article (available at http://www.jbc.org) contains supplemental Fig. S1.
- C/EBP
- CAAT/enhancer-binding protein
- SREBP
- sterol regulatory element-binding protein
- PPAR
- peroxisome proliferator-activated receptor
- HDAC
- histone deacetylase
- SAHA
- suberoylanilide hydroxamic acid
- GFP
- green fluorescent protein
- TSA
- trichostatin A
- RT
- reverse transcription
- ORO
- Oil Red O
- MEF
- mouse embryonic fibroblast
- SCFA
- short-chain fatty acid.
REFERENCES
- 1.Spalding K. L., Arner E., Westermark P. O., Bernard S., Buchholz B. A., Bergmann O., Blomqvist L., Hoffstedt J., Näslund E., Britton T., Concha H., Hassan M., Rydén M., Frisén J., Arner P. (2008) Nature 453, 783–787 [DOI] [PubMed] [Google Scholar]
- 2.Lefterova M. I., Zhang Y., Steger D. J., Schupp M., Schug J., Cristancho A., Feng D., Zhuo D., Stoeckert C. J., Jr., Liu X. S., Lazar M. A. (2008) Genes Dev. 22, 2941–2952 [DOI] [PMC free article] [PubMed] [Google Scholar]
- 3.Farmer S. R. (2006) Cell Metab. 4, 263–273 [DOI] [PMC free article] [PubMed] [Google Scholar]
- 4.Rosen E. D., MacDougald O. A. (2006) Nat. Rev. Mol. Cell Biol. 7, 885–896 [DOI] [PubMed] [Google Scholar]
- 5.Haberland M., Montgomery R. L., Olson E. N. (2009) Nat. Rev. Genet. 10, 32–42 [DOI] [PMC free article] [PubMed] [Google Scholar]
- 6.Antos C. L., McKinsey T. A., Dreitz M., Hollingsworth L. M., Zhang C. L., Schreiber K., Rindt H., Gorczynski R. J., Olson E. N. (2003) J. Biol. Chem. 278, 28930–28937 [DOI] [PubMed] [Google Scholar]
- 7.Kong Y., Tannous P., Lu G., Berenji K., Rothermel B. A., Olson E. N., Hill J. A. (2006) Circulation 113, 2579–2588 [DOI] [PMC free article] [PubMed] [Google Scholar]
- 8.Kee H. J., Sohn I. S., Nam K. I., Park J. E., Qian Y. R., Yin Z., Ahn Y., Jeong M. H., Bang Y. J., Kim N., Kim J. K., Kim K. K., Epstein J. A., Kook H. (2006) Circulation 113, 51–59 [DOI] [PubMed] [Google Scholar]
- 9.Mann B. S., Johnson J. R., Cohen M. H., Justice R., Pazdur R. (2007) Oncologist 12, 1247–1252 [DOI] [PubMed] [Google Scholar]
- 10.Dokmanovic M., Clarke C., Marks P. A. (2007) Mol. Cancer Res. 5, 981–989 [DOI] [PubMed] [Google Scholar]
- 11.Fischer A., Sananbenesi F., Wang X., Dobbin M., Tsai L. H. (2007) Nature 447, 178–182 [DOI] [PubMed] [Google Scholar]
- 12.Ryu H., Lee J., Olofsson B. A., Mwidau A., Dedeoglu A., Escudero M., Flemington E., Azizkhan-Clifford J., Ferrante R. J., Ratan R. R. (2003) Proc. Natl. Acad. Sci. U.S.A. 100, 4281–4286 [DOI] [PMC free article] [PubMed] [Google Scholar]
- 13.Hockly E., Richon V. M., Woodman B., Smith D. L., Zhou X., Rosa E., Sathasivam K., Ghazi-Noori S., Mahal A., Lowden P. A., Steffan J. S., Marsh J. L., Thompson L. M., Lewis C. M., Marks P. A., Bates G. P. (2003) Proc. Natl. Acad. Sci. U.S.A. 100, 2041–2046 [DOI] [PMC free article] [PubMed] [Google Scholar]
- 14.Steffan J. S., Bodai L., Pallos J., Poelman M., McCampbell A., Apostol B. L., Kazantsev A., Schmidt E., Zhu Y. Z., Greenwald M., Kurokawa R., Housman D. E., Jackson G. R., Marsh J. L., Thompson L. M. (2001) Nature 413, 739–743 [DOI] [PubMed] [Google Scholar]
- 15.Rogina B., Helfand S. L., Frankel S. (2002) Science 298, 1745. [DOI] [PubMed] [Google Scholar]
- 16.Jiang J. C., Wawryn J., Shantha Kumara H. M., Jazwinski S. M. (2002) Exp. Gerontol. 37, 1023–1030 [DOI] [PubMed] [Google Scholar]
- 17.Kim S., Benguria A., Lai C. Y., Jazwinski S. M. (1999) Mol. Biol. Cell 10, 3125–3136 [DOI] [PMC free article] [PubMed] [Google Scholar]
- 18.Knutson S. K., Chyla B. J., Amann J. M., Bhaskara S., Huppert S. S., Hiebert S. W. (2008) EMBO. J. 27, 1017–1028 [DOI] [PMC free article] [PubMed] [Google Scholar]
- 19.Montgomery R. L., Potthoff M. J., Haberland M., Qi X., Matsuzaki S., Humphries K. M., Richardson J. A., Bassel-Duby R., Olson E. N. (2008) J. Clin. Invest. 3588–3597 [DOI] [PMC free article] [PubMed] [Google Scholar]
- 20.Tiscornia G., Singer O., Verma I. M. (2006) Nat. Protoc. 1, 241–245 [DOI] [PubMed] [Google Scholar]
- 21.Bakker A., Klein-Nulend J. (2003) Methods Mol. Med. 80, 19–28 [DOI] [PubMed] [Google Scholar]
- 22.Montgomery R. L., Davis C. A., Potthoff M. J., Haberland M., Fielitz J., Qi X., Hill J. A., Richardson J. A., Olson E. N. (2007) Genes Dev. 21, 1790–1802 [DOI] [PMC free article] [PubMed] [Google Scholar]
- 23.Yoo E. J., Chung J. J., Choe S. S., Kim K. H., Kim J. B. (2006) J. Biol. Chem. 281, 6608–6615 [DOI] [PubMed] [Google Scholar]
- 24.Wiper-Bergeron N., Wu D., Pope L., Schild-Poulter C., Haché R. J. (2003) EMBO J. 22, 2135–2145 [DOI] [PMC free article] [PubMed] [Google Scholar]
- 25.Hong Y. H., Nishimura Y., Hishikawa D., Tsuzuki H., Miyahara H., Gotoh C., Choi K. C., Feng D. D., Chen C., Lee H. G., Katoh K., Roh S. G., Sasaki S. (2005) Endocrinology 146, 5092–5099 [DOI] [PubMed] [Google Scholar]
- 26.Xiong Y., Miyamoto N., Shibata K., Valasek M. A., Motoike T., Kedzierski R. M., Yanagisawa M. (2004) Proc. Natl. Acad. Sci. U.S.A. 101, 1045–1050 [DOI] [PMC free article] [PubMed] [Google Scholar]
- 27.Waldecker M., Kautenburger T., Daumann H., Busch C., Schrenk D. (2008) J. Nutr. Biochem. 19, 587–593 [DOI] [PubMed] [Google Scholar]
- 28.Ohata A., Usami M., Miyoshi M. (2005) Nutrition 21, 838–847 [DOI] [PubMed] [Google Scholar]
- 29.Haberland M., Johnson A., Mokalled M. H., Montgomery R. L., Olson E. N. (2009) Proc. Natl. Acad. Sci. U.S.A. 106, 7751–7755 [DOI] [PMC free article] [PubMed] [Google Scholar]
Associated Data
This section collects any data citations, data availability statements, or supplementary materials included in this article.


