Abstract
Ni2+ and Co2+ are sensed as repellents by the Escherichia coli Tar chemoreceptor. The periplasmic Ni2+ binding protein, NikA, has been suggested to sense Ni2+. We show here that neither NikA nor the membrane-bound NikB and NikC proteins of the Ni2+ transport system are required for repellent taxis in response to Ni2+.
Escherichia coli cells are repelled by Ni2+ and, with lower sensitivity, Co2+ (21). This response is mediated primarily by the aspartate/maltose chemoreceptor, Tar. A Tar-Tsr chimeric receptor fused at residues 256 and 257 of Tar still senses Ni2+, whereas the reciprocal Tsr-Tar chimera does not (15). The authors of that study concluded that Ni2+ is sensed by the N-terminal periplasmic region of Tar. The fusion joint is actually near the C-terminal end of AS2, the second amphipathic helix of the HAMP domain (4) that couples the transmembrane sensing domain to the cytoplasmic kinase control domain. Thus, a more cautious interpretation of their results is that the ability to sense Ni2+ is conferred by the periplasmic, transmembrane, or HAMP region of Tar.
The five-gene nikABCDE operon encodes an ATP-dependent high-affinity uptake system for Ni2+. This operon is quite similar in its construction to the five-gene operons encoding the oligopeptide (Opp) and dipeptide (Dpp) transport systems (2, 14). Furthermore, the periplasmic binding proteins encoded by the first gene of all three operons are very similar in their folds (23). The DppA protein interacts with the Tap chemoreceptor of E. coli and is the substrate recognition component of the attractant chemotaxis response to dipeptides (1, 8, 16).
The NikA binding protein (19) has been suggested to be the substrate recognition component of repellent chemotaxis to Ni2+ (7). However, there are several problems with this proposal. First, NikA is produced only under conditions of anaerobiosis (7) and Ni2+ limitation (6), but Ni2+ taxis is seen in cells grown aerobically in tryptone broth (18), whether or not NiSO4 is present (9). Second, concentrations of Ni2+ that are needed to see significant responses to up or down step changes are between 10 and 100 μM (22), whereas the dissociation constant (Kd) for Ni2+ binding to NikA is on the order of 0.1 μM (7). Third, the other periplasmic binding proteins of E. coli that are involved in chemotaxis—DppA, the ribose-binding protein (RBP) (3), the galactose/glucose-binding protein (GBP) (13), and the maltose-binding protein (MBP) (12)—all mediate attractant taxis. Thus, NikA would have to evoke a response opposite from those generated by the other binding proteins.
These apparent discrepancies led us to examine whether NikA actually is the Ni2+ sensor in E. coli. We obtained knockout mutations of the nikA, nikB, and nikC genes from the Keio collection (5). These mutations replace the bulk of a given gene sequence with a kanamycin resistance cassette. The knockout mutations were transferred into the chemotactically wild-type strain CV1 (identical to RP437) (20), and the transfer of the mutations was confirmed by PCR analysis. To ensure that we were always working with mutant cells, we left the Kanr cassettes in the disrupted genes. Although the nikA insertion could have a polar effect on nikBCDE and the nikB insertion could have a polar effect on nikCDE, we could still independently assess the effect of knocking out Ni2+ transport while retaining NikA with the nikB and nikC insertions and the effect of eliminating Ni2+ binding protein and transport with the nikA insertion.
The effects of the nikA, nikB, and nikC mutations on chemotaxis were assessed using our recently described microfluidic chemotaxis device (9). In this device, diffusive mixing between two inlet concentrations of a chemoeffector is used to generate a gradient of the chemoeffector. Bacteria entering the device immediately encounter the midpoint of the gradient and are exposed to it for 18 to 21 s before imaging. This assay allows easy and rapid quantification of the chemotactic response.
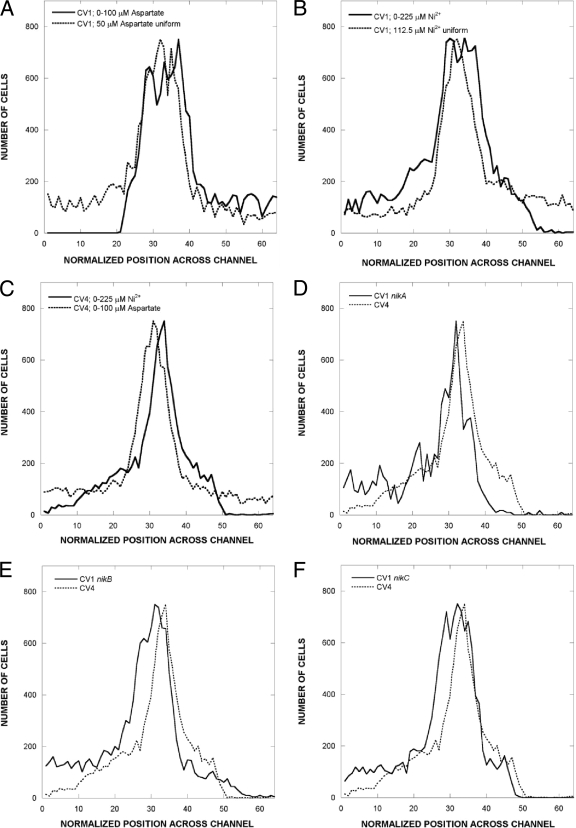
Figure 1 shows the response of wild-type and Δtar and nik mutant cells to gradients of aspartate and NiSO4. High-motility E. coli cells were prepared as described previously (9), except that cells were harvested and washed by centrifugation at 150 × g instead of by filtering. The low-speed centrifugation method produced a higher proportion of fully motile cells. Cells in chemotaxis buffer containing 50 μM l-aspartate or 122.5 μM NiSO4 were introduced at the midpoint of 0 to 50 mM aspartate or 0 to 225 μM NiSO4 gradients. CV1 cells give a very clear response in a 0 to 100 μM gradient of l-aspartate (Fig. 1A). CV1 cells also show a net migration toward lower concentrations of NiSO4 (Fig. 1B). Cells of the isogenic Δtar mutant CV4 show no response to the aspartate gradient, but they do seem to be repelled by higher NiSO4 concentrations, although significantly less than CV1 cells.
FIG. 1.
Distribution of wild-type and nik-knockout strains in aspartate and NiSO4 gradients. Cells were exposed to gradients in a previously described microfluidic device (9). The dimensions of the observation chamber are 20 by 1,050 by 11,500 μm. (A) Response of CV1 to a 0 to 100 μM gradient of l-aspartate. Cells were introduced in the middle of the channel in the presence of 50 μM aspartate. The distribution of cells at a uniform concentration of 50 μM aspartate is shown for comparison. (B) Responses of strain CV1 to a 0 to 225 mM gradient of NiSO4. In the gradient, cells were introduced in the middle of the channel in the presence of 122.5 μM NiSO4. The distribution of cells at a uniform concentration of 122.5 μM NiSO4 is shown for comparison. (C) Distribution of CV4 (Δtar) cells in gradients of 0 to 100 μM aspartate and 0 to 225 μM NiSO4. Note that there is no significant attractant response to aspartate, but there is a residual repellent response to NiSO4. (D) Responses of CV1 nikA and CV4 to a 0 to 225 μM gradient of NiSO4. (E) Responses of CV1 nikB and CV4 to a 0 to 225 μM gradient of NiSO4. (F) Responses of CV1 nikC and CV4 to a 0 to 225 μM gradient of NiSO4. The same distribution for CV4 cells is shown in panels C to F. Cell counts for each were determined from 100 images taken over a 5-min interval from a point approximately 7 mm down the channel.
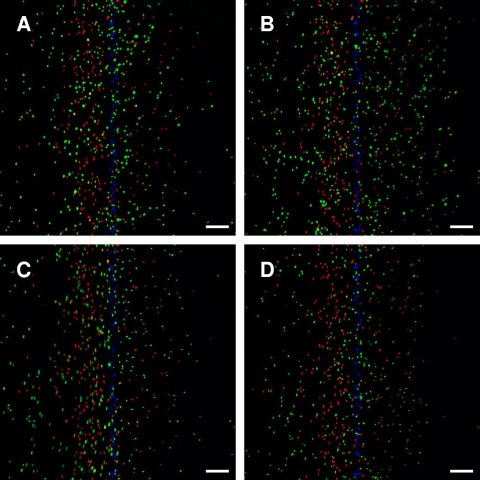
The responses of CV1 nik mutant cells are shown in Fig. 1D to F. All three nik mutants show a net migration toward lower NiSO4 concentrations comparable to that of strain CV1. Similar results were obtained when the flow rate was lower, but under those conditions the cells were exposed to the gradient for a longer time before imaging, and the average distance migrated was greater (data not shown). Pseudocolored images of the distribution of cells in NiSO4 gradients are shown in Fig. 2. These photographs capture one instantaneous distribution, whereas the distributions shown in Fig. 1 are averaged over many images.
FIG. 2.
Images of cells responding to a NiSO4 gradient in the microfluidic device. CV1, CV4, and CV1 nik-knockout strains were exposed to a gradient of 0 to 225 μM NiSO4. Representative pseudocolored overlay images are shown. The high concentration is at the right side of the image. In all images, CV1 or CV1 nik-knockout cells are shown in green, CV4 cells are shown in red, and dead cells are shown in blue. (A) CV1; (B) CV1 nikA; (C) CV1 nikB; (D) CV1 nikC. Note that some of the CV1, CV1 nik, and CV4 cells always go in the “wrong” direction, toward higher concentrations of NiSO4. Readers are reminded that chemotaxis occurs via a biased random walk, so that on a short time scale (18 to 21 s) some cells will randomly go toward higher NiSO4 concentrations. The scale bar is 100 μm.
The extent of migration in response to the NiSO4 gradient was quantified based on the chemotaxis partition and migration coefficients (CPC and CMC, respectively) (9, 17). The CPC value reflects the direction of migration (i.e., toward or away from a gradient) and quantifies the number of bacteria on either side of the bacterial inlet. For example, a CPC value of −0.30 indicates that 30% more bacteria move to the lower-concentration side than the higher-concentration side. The CMC weights the migration of cells by the distance they move. For example, a cell that moves to the left to the farthest low-concentration position (channel 1) is given a weighting factor of −1, whereas one that moves halfway into the lower concentration side (channel 16) is given a weighting factor of −0.5. CMC values are larger at lower flow rates.
The CPC values for CV1 and all three nik mutants (Table 1) were similar (−0.21 to −0.39). The CPC value for CV4 cells was −0.08. Cells in a null gradient of NiSO4 (a uniform 122.5 μM across the channel width) showed a slight bias to the right (CPC of 0.04). Such small CPC values are probably not significant because of the difficulty in accurately estimating cell number near the point where they enter the chemotaxis channel (i.e., where the cell density is maximal). The CMC values were also comparable for the wild type and nik mutants (−0.11 to −0.16) and significantly higher than for the CV4 tar mutant in the same gradient (CMC of −0.06). The CMC value for CV1 cells in the null gradient was 0.05. These results show that repellent taxis in response to NiSO4, even in this relatively shallow gradient, does not require NikA, NikB, or NikC. It should be noted that NiSO4 at concentrations of up to 300 μM does not significantly inhibit growth or motility in tryptone broth (9).
TABLE 1.
Chemotaxis partition and migration coefficients in a NiSO4 gradienta
| Strain | Value forb: |
|
|---|---|---|
| CPC | CMC | |
| CV1 (null gradient) | 0.04 ± 0.01 | 0.04 ± 0.02 |
| CV1 | −0.31 ± 0.02 | −0.13 ± 0.03 |
| CV4 | −0.08 ± 0.03 | −0.06 ± 0.03 |
| CV1 nikA | −0.25 ± 0.05 | −0.11 ± 0.01 |
| CV1 nikB | −0.39 ± 0.06 | −0.16 ± 0.05 |
| CV1 nikC | −0.26 ± 0.01 | −0.11 ± 0.01 |
The gradient ranged from 0 to 225 μM NiSO4 in chemotaxis buffer across the 1,050-μm-wide channel, except for the null gradient, in which the NiSO4 concentration was uniformly 122.5 μM across the channel.
Values are means ± standard deviations, with n ≥ 3.
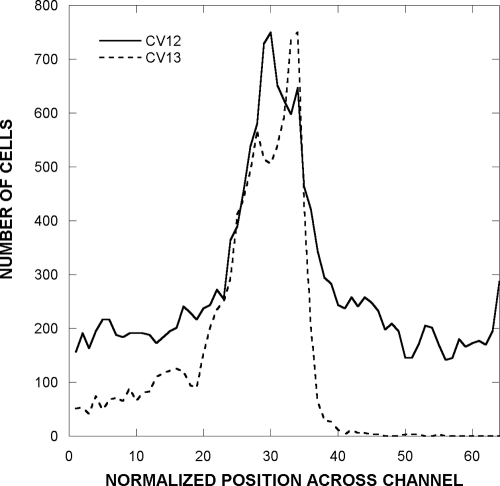
Our results clearly show that Ni2+ taxis can occur in the absence of the Nik proteins. The marginal response of CV4 cells to the Ni2+ gradient raises the possibility that Ni2+ is sensed by chemoreceptors other than Tar. The response is so weak that it could have been missed in previous, less-sensitive assays. To test whether the other high-abundance chemoreceptor of E. coli, Tsr, is responsible for the residual NiSO4 taxis, we assayed the responses of strains CV12 (Δtar Δtap trg::Tn10; Tsr as sole chemoreceptor) and CV13 (Δtsr Δtap trg::Tn10; Tsr as sole chemoreceptor) to a 0 to 122.5 μM NiSO4 gradient. Strain CV12 failed to show any significant response, whereas strain CV13 gave a very robust response (Fig. 3).
FIG. 3.
Distribution of CV12 (Tsr only) and CV13 (Tar only) strains in a NiSO4 gradient. The assay was run as described in the legend to Fig. 1.
An isothermal calorimetric (ITC) analysis shows unequivocally that Ni2+ binds specifically to the isolated periplasmic domain of Tar but not to the isolated periplasmic domain of Tsr (I. Kawagishi, personal communication). That conclusion is consistent with our observation that Ni2+ uptake is not required for repellent taxis in response to Ni2+. The loss of Ni2+ sensing by Tar should give a sufficient difference in behavior to allow for an enrichment, using a variation of our recently developed microfluidic device (9), for tar mutants that are Ni2+ blind but still competent for maltose and/or aspartate taxis (10). In this way, we hope to characterize the Ni2+-binding site in detail and shed more light on the poorly understood mechanism of repellent taxis.
Acknowledgments
We thank Ikuro Kawagishi for communicating results prior to publication. We are grateful for the Keio strains provided by the Genome Analysis Project and National BioResource Project (NIG, Japan): E. coli.
This work was supported by a grant from the National Science Foundation (CBET 0846453) to A.J. and by the Bartoszek Fund for Basic Biological Science to M.D.M.
Footnotes
Published ahead of print on 12 March 2010.
REFERENCES
- 1.Abouhamad, W. N., M. Manson, M. M. Gibson, and C. F. Higgins. 1991. Peptide transport and chemotaxis in Escherichia coli and Salmonella typhimurium: characterization of the dipeptide permease (Dpp) and the dipeptide-binding protein. Mol. Microbiol. 5:1035-1047. [DOI] [PubMed] [Google Scholar]
- 2.Abouhamad, W. N., and M. D. Manson. 1994. The dipeptide permease of Escherichia coli closely resembles other bacterial transport systems and shows growth-phase-dependent expression. Mol. Microbiol. 14:1077-1092. [DOI] [PubMed] [Google Scholar]
- 3.Aksamit, R. R., and D. E. Koshland, Jr. 1974. Identification of the ribose binding protein as the receptor for ribose chemotaxis in Salmonella typhimurium. Biochemistry 13:4473-4478. [DOI] [PubMed] [Google Scholar]
- 4.Aravind, L., and C. P. Ponting. 1999. The cytoplasmic helical linker domain of receptor histidine kinase and methyl-accepting proteins is common to many prokaryotic signalling proteins. FEMS Microbiol. Lett. 176:111-116. [DOI] [PubMed] [Google Scholar]
- 5.Baba, T., T. Ara, M. Hasegawa, Y. Takai, Y. Okumura, M. Baba, K. A. Datsenko, M. Tomita, B. L. Wanner, and H. Mori. 2006. Construction of Escherichia coli K-12 in-frame, single-gene knockout mutants: the Keio collection. Mol. Syst. Biol. 2:2006.0008. [DOI] [PMC free article] [PubMed] [Google Scholar]
- 6.de Pina, K., V. Desjardin, M. A. Mandrand-Berthelot, G. Giordano, and L. F. Wu. 1999. Isolation and characterization of the nikR gene encoding a nickel-responsive regulator in Escherichia coli. J. Bacteriol. 181:670-674. [DOI] [PMC free article] [PubMed] [Google Scholar]
- 7.de Pina, K., C. Navarro, L. McWalter, D. H. Boxer, N. C. Price, S. M. Kelly, M. A. Mandrand-Berthelot, and L. F. Wu. 1995. Purification and characterization of the periplasmic nickel-binding protein NikA of Escherichia coli K12. Eur. J. Biochem. 227:857-865. [DOI] [PubMed] [Google Scholar]
- 8.Dunten, P., and S. L. Mowbray. 1995. Crystal structure of the dipeptide binding protein from Escherichia coli involved in active transport and chemotaxis. Protein Sci. 4:2327-2334. [DOI] [PMC free article] [PubMed] [Google Scholar]
- 9.Englert, D. L., M. D. Manson, and A. Jayaraman. 2009. A flow-based microfluidic device for quantifying bacterial chemotaxis in stable, competing gradients. Appl. Environ. Microbiol. 75:4557-4564. [DOI] [PMC free article] [PubMed] [Google Scholar]
- 10.Gardina, P., C. Conway, M. Kossmann, and M. Manson. 1992. Aspartate and maltose-binding protein interact with adjacent sites in the Tar chemotactic signal transducer of Escherichia coli. J. Bacteriol. 174:1528-1536. [DOI] [PMC free article] [PubMed] [Google Scholar]
- 11.Reference deleted.
- 12.Hazelbauer, G. L. 1975. Maltose chemoreceptor of Escherichia coli. J. Bacteriol. 122:206-214. [DOI] [PMC free article] [PubMed] [Google Scholar]
- 13.Hazelbauer, G. L., and J. Adler. 1971. Role of the galactose binding protein in chemotaxis of Escherichia coli toward galactose. Nat. New Biol. 230:101-104. [DOI] [PubMed] [Google Scholar]
- 14.Hiles, I. D., L. M. Powell, and C. F. Higgins. 1986. Peptide transport in Salmonella typhimurium: molecular cloning and characterization of the oligopeptide permease genes. Mol. Gen. Genet. 206:101-109. [DOI] [PubMed] [Google Scholar]
- 15.Krikos, A., M. P. Conley, A. Boyd, H. C. Berg, and M. I. Simon. 1985. Chimeric chemosensory transducers of Escherichia coli. Proc. Natl. Acad. Sci. U. S. A. 82:1326-1330. [DOI] [PMC free article] [PubMed] [Google Scholar]
- 16.Manson, M. D., V. Blank, G. Brade, and C. F. Higgins. 1986. Peptide chemotaxis in E. coli involves the Tap signal transducer and the dipeptide permease. Nature 321:253-256. [DOI] [PubMed] [Google Scholar]
- 17.Mao, H., P. S. Cremer, and M. D. Manson. 2003. A sensitive, versatile microfluidic assay for bacterial chemotaxis. Proc. Natl. Acad. Sci. U. S. A. 100:5449-5454. [DOI] [PMC free article] [PubMed] [Google Scholar]
- 18.Miller, J. H. 1972. Experiments in molecular genetics. Cold Spring Harbor Laboratory Press, Cold Spring Harbor, NY.
- 19.Navarro, C., L. F. Wu, and M. A. Mandrand-Berthelot. 1993. The nik operon of Escherichia coli encodes a periplasmic binding-protein-dependent transport system for nickel. Mol. Microbiol. 9:1181-1191. [DOI] [PubMed] [Google Scholar]
- 20.Parkinson, J. S., and S. E. Houts. 1982. Isolation and behavior of Escherichia coli deletion mutants lacking chemotaxis functions. J. Bacteriol. 151:106-113. [DOI] [PMC free article] [PubMed] [Google Scholar]
- 21.Tso, W. W., and J. Adler. 1974. Negative chemotaxis in Escherichia coli. J. Bacteriol. 118:560-576. [DOI] [PMC free article] [PubMed] [Google Scholar]
- 22.Ward, S. M., A. Delgado, R. P. Gunsalus, and M. D. Manson. 2002. A NarX-Tar chimera mediates repellent chemotaxis to nitrate and nitrite. Mol. Microbiol. 44:709-719. [DOI] [PubMed] [Google Scholar]
- 23.Wu, L. F., and M. A. Mandrand-Berthelot. 1995. A family of homologous substrate-binding proteins with a broad range of substrate specificity and dissimilar biological functions. Biochimie 77:744-750. [DOI] [PubMed] [Google Scholar]


