

Abstract
Eph receptors and ephrins exhibit complex and highly dynamic expression patterns during embryonic development. In addition, changes in their expression levels are often associated with pathological situations in adults. Yet, little is known about the mechanisms regulating their expression. Here we report that the expression of ephrin-B1 is controlled by a feedback loop involving posttranscriptional regulatory mechanisms. We observed that the EfnB1 3′ untranslated region (3′-UTR) confers instability to mRNA transcripts, and we identified miR-124 as a posttranscriptional repressor of EfnB1 expression. Furthermore, we showed that miR-124 is itself regulated by ephrin-B1 reverse signaling, thus revealing the existence of a mutually repressive interaction between ephrin-B1 and this microRNA (miRNA). Lastly, we demonstrated the relevance of this mutual inhibition for neuronal differentiation. Our results suggest that miRNAs could be important effectors of Eph/ephrin signaling to refine domains of expression and to regulate function.
Ephrins are cell surface proteins involved in cell-cell communication controlling cell and tissue morphogenesis during embryonic development. In the developing embryo, they regulate axon guidance, angiogenesis, tissue patterning, and boundary formation (22, 23). Furthermore, they are involved in a growing number of physiological and pathological processes in the adult, including tumorigenesis, bone homeostasis, neoangiogenesis, synaptic plasticity, and insulin secretion (1, 21). Ephrins were first identified as membrane-bound ligands for Eph receptor tyrosine kinases; however, they have since been categorized as receptors themselves since they are capable of transducing a signaling cascade, despite the fact that they do not possess catalytic activity (10, 13). The signaling cascade activated downstream of ephrins is called reverse signaling, and it involves a number of signaling effectors, such as cytosolic kinases and small GTPases, that participate in the regulation of cytoskeletal dynamics (21). It has emerged recently that in addition to signaling effectors, transcription factors such as STAT-3 and ZHX2 could lie downstream of ephrin reverse signaling (2, 33).
In accordance with their varied developmental functions, ephrins exhibit highly dynamic spatial and temporal expression patterns in the developing embryo. In the adult, changes in ephrin expression levels have been correlated with a number of pathological situations, including tumorigenesis (4) and neuropathic pain (27, 29). To date, little is known about the mechanisms by which ephrin expression patterns are established, maintained, or altered in development or pathological situations. Nevertheless, the complexity of their expression patterns argues for the existence of multiple levels of regulation, both transcriptional and nontranscriptional.
To address this question, we focused on one member of the ephrin family, ephrin-B1, which exhibits graded, segmented, and lineage-restricted expression patterns in the developing embryo (28). Since EfnB1 is an X-linked gene, its expression is mosaic in EfnB1 heterozygote animals (EfnB1+/−). We and others have shown that this situation leads to segregation between ephrin-B1-positive and ephrin-B1-negative territories in tissues that normally express EfnB1 (8, 11, 12). Interestingly, Compagni et al. reported that ephrin-B1 expression is elevated in ephrin-B1-positive territories in EfnB1+/− embryos compared to the level in wild-type (WT) embryos (8), supporting the notion that complex regulatory mechanisms might be at play to regulate ephrin-B1 expression. Herein we have identified a feedback loop regulating ephrin-B1 expression. We have demonstrated that endogenous EfnB1 mRNA is unstable and that the EfnB1 3′ untranslated region (3′-UTR) promotes posttranscriptional regulation. We have identified miR-124, an abundant brain microRNA (miRNA), as an effector of EfnB1 posttranscriptional regulation. Furthermore, we have shown that activation of ephrin-B1 reverse signaling led to decreased miR-124 levels in neural progenitor cells (NPCs), indicating that ephrin-B1 and miR-124 exhibit mutually repressive interactions. Lastly, we have demonstrated the physiological relevance of the mutual inhibition between ephrin-B1 and miR-124 for neurogenesis.
MATERIALS AND METHODS
Mice.
EfnB1 mutant mice were described elsewhere (11). All animal procedures were preapproved by the Institutional Animal Care Committee at the University of Toulouse and at the CNRS.
DNA constructs and oligonucleotides.
The human I.M.A.G.E. clone (pcmv-EfnB1-3′-UTR) was purchased from the RZPD German Resource Center for Genome Research (Germany). The 3′-UTR was excised from this clone to generate pcmv-EfnB1, which contained the simian virus 40 (SV40) polyadenylation signal. The pMIR-REPORT luciferase vectors (Ambion, Inc.) harboring the full-length EfnB1 3′-UTR (FL), truncated regions of the 3′-UTR (T1 to T6), or a mutation of the miR-124 target site (T1*) were generated by subcloning (see the methods in the supplemental material). The miR-195 and miR-Neg constructs were generated according to the manufacturer's instructions (see the methods in the supplemental material). The LNA-124, LNA-124 5′-digoxigenin (5′-DIG)-labeled, and scrambled LNA 5′-DIG-labeled probes were purchased from Exiqon and are described in the methods in the supplemental material.
Cell culture.
The U251 glioma cell line was grown in Dulbecco's modified Eagle's medium (DMEM)-10% fetal calf serum and 1% penicillin-streptomycin (Invitrogen). Cultures of primary NPCs were obtained as described previously (7). Briefly, embryonic day 14.5 (E14.5) cortices (3 mice/genotype) were dissected mechanically in Hanks buffered saline solution (HBSS; Invitrogen), followed by enzymatic digestion using a trypsin cocktail (40 mg/ml trypsin, 20 mg/ml type I-S hyaluronidase, and 4 mg/ml kynurenic acid) in HBSS. The single-cell suspension was collected, rinsed with DMEM-F-12 (Invitrogen), and cultured with growing medium (DMEM-F-12 medium containing 0.6% glucose, 5 mM HEPES, 1 mM putrescine, 5 ng/ml basic fibroblast growth factor 2 [FGF-2], 20 ng/ml epidermal growth factor [EGF], 10 ng/ml insulin-transferrin-sodium selenite supplement [Sigma, France], and 2% B27 supplement) in a 5% CO2 incubator at 37°C. Several different primary cultures were obtained and kept in culture for no more than 4 passages. All electroporations were performed at passage 2 to passage 4. For actinomycin D and miR-124 studies, passages 1 and 2 were used.
Reporter assay.
EfnB1 3′-UTR reporter assays were performed with U251 cells and NPCs. Briefly, NPCs were electroporated using Amaxa nucleofection reagent (Lonza Co.), while U251 cells were transfected with Fugene-6 (Roche Diagnostics) (see the methods in the supplemental material for details and efficiencies). Firefly and Renilla luciferase measurements were performed 48 h posttransfection using a dual-luciferase reporter assay system (Promega) according to the manufacturer's instructions. Renilla luciferase activity was used to normalize firefly luciferase activity, and results are expressed as a percentage of luciferase activity in the control situation. Electroporation experiments were performed three times in duplicate.
Differentiation assays.
Cells (7 × 10⁴) were transfected or electroporated with (i) a control or an ephrin-B1-green fluorescent protein (GFP)-expressing construct (2.5 μg, lacking a 3′-UTR) or (ii) a miR-expressing construct or a control plasmid (1.5 μg). For gene expression analysis, cells were either grown in suspension or seeded onto poly-l-lysine-coated 6-well plates to differentiate and were collected for quantitative reverse transcription-PCR (qRT-PCR) at various intervals. For immunocytochemistry analysis, cells were seeded onto poly-ornithine-coated LabTek chamber slides and grown under differentiating conditions for 6 days. Cells were fixed with 2% paraformaldehyde (PFA) in phosphate-buffered saline (PBS) at room temperature for 20 min and were then permeabilized and blocked with 0.1% Triton X-100, 1% bovine serum albumin (BSA), and 10% normal donkey serum in PBS at room temperature for 30 min. Cells were stained for anti-HuC/D (5 μg/μl), and nuclei were counterstained with TO-PRO-3 (1 μg/ml). Ephrin-B1 expression was observed by GFP fluorescence. Images were acquired using a Leica SP2 confocal microscope.
Stimulation of reverse and forward signaling.
Twenty-four hours prior to stimulation, neurospheres were dissociated with trypsin, and aliquots of 105 cells were placed in growing medium overnight. Cells were then stimulated with ephrin-B1-Fc (1 μg/ml; R&D Systems, Inc.), EphB2-Fc (1 μg/ml; R&D Systems, Inc.), or human-Fc (control, 1 μg/ml; R&D Systems, Inc.), all preclustered with anti-human IgG (0.1 μg/ml; R&D Systems, Inc.). Total RNA was isolated 4 h poststimulation and processed for qRT-PCR. Alternatively, cells were stimulated for 1 h and lysed in protein lysis buffer for Western blot analysis.
Western blot analysis.
In brief, cells were lysed with radioimmunoprecipitation assay (RIPA) buffer (50 mM Tris-HCl, pH 7.4, 1% Triton X-100, 1% sodium deoxycholate, 0.1% sodium dodecyl sulfate [SDS], 150 mM NaCl, 100 mM NaF, 50 mM sodium orthovanadate) containing 1× Complete protease inhibitor (Roche Diagnostics) and sonicated. Twenty-five micrograms of total protein was mixed in 2× Laemmli buffer (1:1), boiled, and fractionated by electrophoresis on a 12.5% SDS-polyacrylamide gel. Proteins were transferred onto nitrocellulose membranes and incubated with primary antibodies overnight at 4°C. Antibodies were used against ephrin-B1 (A20; Santa Cruz Biotechnology), Grb2 (Signal Transduction Labs), phosphorylated STAT3 (P-STAT3) (Cell Signaling Technology), STAT3 (Cell Signaling Technology), phosphorylated extracellular signal-regulated kinases 1 and 2 (P-ERK1/2) (Cell Signaling Technology), and ERK1/2 (Cell Signaling Technology). Horseradish peroxidase (HRP)-conjugated secondary antibodies were from Sigma.
Quantitative RT-PCR.
Cells were harvested in RNA Later (Ambion), and total RNA was extracted using Trizol (Invitrogen) according to the manufacturer's instructions. MicroRNA expression was measured by qRT-PCR using a Bio-Rad thermal cycler. For reverse transcription (RT), a miScript kit (Qiagen) was used, with 100 nanograms of total RNA per reaction. For the qRT-PCR, the resultant cDNA was diluted 1:50. Each RT step was performed in duplicate and the qRT-PCR in triplicate for each RT reaction. RT-PCR was performed using Quantitech SYBR green master mix (Qiagen), and cDNAs were amplified on a Bio-Rad cycler. Relative values were calculated by the 2−ΔΔCT method. U6 RNA was used as an endogenous control. Results are expressed as a percentage of the mRNA level compared to that for the control condition. Experiments were performed in triplicate. Primer sequences are available in the methods in the supplemental material.
mRNA decay assay.
Transcription was inhibited by adding actinomycin D (5 μg/ml) to the cell culture medium. Total RNA was isolated at various times after actinomycin D addition, and EfnB1 mRNA content was determined by qRT-PCR. EfnB1 mRNA levels were normalized to GAPDH (glyceraldehyde-3-phosphate dehydrogenase) mRNA content and are expressed as a percentage of the mRNA level at the 0-h time point. Experiments were performed in triplicate.
Ex vivo electroporations and organotypic slice cultures.
Pregnant mice were sacrificed by neck dislocation, E14.5 embryos were removed and decapitated, and electroporations were performed as described previously (19). Briefly, 1.5 μg/μl miR-124- or scrambled oligonucleotide-expressing constructs and 1 μg/μl pCAGGS-EGFP (enhanced GFP) (generously provided by L. Nguyen) were mixed with 0.01% Fast Green (Sigma) and injected into the telencephalon ventricles using pulled glass-micropipettes. Five electrical pulses were applied at 50 V (50-ms duration) at 1-s intervals using a BTX ECM-830 square-wave electroporator (Gentronic, Inc.). Electroporated heads were kept in ice-cold PBS-glucose, and whole brains were dissected and embedded in 3% agarose. Brain slices corresponding to the dorsolateral region of the cortex (250-μm vibratome sections) were cultured for 16 h in neurobasal medium supplemented with N2 (Invitrogen), B27 (Invitrogen), 0.1% penicillin-streptomycin, and 2 mM l-glutamine. Slices were then fixed with 4% PFA and processed for immunostaining with anti-GFP (0.03 μg/μl; Millipore), and nuclei were counterstained with TO-PRO-3 or Draq5 (Molecular Probes). For neurite length quantification, sections were costained with Tuj-1 and cells present in the Tuj-1-positive regions were analyzed. Images were acquired using a Leica SP2 confocal microscope and analyzed with Image J.
In situ hybridization.
Paraffin-embedded, 7-μm sections of E13.5 EfnB1 wild-type and EfnB1-deficient embryos were subjected to in situ hybridization using 5′-DIG-labeled miRCURY LNA probes according to the manufacturer's protocol (Exiqon). Briefly, the sections were incubated in hybridization buffer (50% formamide, 5× SSC [1× SSC is 0.15 M NaCl plus 0.015 M sodium citrate], pH 6, 0.1% Tween 20, 50 μg/ml heparin, 500 μg/ml torula yeast RNA) containing 20 nM LNA-124 or scrambled 5′-DIG-labeled probes overnight at 40°C. Sections were washed twice with 2× SSC at 40°C and three times in 2× SSC, 50% formamide at 40°C and incubated overnight in blocking buffer (PBS with 2% goat serum, 2 mg/ml BSA, 0.1% Tween 20) containing an alkaline phosphatase (AP)-labeled anti-DIG antibody (1/2,000) (Roche). Nitroblue tetrazolium (NBT)-5-bromo-4-chloro-3-indolylphosphate (BCIP) was used as a substrate for the AP. Sections of different genotypes were processed and developed in parallel for the same amounts of time.
FACS analysis.
Briefly, for fluorescence-activated cell sorter (FACS) analysis, wild-type and EfnB1-deficient neurospheres were dissociated with trypsin and fixed in 4% PFA, and the cell suspension was incubated first with Tuj-1 antibody (2 μg/ml) and then with a secondary antibody coupled to AlexaFluor 647 (Molecular Probes). Cells were resuspended in PBS and results acquired with a FACSCalibur cytometer (Becton Dickinson).
Statistics.
Analysis of variance (ANOVA) with Dunnett's posthoc test was applied to significant main effects. The differences between groups were considered statistically significant when the P value was <0.05.
RESULTS
Expression of ephrin-B1 is posttranscriptionally regulated.
In the course of our studies of EfnB1 expression in primary NPCs, we found that endogenous EfnB1 transcripts were highly unstable, with a half-life of 35 min (Fig. 1A). To test whether EfnB1 mRNA instability was associated with the 3′-UTR of the gene, we used a glioma cell line, U251, which expresses low levels of endogenous ephrin-B1 (see Fig. S1 in the supplemental material). We transfected U251 cells with expression vectors containing the EfnB1 cDNA with and without the 3′-UTR and measured EfnB1 mRNA degradation. Ectopic EfnB1 mRNA with no 3′-UTR sequence was more stable than the transcript containing the 3′-UTR (92-min half-life for transcripts without the 3′-UTR, versus 27 min for transcripts with the 3′-UTR) (Fig. 1A). Furthermore, the increased instability of the transcripts with the 3′-UTR correlated with a 2-fold reduction in steady-state levels of ectopic EfnB1 mRNA (Fig. 1B). These results indicate that the 3′-UTR of EfnB1 alters gene expression by decreasing mRNA stability.
FIG. 1.

The 3′-UTR of EfnB1 causes a decrease in mRNA levels. (A) Endogenous levels of EfnB1 in NPCs were measured by qRT-PCR at different time intervals after actinomycin D treatment. U251 cells were transiently transfected with EfnB1 expression constructs with (pcmv-EfnB1-3′-UTR) or without (pcmv-EfnB1) the 3′-UTR, and levels of ectopic EfnB1 transcripts were measured by qRT-PCR at different time intervals after actinomycin D treatment. Results are the means ± standard errors (SE) from 3 independent experiments, each measured in duplicate. (B) U251 cells were transiently transfected with EfnB1 expression constructs with (EfnB1-3′-UTR) or without (EfnB1) the 3′-UTR, and steady-state levels of ectopic EfnB1 transcripts were measured by qRT-PCR. Results are the means ± SE from 3 independent experiments, each measured in duplicate.
To better characterize the mechanisms regulating EfnB1 expression at the posttranscriptional level, we used luciferase reporter assays, both with U251 cells and with primary NPCs, which express high levels of endogenous EfnB1 (see Fig. S1 in the supplemental material). Inserting the entire 3′-UTR of EfnB1 (FL) downstream of a luciferase cDNA resulted in an 85% decrease in luciferase activity in U251 cells compared to that for the control reporter (Fig. 2A). To localize this posttranscriptional regulatory activity, we generated serial deletions from the distal and proximal ends of the EfnB1 3′-UTR, as illustrated in Fig. 2B (left). Luciferase assays with these reporters demonstrated that a strong negative regulatory element is located in the first 450 bp (Fig. 2B, right), while a second destabilizing element was identified in the region corresponding to nucleotide positions 653 to 1211. Interestingly, in primary NPCs, which express high levels of endogenous ephrin-B1, the decrease in luciferase activity observed with the FL and T1 reporters was not as extensive as that observed for U251 cells (52%, versus 85% with the FL reporter) (Fig. 2C), underlying the potential importance of posttranscriptional regulation in the control of steady-state EfnB1 expression levels.
FIG. 2.

A posttranscriptional regulatory motif is located in the first 450 bp of the EfnB1 3′-UTR. (A) Normalized luciferase activity in U251 cells transfected with either a reporter construct containing the full-length EfnB1 3′-UTR (FL) or a control construct (pmiR-control). (B, left) Schematic representation of various luciferase reporter constructs. The numbers at right indicate the nucleotide positions included in the reporter constructs. (B, right) Corresponding normalized luciferase activity in U251 cells. (C) Normalized luciferase activity in NPCs electroporated with pmiR-control, FL, and T1 reporters. Results are the means ± standard errors from 6 independent experiments, each measured in duplicate. **, significantly different from pmiR-control, P < 0.001; *, significantly different from pmiR-control, P < 0.05.
Altogether, these results indicate that expression of ephrin-B1 is posttranscriptionally regulated and that a strong regulatory element is located in the first 450 bp of the EfnB1 3′UTR.
Posttranscriptional regulation of EfnB1 by miR-124.
Because AU-rich elements (AREs) have been identified in members of the ephrin family (32), we tested whether EfnB1 transcripts were subjected to ARE-mediated posttranscriptional regulation. To experimentally determine whether EfnB1 transcripts were subjected to ARE-mediated posttranscriptional regulation, we assessed the effect of the ubiquitous RNA-binding proteins AUF-1, which destabilizes ARE-containing mRNAs, and HuR, which stabilizes ARE-containing mRNAs, on the EfnB1 3′-UTR. We cotransfected the FL reporter with the AU-binding protein AUF-1 or HuR and performed luciferase assays. Expression of AUF-1 and HuR was verified by RT-PCR (see Fig. S2A in the supplemental material). There was no significant change in luciferase activity associated with the FL reporter when cotransfected with either the AUF-1- or the HuR-expressing vector (see Fig. S2B in the supplemental material), indicating that the EfnB1 3′-UTR is not sensitive to AUF-1 or HuR overexpression and suggesting that the decreased EfnB1 mRNA stability associated with the 3′-UTR is independent of ARE-mediated mRNA decay.
Using the online algorithms TargetScan and PicTar, we identified conserved target sites for two miRNAs, miR-124 and miR-195, in the 3′-UTR of EfnB1 mRNA (see Fig. S3 in the supplemental material). Both miR-124 and miR-195 are expressed in U251 cells and NPCs, albeit at different levels (see Fig. S4A in the supplemental material), indicating that both miRNAs are valid candidates for posttranscriptional regulation of ephrin-B1. Since the predicted miR-124 target site is located within the first 450 bp of the EfnB1 3′-UTR and levels of miR-124 in U251 cells versus those in NPCs matched the differential posttranscriptional regulation observed between these two cell types, miR-124 appeared to be a more promising candidate than miR-195. To directly test whether the EfnB1 3′-UTR is targeted by miR-124 or miR-195, we performed luciferase assays in the presence or absence of ectopic miR-124 and miR-195. Cotransfection of the miR-124-expressing construct with the FL or T1 reporter in U251 cells resulted in a 48% or 52% further decrease in luciferase activity, respectively, compared to that for the control situation (FL alone) (Fig. 3A), indicating that miR-124 does target the EfnB1 3′-UTR. Cotransfection of miR-124 with T6, which does not contain the miR-124 binding site, showed no change in luciferase activity (Fig. 3A). Moreover, a mutation in the miR-124 specific binding site in the EfnB1 3′-UTR increased luciferase activity compared to that for the nonmutated sequence and abolished the effect of ectopic expression of miR-124 (Fig. 3B). Unlike miR-124, coexpression of miR-195 with FL, T5, or T6 had no impact on luciferase activity (see Fig. S4B in the supplemental material). To further confirm that the posttranscriptional regulation associated with the 3′-UTR of EfnB1 was due to miR-124, we repeated the luciferase assays in the presence of LNA-124, an inhibitor of miR-124. Introduction of LNA-124 with the FL or T1 construct in U251 cells resulted in an increase in luciferase activity (70% or 63%, respectively), while no difference in luciferase activity was observed with scrambled LNA sequences or T6 (Fig. 3C). To test whether miR-124 posttranscriptional regulation impacted ephrin-B1 protein levels, we performed a Western blot analysis of U251 cells after ectopic expression of EfnB1 with and without the 3′-UTR and with and without ectopic miR-124. We observed decreased ephrin-B1 protein levels following overexpression of miR-124 and the full-length EfnB1 transcript (Fig. 3D). Altogether, these data indicate that EfnB1 is a bona fide target of miR-124 in vitro.
FIG. 3.

miR-124 targets the 3′-UTR of EfnB1. (A) Normalized luciferase activity in U251 cells cotransfected with FL, T1, or T6 in the absence (−) or presence (+) of a miR-124 expression construct, as indicated. (B) Normalized luciferase activity in U251 cells cotransfected with T1 or a reporter carrying a mutation in the miR-124 binding site (T1*), in the absence or presence of a miR-124 expression construct. (C) Normalized luciferase activity in U251 cells cotransfected with FL, T1, or T6 with (+) or without (−) LNA-124 or scrambled sequences, as indicated. Results are the means ± standard errors (SE) from 3 independent experiments, each measured in duplicate. (D) U251 cells were cotransfected with pcmv-EfnB1 or pcmv-EfnB1-3′-UTR in the absence or presence of a miR-124 expression construct, and ephrin-B1 protein levels were determined by Western blot analysis. Quantification of three independent experiments was performed using the Grb2 protein level as a loading control. Results are the means ± SE from 3 independent experiments, each measured in duplicate. (E) E14.5 developing cortices were coelectroporated with a GFP reporter plasmid and with either a scrambled oligonucleotide (a) or a miR-124 (b) expression construct. Images show nuclei in blue and GFP-positive cells in green. Quantification of GFP-positive cells in the VZ is also shown (c). Images are representative of 3 independent electroporations. IZ, intermediate zone. *, P < 0.05; **, P < 0.01.
In the developing cortex, ephrin-B1 is expressed in neural progenitors located in the ventricular zone (VZ) and turned off in neurons (28). This expression pattern is opposite that of miR-124 (18), providing evidence that Efnb1 may be a target of miR-124 in vivo. To test whether miR-124 targets EfnB1 in vivo, we overexpressed miR-124 in neural progenitors in the developing cortex and assessed the consequence for EfnB1 expression. First, we ascertained that electroporation of the miR-124 expression construct did lead to ectopic miR-124 expression (see Fig. S5A in the supplemental material). Next, we stained electroporated sections to detect ephrin-B1; however, we noticed that as early as 16 h postelectroporation, the majority of cells overexpressing miR-124 had left the VZ and were located in the cortical plate (CP), an ephrin-B1-negative territory (Fig. 3E; also see Fig. S5B in the supplemental material). On the contrary, the majority of cells electroporated with a scrambled oligonucleotide were still located in the VZ (Fig. 3E). Because miR-124-overexpressing cells rapidly exited the ephrin-B1-enriched VZ, we were not able to address whether miR-124 directly targeted ephrin-B1 in vivo. However, these experiments showed that overexpression of miR-124 promotes precocious exit of the VZ, which phenocopies the downregulation of ephrin-B1 in vivo (24), suggesting that Efnb1 is likely a target of miR-124 in vivo and indicating that miR-124 and ephrin-B1 exert opposite effects on neural progenitors in vivo.
Ephrin-B1 reverse signaling downregulates miR-124.
The fact that ephrin-B1 and miR-124 seemed to have opposite effects on neural progenitors led us to ask whether ephrin-B1 and miR-124 could in fact be part of a regulatory loop. To address this possibility, we assessed the effect of activating ephrin-B1 reverse signaling on the levels of miR-124. First, we ensured that we could activate reverse signaling in primary NPCs. We incubated NPCs with clustered Eph receptors that bind to ephrin-B1 and tested whether this treatment resulted in increased levels of P-STAT3, which is one hallmark of ephrin-B1 reverse signaling activation (2). We observed that activation of reverse signaling in NPCs led to increased P-STAT3 but not P-ERK1/2 levels (Fig. 4A). We then measured miR-124 levels by real-time PCR analysis and found that stimulation of reverse signaling in primary NPCs led to a decrease in miR-124 levels (Fig. 4B, left) but had no effect on an unrelated miRNA, miR-200c (Fig. 4B, right). To further show that ephrin reverse signaling modulates miR-124 levels, we measured miR-124 levels in both wild-type (WT) and EfnB1-deficient (EfnB1−/−) NPCs. Quantitative PCR analysis showed that miR-124 levels were increased in EfnB1−/− NPCs (Fig. 4C). Furthermore, levels of miR-124 appeared elevated in the telencephalons of E13.5 EfnB1−/− embryos compared to those for WT controls (Fig. 4D). Altogether, these results indicate that ephrin reverse signaling regulates miR-124 levels in vitro and in vivo.
FIG. 4.

Reverse signaling downregulates miR-124 levels. (A) Wild-type NPCs were stimulated with Fc, EphA4-Fc, or EphB2-Fc, and levels of P-STAT3 and P-ERK were assessed by Western blot analysis (left). Ratios of phosphorylated protein levels versus total protein amounts are shown for both STAT3 and ERK1/2 (right). (B) Wild-type NPCs were stimulated with Fc or EphB2-Fc, and miR-124 levels (left) and miR-200C levels (right) were determined by qPCR. (C) miR-124 levels in wild-type (WT) and EfnB1−/− (KO) NPCs were determined by qPCR. Results are the means ± standard errors from 3 independent experiments, each measured in duplicate. *, P < 0.05. (D) In situ hybridization of coronal sections of E13.5 wild-type (a, b, d, and e) and EfnB1−/− (c and f) embryos, carried out using either a scrambled LNA as a control (a and d) or LNA-124 as a probe for miR-124 expression (b, c, e, and f). Two different samples at two different magnifications are shown for each condition.
The expression of ephrin-B1 is regulated by ephrin reverse signaling.
Since EfnB1 is a target of miR-124, one expectation from the data presented above is that its expression should be regulated upon activation of reverse signaling. To test for this, we measured EfnB1 mRNA levels by qRT-PCR following activation of ephrin reverse signaling in NPCs. As expected, we observed that activation of reverse signaling led to increased levels of EfnB1 transcripts (Fig. 5A). Expression of Sox9, which is a recently validated target of miR-124 (6), was also increased in response to reverse signaling (Fig. 5B), suggesting that modulation of miR-124 levels by reverse signaling might have a ripple effect on multiple miR-124 targets. These results reveal the existence of a feedback loop controlling EfnB1 expression downstream of ephrin reverse signaling. To confirm that regulation of EfnB1 expression downstream of ephrin reverse signaling involves posttranscriptional regulation, we performed luciferase assays with the FL reporter with and without stimulation of reverse signaling in primary NPCs. Activation of reverse signaling in WT but not in EfnB1−/− NPCs led to an increase in luciferase activity associated with the FL reporter (Fig. 5C), suggesting that posttranscriptional regulation is indeed part of the feedback loop identified. However, the fact that the increase in FL-associated luciferase activity did not match the increase in Efnb1 mRNA levels suggests that posttranscriptional regulation might not be the only mechanism at play in the feedback loop.
FIG. 5.
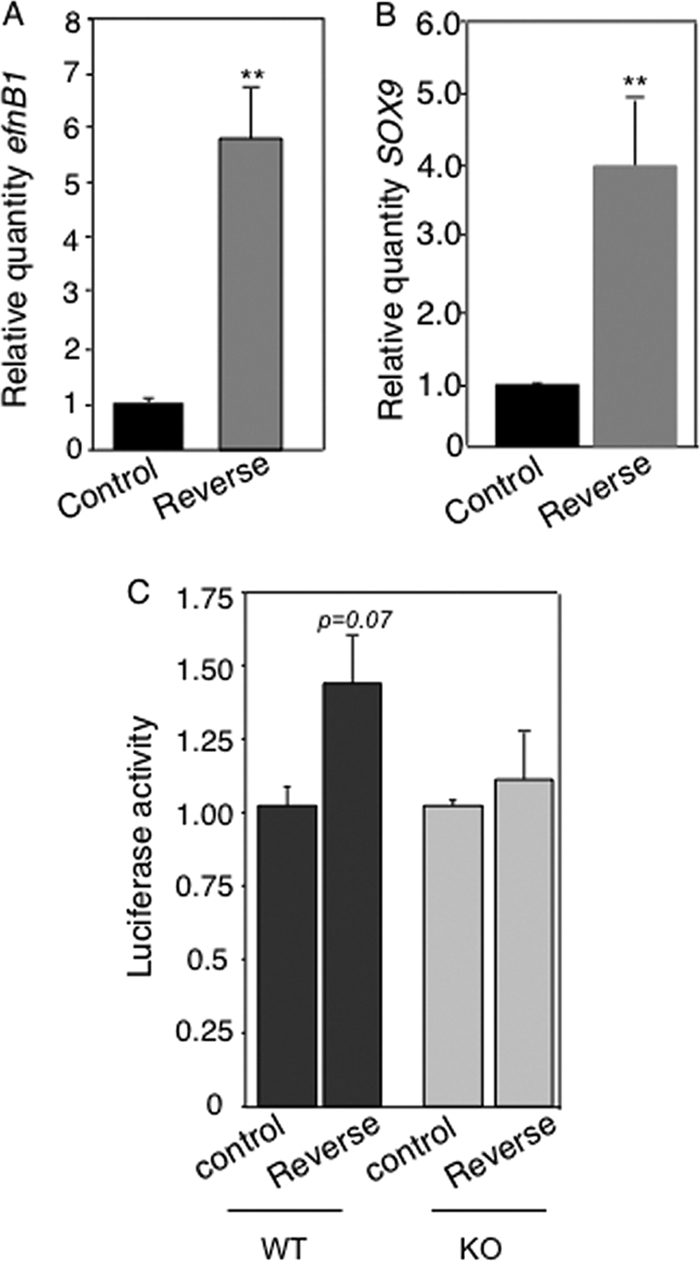
Reverse signaling regulates the expression of miR-124 target genes. (A) Wild-type NPCs were stimulated with Fc (control) or EphB2-Fc (reverse), and EfnB1 levels were determined by qRT-PCR. (B) Wild-type NPCs were stimulated with Fc (control) or EphB2-Fc (reverse), and Sox9 levels were determined by qRT-PCR. (C) Normalized luciferase activity in wild-type (WT) and EfnB1-deficient (KO) NPCs electroporated with the T1 reporter and stimulated with Fc (control) or EphB2-Fc (reverse). Results are the means ± standard errors from 3 independent experiments, each measured in duplicate. **, P < 0.01.
Mutual inhibition between ephrin-B1 and miR-124 controls neuronal differentiation.
We next asked whether mutual inhibition between EfnB1 and miR-124 is relevant to the physiological function of these molecules, focusing on their role in neurogenesis. First, we used primary neural progenitors in culture as a model system of neurogenesis (see Fig. S6 in the supplemental material). We observed that EfnB1 and miR-124 exhibited opposite changes in expression over the course of differentiation (Fig. 6A). Second, we observed that EfnB1−/− NPCs, which exhibit higher miR-124 levels (Fig. 4C), also exhibit increased levels of tubb3 transcripts at 6 days of differentiation (Fig. 6B), indicating that neuronal differentiation is promoted in EfnB1−/− NPCs. Furthermore, FACS analysis using the Tuj-1 antibody to detect βIII-tubulin revealed that EfnB1−/− NPCs present a higher rate of spontaneous neuronal differentiation when cultured in the presence of growth factors (Fig. 6C). To test whether higher miR-124 levels cause elevated neuronal differentiation in EfnB1−/− NPCs, we knocked down miR-124 in these cells and asked whether this affected neuronal differentiation. Electroporation of LNA-124 in EfnB1−/− NPCs led to a modest yet significant decrease in tubb3 levels but had no effect on levels of gfap (a nonneuronal transcript) (Fig. 6D). These results indicate that increased miR-124 levels in EfnB1−/− NPCs are causally linked to increased neuronal differentiation. Further, this suggests that ephrin-B1 reverse signaling antagonizes neuronal differentiation by keeping miR-124 levels low.
FIG. 6.

Increased neuronal differentiation in EfnB1-deficient NPCs correlates with elevated miR-124 levels. (A) NPCs were cultured on poly-l-lysine-coated plates and were allowed to differentiate for 3 or 6 days. Levels of miR-124 and EfnB1 were measured by qPCR and qRT-PCR, respectively, and are expressed as percentages of the day 0 levels. Results are the means ± standard errors (SE) from 3 independent experiments. (B) tubb3 levels in differentiated wild-type (WT) or EfnB1−/− (KO) NPCs were determined by qRT-PCR. (C) Spontaneous neuronal differentiation in growing wild-type (WT) and EfnB1−/− (KO) NPCs was assessed by FACS analysis using βIII-tubulin as a marker. FL1-H and FL4-H, heights of fluorescence intensity in channels 1 and 4, respectively. (D) Growing EfnB1−/− NPCs were electroporated with scrambled LNA or LNA-124, and gfap and tubb3 levels were determined by qRT-PCR. Results are the means ± SE from 3 independent experiments, each measured in duplicate. *, P < 0.05; **, P < 0.01.
Next, we constitutively expressed miR-124 in NPCs and evaluated the effect of ectopic miR-124 on EfnB1 expression and neuronal differentiation. Ectopic expression of miR-124 in NPCs led to a further decline in EfnB1 messenger levels by day 6 of differentiation compared to those for controls (20% ± 6% versus 40% ± 11% of the level at day 0, respectively), as measured by qRT-PCR. In addition, miR-124-overexpressing cultures showed an increased rate of neuronal differentiation, as determined by HuC/D staining (Fig. 7A). These data showed that overexpression of miR-124 induces a decrease in EfnB1 levels concomitant with increased neuronal differentiation. To test whether downregulation of ephrin-B1 is relevant to miR-124-induced differentiation, we coexpressed ephrin-B1-GFP (20) and miR-124 in NPCs and evaluated neuronal differentiation by immunostaining for HuC/D. Ectopic expression of ephrin-B1 delayed miR-124-induced differentiation, as cells coelectroporated with miR-124 and ephrin-B1-GFP rarely costained with HuC/D (Fig. 7A). In addition, these cells primarily remained round (Fig. 7Ag). These results suggest that preventing the downregulation of ephrin-B1 blocked miR-124 promotion of neuronal differentiation.
FIG. 7.

Downregulation of ephrin-B1 is required for miR-124-induced neuronal differentiation. (A) NPCs were electroporated with a control (a and b) or a miR-124 (c and d) or miR-124+ephrin-B1-GFP (e to h) expression construct, differentiated for 6 days, and stained with HuC/D antibody (b, d, f, and h). Ephrin-B1 expression was detected by epifluorescence (g and h). Images are representative of three separate experiments. Quantification of HuC/D-expressing cells under the three conditions listed above is also shown (i). (B) E14.5 developing cortices were coelectroporated with a GFP reporter plasmid and with the scrambled oligonucleotide (a), miR-124 (b), ephrin-B1-GFP (c), or miR-124+ephrin-B1-GFP (d) expression construct and cultured for 16 h. Images show nuclei in blue and GFP-positive neurons in green. A high magnification of single cells electroporated with the scrambled oligonucleotide, miR-124, ephrin-B1-GFP, or miR-124+ephrin-B1-GFP expression construct is also shown (e), as is the quantification of neurite length of GFP-positive neurons in the CP (f). Images and quantification results are representative of 3 independent electroporated brains. *, P < 0.05.
miR-124 has recently been shown to promote neurite extension when overexpressed in isolated cortical progenitor cells, supporting its positive regulation of neurogenesis (18). Similarly, we observed in vivo that neurons overexpressing miR-124 exhibited increased neurite outgrowth compared to that for neurons expressing GFP alone (Fig. 7B), probably reflecting the fact that cells electroporated with miR-124 had precociously entered the differentiation program (Fig. 3E). On the contrary, neurons that coexpressed ephrin-B1-GFP and miR-124 did not present these changes in neurite length and were similar to neurons expressing either ephrin-B1-GFP or GFP alone (Fig. 7Be and f). Altogether, these results indicate that mutual inhibition between ephrin-B1 and miR-124 is relevant to the control of neuronal differentiation.
DISCUSSION
Our study describes a feedback mechanism regulating ephrin-B1 expression that involves posttranscriptional regulation via a miRNA. While our results clearly show that EfnB1 is a target of miR-124, expression of EfnB1 is probably also controlled by yet-undescribed transcriptional mechanisms both dependent and independent of reverse signaling. We propose that posttranscriptional regulation by miR-124 provides a refinement to the transcriptional regulation of EfnB1, in accordance with the proposed role of miRNAs in buffering stochastic variations in gene expression (16). It has been shown recently that some members of the Eph/ephrin family possess posttranscriptional regulatory motifs in the 3′-UTR, consistent with a possible posttranscriptional regulation by the mRNA decay pathway (32). EfnB1 was not tested directly in that study, and we found that overexpression of HuR and AUF-1 had no effect on posttranscriptional regulation via the EfnB1 3′-UTR. We identified a single, highly conserved miR-124 target site in the Efnb1 3′-UTR, and we found that posttranscriptional regulation of EfnB1 involved mRNA instability. This is consistent with a recent report showing that the majority of miR-124 targets are regulated predominantly via mRNA degradation (15).
Our results indicate that activation of reverse signaling leads to changes in miR-124 levels, which has consequences for the expression of miR-124 targets. This is significant because only a few reports have proposed that reverse signaling might impinge on gene expression. We showed recently that stimulation of ephrin-B1 reverse signaling in fibroblasts resulted in global gene expression changes (3), and it has been reported that the cytoplasmic domain of ephrin-B1 interacts with a transcriptional repressor that regulates maintenance of NPCs (33). Lastly, activation of the transcription factor STAT3 downstream of ephrin reverse signaling has been described previously (2). Ephrins are well known for their role in regulating cell morphology, and it has been shown that they do so by directly regulating cytoplasmic effectors involved in the dynamics of the actin cytoskeleton, such as small GTPases (21). Our data suggest that ephrin reverse signaling could also control cell morphology via regulation of miR-124 levels. Although the entire repertoire of miR-124 targets is not known, there is accumulating evidence that this miRNA targets genes coding for proteins involved in the regulation of the cell cytoskeleton (5, 35).
A recent report has shown that the RE1 silencing transcription factor (REST/NRSF) binds to the promoter of mammalian miR-124 genes to repress their expression in nonneuronal cells (9). Although we do not know yet whether ephrin-B1 reverse signaling regulates miR-124 levels via REST/NRSF, it is interesting to note that a physical and functional interaction between ephrin-B1 and a transcriptional coactivator, TAZ, has been reported very recently (34).
A role for miR-124 in promoting neurogenesis in vivo has been reported in the last few years (6, 18, 31), and we have shown that ephrin-B1 was required to maintain the progenitor fate in the developing murine cortex (24). Here, we used these known functions to demonstrate the physiological relevance of the mutual inhibition between ephrin-B1 and miR-124. We showed that downregulation of ephrin-B1 is important for miR-124-induced neuronal differentiation: in cultured NPCs, ectopic expression of ephrin-B1 delayed miR-124-induced expression of neuron-specific genes, and in ex vivo explants, ectopic ephrin-B1 inhibited miR-124-induced neurite extension. Conversely, our data suggest that ephrin-B1 maintains the progenitor fate by keeping levels of miR-124 low.
Mutually repressive interactions, such as the one described here, occur frequently during segmentation and neurogenesis (two processes involving Eph/ephrin signaling), and mathematical analysis has shown that these interactions may be important to sharpen expression boundaries and confer robustness to developmental processes (17). However, the regulatory mechanism between ephrin-B1 and miR-124 may also be relevant to carcinogenesis. For example, it has been shown that miR-124 expression is downregulated in several carcinomas (14, 26) while ephrin-B1 upregulation seems to be associated with carcinoma tumorigenesis (25, 30). Further studies are warranted to test for a direct miRNA-ephrin-B relationship in cancer.
Supplementary Material
Acknowledgments
The pENTR-U6-miR-124 construct and LNA-124 were generous gifts from F. H. Gage (Salk Institute) and J. Cavaillé (LBME, France), respectively. J. Torrisani (IMMR, France) made the miR-195 DNA construct. The AUF-1- and HuR-encoding plasmids and primer sequences were generous gifts from D. Morello (CBD, France). The ephrin-B1-GFP fusion construct was a kind gift from J. Chen (Vanderbilt University). The pCAGGS-GFP construct was kindly provided by L. Nguyen (CNCM, Belgium). Images were generated in the Toulouse Rio Imaging facility. We thank our laboratory colleagues for critical reading of the manuscript.
This work was supported by a career development award from the HFSPO and an ATIP from the CNRS, both awarded to A.D. D.N.A., T.J., and A.D. are supported by the CNRS, while A.B. is supported by the HFSPO.
Footnotes
Published ahead of print on 22 March 2010.
Supplemental material for this article may be found at http://mcb.asm.org/.
REFERENCES
- 1.Arvanitis, D., and A. Davy. 2008. Eph/ephrin signaling: networks. Genes Dev. 22:416-429. [DOI] [PMC free article] [PubMed] [Google Scholar]
- 2.Bong, Y. S., H. S. Lee, L. Carim-Todd, K. Mood, T. G. Nishanian, L. Tessarollo, and I. O. Daar. 2007. EphrinB1 signals from the cell surface to the nucleus by recruitment of STAT3. Proc. Natl. Acad. Sci. U. S. A. 104:17305-17310. [DOI] [PMC free article] [PubMed] [Google Scholar]
- 3.Campbell, T. N., A. Davy, Y. Liu, M. Arcellana-Panlilio, and S. M. Robbins. 2008. Distinct membrane compartmentalization and signaling of ephrin-A5 and ephrin-B1. Biochem. Biophys. Res. Commun. 375:362-366. [DOI] [PubMed] [Google Scholar]
- 4.Campbell, T. N., and S. M. Robbins. 2008. The Eph receptor/ephrin system: an emerging player in the invasion game. Curr. Issues Mol. Biol. 10:61-66. [PubMed] [Google Scholar]
- 5.Cao, X., S. L. Pfaff, and F. H. Gage. 2007. A functional study of miR-124 in the developing neural tube. Genes Dev. 21:531-536. [DOI] [PMC free article] [PubMed] [Google Scholar]
- 6.Cheng, L.-C., E. Pastrana, M. Tavazoie, and F. Doetsch. 2009. miR-124 regulates adult neurogenesis in the subventricular zone stem cell niche. Nat. Neurosci. 12:399-408. [DOI] [PMC free article] [PubMed] [Google Scholar]
- 7.Chojnacki, A., and S. Weiss. 2008. Production of neurons, astrocytes and oligodendrocytes from mammalian CNS stem cells. Nat. Protoc. 3:935-940. [DOI] [PubMed] [Google Scholar]
- 8.Compagni, A., M. Logan, R. Klein, and R. H. Adams. 2003. Control of skeletal patterning by ephrinB1-EphB interactions. Dev. Cell 5:217-230. [DOI] [PubMed] [Google Scholar]
- 9.Conaco, C., S. Otto, J. J. Han, and G. Mandel. 2006. Reciprocal actions of REST and a microRNA promote neuronal identity. Proc. Natl. Acad. Sci. U. S. A. 103:2422-2427. [DOI] [PMC free article] [PubMed] [Google Scholar]
- 10.Cowan, C. A., and M. Henkemeyer. 2002. Ephrins in reverse, park and drive. Trends Cell Biol. 12:339-346. [DOI] [PubMed] [Google Scholar]
- 11.Davy, A., J. Aubin, and P. Soriano. 2004. EphrinB1 forward and reverse signaling are required during mouse development. Genes Dev. 18:572-583. [DOI] [PMC free article] [PubMed] [Google Scholar]
- 12.Davy, A., J. O. Bush, and P. Soriano. 2006. Inhibition of gap junction communication at ectopic ephrin boundaries underlies craniofrontonasal syndrome. PLoS Biol. 4:1763-1776. [DOI] [PMC free article] [PubMed] [Google Scholar]
- 13.Davy, A., and P. Soriano. 2005. Ephrin signaling in vivo: look both ways. Dev. Dyn. 232:1-10. [DOI] [PubMed] [Google Scholar]
- 14.Furuta, M., K. I. Kozaki, S. Tanaka, S. Arii, I. Imoto, and J. Inazawa. 20 October 2009. miR-124 and miR-203 are epigenetically silenced tumor-suppressive microRNAs in hepatocellular carcinoma. Carcinogenesis [Epub ahead of print.] doi: 10.1093/carcin/bgp250. [DOI] [PubMed]
- 15.Hendrickson, D. G., D. J. Hogan, H. L. McCullough, J. W. Myers, D. Herschlag, J. E. Ferrell, and P. O. Brown. 2009. Concordant regulation of translation and mRNA abundance for hundreds of targets of a human microRNA. PLoS Biol. 7:e1000238. [DOI] [PMC free article] [PubMed] [Google Scholar]
- 16.Hornstein, E., and N. Shomron. 2006. Canalization of development by microRNAs. Nat. Genet. 38:S20-S24. [DOI] [PubMed] [Google Scholar]
- 17.Ishihara, S., and T. Shibata. 2008. Mutual interaction in network motifs robustly sharpens gene expression in developmental processes. J. Theor. Biol. 252:131-144. [DOI] [PubMed] [Google Scholar]
- 18.Maiorano, N. A., and A. Mallamaci. 2009. Promotion of embryonic cortico-cerebral neuronogenesis by miR-124. Neural Dev. 4:40. [DOI] [PMC free article] [PubMed] [Google Scholar]
- 19.Nguyen, L., A. Besson, J. I. Heng, C. Schuurmans, L. Teboul, C. Parras, A. Philpott, J. M. Roberts, and F. Guillemot. 2006. p27kip1 independently promotes neuronal differentiation and migration in the cerebral cortex. Genes Dev. 20:1511-1524. [DOI] [PMC free article] [PubMed] [Google Scholar]
- 20.Parker, M., R. Roberts, M. Enriquez, X. Zhao, T. Takahashi, D. Pat Cerretti, T. Daniel, and J. Chen. 2004. Reverse endocytosis of transmembrane ephrin-B ligands via a clathrin-mediated pathway. Biochem. Biophys. Res. Commun. 323:17-23. [DOI] [PubMed] [Google Scholar]
- 21.Pasquale, E. B. 2008. Eph-ephrin bidirectional signaling in physiology and disease. Cell 133:38-52. [DOI] [PubMed] [Google Scholar]
- 22.Pasquale, E. B. 2005. Eph receptor signalling casts a wide net on cell behaviour. Nat. Rev. Mol. Cell Biol. 6:462-475. [DOI] [PubMed] [Google Scholar]
- 23.Poliakov, A., M. Cotrina, and D. G. Wilkinson. 2004. Diverse roles of Eph receptors and ephrins in the regulation of cell migration and tissue assembly. Dev. Cell 7:465-480. [DOI] [PubMed] [Google Scholar]
- 24.Qiu, R., X. Wang, A. Davy, C. Wu, K. Murai, H. Zhang, J. G. Flanagan, P. Soriano, and Q. Lu. 2008. Regulation of neural progenitor cell state by ephrin-B. J. Cell Biol. 181:973-983. [DOI] [PMC free article] [PubMed] [Google Scholar]
- 25.Sawai, Y., S. Tamura, K. Fukui, N. Ito, K. Imanaka, A. Saeki, S. Sakuda, S. Kiso, and Y. Matsuzawa. 2003. Expression of ephrin-B1 in hepatocellular carcinoma: possible involvement in neovascularization. J. Hepatol. 39:991-996. [DOI] [PubMed] [Google Scholar]
- 26.Silber, J., D. A. Lim, C. Petritsch, A. I. Persson, A. K. Maunakea, M. Yu, S. R. Vandenberg, D. G. Ginzinger, C. D. James, J. F. Costello, G. Bergers, W. A. Weiss, A. Alvarez-Buylla, and J. G. Hodgson. 2008. miR-124 and miR-137 inhibit proliferation of glioblastoma multiforme cells and induce differentiation of brain tumor stem cells. BMC Med. 6:14. [DOI] [PMC free article] [PubMed] [Google Scholar]
- 27.Song, X.-J., J.-L. Cao, H.-C. Li, J.-H. Zheng, X.-S. Song, and L.-Z. Xiong. 2008. Upregulation and redistribution of ephrinB and EphB receptor in dorsal root ganglion and spinal dorsal horn neurons after peripheral nerve injury and dorsal rhizotomy. Eur. J. Pain 12:1031-1039. [DOI] [PubMed] [Google Scholar]
- 28.Stuckmann, I., A. Weigmann, A. Shevchenko, M. Mann, and W. B. Huttner. 2001. Ephrin B1 is expressed on neuroepithelial cells in correlation with neocortical neurogenesis. J. Neurosci. 21:2726-2737. [DOI] [PMC free article] [PubMed] [Google Scholar]
- 29.Uchida, H., M. Matsumoto, and H. Ueda. 2009. Profiling of BoNT/C3-reversible gene expression induced by lysophosphatidic acid: ephrinB1 gene up-regulation underlying neuropathic hyperalgesia and allodynia. Neurochem. Int. 54:215-221. [DOI] [PubMed] [Google Scholar]
- 30.Varelias, A., S. A. Koblar, P. A. Cowled, C. D. Carter, and M. Clayer. 2002. Human osteosarcoma expresses specific ephrin profiles: implications for tumorigenicity and prognosis. Cancer Cell 95:862-869. [DOI] [PubMed] [Google Scholar]
- 31.Visvanathan, J., S. Lee, B. Lee, J. W. Lee, and S. K. Lee. 2007. The microRNA miR-124 antagonizes the anti-neural REST/SCP1 pathway during embryonic CNS development. Genes Dev. 21:744-749. [DOI] [PMC free article] [PubMed] [Google Scholar]
- 32.Winter, J., S. Roepcke, S. Krause, E. C. Müller, A. Otto, M. Vingron, and S. Schweiger. 2008. Comparative 3′UTR analysis allows identification of regulatory clusters that drive Eph/ephrin expression in cancer cell lines. PLoS One 3:e2780. [DOI] [PMC free article] [PubMed] [Google Scholar]
- 33.Wu, C., R. Qiu, J. Wang, H. Zhang, K. Murai, and Q. Lu. 2009. ZHX2 interacts with ephrin-B and regulates neural progenitor maintenance in the developing cerebral cortex. J. Neurosci. 29:7404-7412. [DOI] [PMC free article] [PubMed] [Google Scholar]
- 34.Xing, W., J. Kim, J. Wergedal, S.-T. Chen, and S. Mohan. 2010. Ephrin B1 regulates bone marrow stromal cell differentiation and bone formation by influencing TAZ transactivation via complex formation with NHERF1. Mol. Cell. Biol. 30:711-721. [DOI] [PMC free article] [PubMed] [Google Scholar]
- 35.Yu, J. Y., K. H. Chung, M. Deo, R. C. Thompson, and D. L. Turner. 2008. MicroRNA miR-124 regulates neurite outgrowth during neuronal differentiation. Exp. Cell Res. 314:2618-2633. [DOI] [PMC free article] [PubMed] [Google Scholar]
Associated Data
This section collects any data citations, data availability statements, or supplementary materials included in this article.