Volume 46, no. 10, p. 3517-3521, 2008. We recently discovered that mistakes were made during the development of the database that was fundamental to the research we presented in the article identified above. Numerical mistakes were inadvertently included in Table 1; also, the statistical analyses were performed with the wrong data. The numbers of individuals included in the gender data in Table 1 were wrong. As a consequence, all of the data for the other parameters listed in that table were miscalculated. The corrected table, in which many of the values had to be changed, is given below.
TABLE 1.
Determinants of Staphylococcus aureus carriage in the first year of life
| Parameter | Value for infantsa: |
|||
|---|---|---|---|---|
| Not colonized (0-1) (n = 292) | Colonized (2>) (n = 76) | OR (95% CI) | aOR (95% CI) | |
| Gender | ||||
| Female | 148 (53.4) | 29 (38.2) | 1.00 | 1.00 |
| Male | 129 (46.6) | 47 (61.8) | 1.81 (1.08-3.03) | 1.84 (1.00-3.41) |
| Gestational age (mo) | 40.3 (37.7-42.0) | 40.3 (37.1-42.4) | 0.90 (0.76-1.06) | 0.87 (0.69-1.10) |
| Birth weight (g) | 3,600 (2,759-4,300) | 3,542 (2,728-4,573) | 1.00 (1.00-1.00) | 1.00 (1.00-1.00) |
| Breast-feeding at 6 mo | ||||
| No | 189 (70.5) | 49 (65.3) | 1.00 | 1.00 |
| Yes | 79 (29.5) | 26 (34.7) | 1.26 (0.73-2.16) | 1.34 (0.69-2.60) |
| Mother's educational level | ||||
| Higher education | 172 (62.8) | 53 (69.7) | 1.00 | 1.00 |
| Lower/intermediate education | 102 (37.2) | 23 (30.3) | 0.74 (0.43-1.27) | 0.59 (0.27-1.25) |
| Mother's prenatal smoking | ||||
| No | 242 (90.6) | 65 (90.3) | 1.00 | 1.00 |
| Yes | 25 (9.4) | 7 (9.7) | 1.11 (0.46-2.67) | 2.78 (0.54-14.26) |
| Mother's postnatal smoking | ||||
| No | 201 (88.5) | 59 (89.4) | 1.00 | 1.00 |
| Yes | 26 (11.5) | 7 (10.6) | 0.98 (0.41-2.37) | 0.37 (0.07-2.00) |
| Siblings | ||||
| No | 157 (60.4) | 44 (58.7) | 1.00 | 1.00 |
| Yes | 103 (39.6) | 31 (41.3) | 1.05 (0.63-1.77) | 0.99 (0.52-1.90) |
| Day-care attendance | ||||
| No | 54 (23.4) | 21 (30.9) | 1.00 | 1.00 |
| Yes | 177 (76.6) | 47 (69.1) | 0.70 (0.39-1.26) | 0.58 (0.29-1.18) |
Values are given as number (%) of infants unless indicated otherwise. Values are means or medians (5 to 95% range) for variables with skewed distribution. A total of 353 infants provided nasal swabs at all three collection moments. Data were missing on breast-feeding (n = 10), mother's educational level (n = 3), mother's prenatal smoking (n = 14), mother's postnatal smoking (n = 60), siblings (n = 18), and day-care attendance (n = 54).
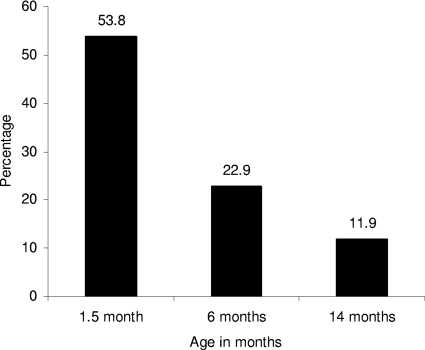
These mistakes also resulted in errors in Fig. 1. The revised version of the figure is given below.
FIG. 1.
In addition, data in the text are corrected below according to the values given in the new version of Table 1.
Statistical relevance remains as originally reported, although in some cases the exact data changed slightly. Note that some of the data relating to statistical significance in the text are corrected below according to the updated version of the table. Despite the errors presented in the published article, all of the conclusions presented in the paper, including the biological conclusions, still stand.
Page 3520, column 1, line 3: “170 (48%)” should read “129 (46.6%).”
Page 3520, column 1, line 4: “55 (61.8%)” should read “47 (61.8%).”
Page 3520, column 1, line 5: “39.5% (n = 161)” should read “39.6% (n = 103).”
Page 3520, column 1, line 6: “40.9% (n = 36)” should read “41.3% (n = 31).”
Page 3520, column 1, line 7: “30.9% (n = 106)” should read “29.5% (n = 79).”
Page 3520, column 1, lines 8 and 9: “36.4% (n = 32)” should read “34.7% (n = 26).”
Page 3520, column 1, lines 9 and 10: “Two hundred thirty-one (77.5%)” should read “One hundred seventy-seven (76.6%).”
Page 3520, column 1, line 11: “54 (68.4%)” should read “47 (69.1%).”
Page 3520, column 1, line 14: “52.1% (231 of 443 infants)” should read “53.8%.”
Page 3520, column 1, line 15: “21.7% (96 of 443 infants)” should read “22.9%.”
Page 3520, column 1, lines 15 and 16: “12.9% (57 of 443 infants)” should read “11.9%.”
Page 3520, column 1, lines 36 and 37: “(adjusted odds ratio [aOR], 2.09; 95% confidence interval [CI], 1.17 to 3.72)” should read “(adjusted odds ratio [aOR], 1.84; 95% confidence interval [CI], 1.00 to 3.84).”
Page 3520, column 1, line 39: “aOR, 1.03; 95% CI, 0.57 to 1.87” should read “aOR, 0.99; 95% CI, 0.52 to 1.90.”


