Abstract
Background and observations: The current denominator for dosing dialysis is the urea distribution volume (V). Normalizing Kt/V to body surface area (S) has been proposed, but the implications of doing this in children have not been examined.
Design, setting, participants, & measurements: Dialysis dose given to children and adolescents was calculated in terms of conventional V-based scaling and surface-area-normalized standard Kt/V (SAN-stdKt/V) calculated as stdKt/V·(Vant/S)/17.5, where Vant was an anthropometric estimate of V calculated using the Morgenstern equation. Formal 2-pool modeling was used to compute all dialysis adequacy outputs.
Results: In 34 children (11 girls, 23 boys) dialyzed 3 times a week, age range 1.4 to 18 years, the mean delivered equilibrated Kt/V (eKt/V) was 1.40, and the mean stdKt/V was 2.49, both of which tended to be higher in younger children. The ratio of Vant to S was 15.6 ± 2.69 and was strongly associated with age between ages 2 and 16. SAN-stdKt/V averaged 2.21 and was strongly correlated with age between ages 2 and 16. If one considers a desired target for SAN-stdKt/V to be 2.45, all children less than 10 years of age were below target, despite having relatively high values of eKt/V and stdKt/V.
Conclusions: If a surface-area-based denominator were to be adopted for dialysis dosing, most children under 10 years of age would receive markedly less dialysis than adolescent patients and would require 6- to 8-hour hemodialysis sessions or, for the youngest children, treatments given more frequently than 3 times/wk.
The minimum hemodialysis dose needed by adults and children is a matter of some uncertainty and considerable controversy. When dose is scaled to urea distribution volume (V), which is similar in size to total body water, and when hemodialysis is given 3 times/wk, observational data suggest that the minimum per-session dose in adults is a Kt/V of 1.2, where K is the dialyzer clearance and t is the dialysis session length (1). The dose of dialysis can also be expressed as a weekly equivalent, standard Kt/V (2–4). Standard Kt/V (stdKt/V) is calculated as the urea generation rate (G) divided by the mean predialysis urea concentration multiplied by 10,080 (the number of minutes in a week) and divided by V. When stdKt/V is estimated by a fixed-volume, simplified equation (4), a value of 2.0 corresponds to a session Kt/V of 1.2 in a thrice-weekly schedule (1). When formal modeling is used to compute the stdKt/V, the corresponding value is somewhat higher, approximately 2.14, because of the effects of fluid removal (5).
Current Kidney Disease Outcomes Quality Initiative (K/DOQI) recommendations for a 3-times/wk schedule of dialysis are to keep the single-pool Kt/V (spKt/V) >1.2, or the stdKt/V (estimated by a fixed-volume, simplified equation) at >2.0 (1). In adults, providing a larger amount of dialysis while still keeping to a 3- to 4.5-hour, 3-times/wk schedule appears to be of little benefit, as shown by the Hemodialysis (HEMO) study in which patients randomized to “high-dose” dialysis (an spKt/V of approximately 1.7) had mortality and hospitalization rates similar to patients randomized to “conventional-dose” dialysis (an spKt/V of approximately 1.3) (6). The stdKt/V values in these two groups, calculated using formal modeling, were 2.62 and 2.24, respectively (7). In adults, current research is focusing on whether further increases in the stdKt/V, to approximately 4.0 using a 6-times/wk “daily” schedule (150-minute sessions) or to approximately 6.0 using a 6-times/wk nocturnal schedule (400-minute sessions), might be of benefit in terms of intermediate outcomes (8).
In children on maintenance hemodialysis, there is scant observational evidence and no randomized trials regarding the optimum dose of dialysis. Given the relatively robust amount of protein ingestion in children and the belief that inadequate dialysis can impair somatic growth, the current concept is that children require relatively more dialysis than adults, although the amount of increase is unclear. The current K/DOQI guidelines (8.3.1 and 8.3.2 in reference 1) state that “children should receive at least the delivered dose of dialysis as recommended for the adult population” (level A evidence) and that “for younger pediatric patients, prescription of higher dialysis doses and higher protein intakes at 150% of the recommended nutrient intake for age may be important” (level B evidence). In the United States, according to 2005 U.S. Renal Data System (USRDS) data, the mean spKt/V in children was 1.6, with a median value of 1.5 (9). Furthermore, at least two studies have shown that in children, dialysis or hemodiafiltration doses that exceed current minimum standards by large margins are associated with increased growth rates and other beneficial clinical intermediate outcomes (10,11).
A newer concept in dialysis dosing is to rethink the denominator, the current denominator being V. The concept of using V for the denominator grew out of a reanalysis the National Cooperative Dialysis Study in terms of urea Kt/V (12). Because urea is distributed in V, and because G is proportional to V, it made sense to normalize the dose of dialysis relative to V. However, urea is not toxic per se, and it serves only as a conveniently measured marker substance. Empirically, Lowrie et al. suggested the idea of abandoning the V-based denominator of dialysis dose and giving the same dose (as Kt) to all patients (13). They later modified this idea to substitute body surface area (S) for V as the denominator (14). Because the ratio of V to S is higher in men than in women, and because the relationship of V to body size is “steeper” than that of S to body size, rescaling dialysis dose to S rather than to V will result in a requirement for a relatively greater amount of dialysis for women and for smaller patients, including children (7,15–18). The purpose of the study presented here was to examine the effect of rescaling dialysis dose to S in children of different ages and to determine what would constitute a dose equivalent to that currently given to older adolescents and to adults.
Patients and Methods
Monthly modeling sessions from one pediatric dialysis unit in Jerusalem, Israel (center 1), and one in Chicago, Illinois (center 2), were used as the basis of this analysis. All patients used for analysis were being dialyzed 3 times/wk (a few patients were being dialyzed >3 times/wk, but these were excluded). Selected patient characteristics are given in Table 1; the causes of end-stage kidney disease were typical of what is seen in childhood. In center 1, causes of ESRD were dysplastic kidneys (5), atypical hemolytic uremic syndrome (3), posterior urethral valve (1), focal segmental glomerular sclerosis (1), familial nephrotic syndrome (3, with 1 podocin mutation, others negative for known mutations), and sepsis-ischemia (1). In center 2, causes for ESRD were unknown (7), reflux nephropathy (3), lupus (2), IgA (1), membrane proliferative GN type I (1), Wegener's (1), focal segmental glomerular sclerosis (1), HIV (1), cystinosis (1), and cloacal extrophy (1). Children dialyzed in center 1 were considerably younger than those being dialyzed in center 2. None of the patients in center 1, with the exception of the youngest (1.4 years of age), had any urine output. In center 2, several children had small amounts of residual renal function. In center 1, 9 of 14 patients were using catheters, 5 of 14 an AV fistula, and none were using a graft. In center 2, the proportions were 13 of 20, 7 of 20, and 1 of 20, respectively.
Table 1.
Patient characteristics
| Characteristic | Center 1 | Center 2 | All |
|---|---|---|---|
| N | 14 | 20 | 34 |
| Gender (male/female) | 11/3 | 12/8 | 33/11 |
| Age | 7.03 ± 4.49 | 14.85 ± 3.00 | 11.6 ± 5.32 |
| Height (cm) | 104 ± 27 | 150 ± 18.9 | 131 ± 31.8 |
| Weight (kg) | 18.9 ± 11 | 46.6 ± 16.5 | 35.2 ± 20.0 |
| S (m2) | 0.75 ± 0.31 | 1.39 ± 0.33 | 1.12 ± 0.45 |
| Vant (L) | 10.9 ± 6.44 | 24.5 ± 6.86 | 18.9 ± 9.47 |
Anthropometric total body water volume was estimated from height, weight, age, and gender using equations by Morgenstern (19) for all patients. S was calculated using the equation of Gehan and George (20). Formal urea modeling was used to compute adequacy values in these children. The details of the model used (Solute–Solver) have been described in detail (21). Briefly, the model uses a 2-pool, variable extracellular volume analysis in which K is computed from industry-published K0A values and recorded blood and dialysate flow rates. The model assumes that patients are dialyzed to the same postdialysis weight throughout the week and uses numerical integration of urea concentrations in the two body pools to generate a weekly blood urea nitrogen (BUN) profile. The intercompartmental mass transfer clearance for urea is estimated as 16 × the postdialysis volume in liters (21). G is determined by iteratively adjusting the height of the weekly BUN profile until the appropriate modeled predialysis BUN value coincides with the corresponding measured predialysis value. The stdKt/V is computed as G divided by the mean predialysis whole-body urea nitrogen value, multiplied by 10,080 and divided by the postdialysis modeled V (21). The version of Solute–Solver used (1.953) is a departure from the originally described version in that version 1.953 calculates anthropometric V in children less than 20 years of age using the Morgenstern equation (19) and S using the equation described by Gehan and George (20).
The surface-area-normalized (SAN) stdKt/V is computed as stdKt/V multiplied by (Vant/S, where Vant is the anthropometric estimation of body water) divided by the population mean of the Vant-to-S ratio, as described previously (7,17). The latter normalizing number will vary depending on how V is measured. In adults, when the Vant-to-S ratio is estimated using the equations described by Watson et al. for Vant (22) and Dubois and Dubois for S (23), the population mean value of Vant/S is close to 20 (17). In children, when the Morgenstern equation (19) is used for Vant and the Gehan and George equation is used for S (20), the population mean value for Vant/S (Morgenstern/Gehan) in older adolescent children is close to 17.5, and this was the normalization value used to compute SAN-stdKt/V in the data analysis presented here.
Treatment characteristics for the children in the two centers are given in Table 2. In center 1, all of the patients were receiving hemodialysis for 4 hours, 3 times/wk, whereas in center 2 the treatment time was variable, averaging 214 minutes. Mean dialyzer K0A and estimated Kd values are as shown. The average blood flow was 124 ml/min in center 1 and 246 ml/min in center 2. Dialysate flow rate was fixed at 500 ml/min in both centers.
Table 2.
Treatment characteristics
| Center 1 | Center 2 | All | |
|---|---|---|---|
| Qb (ml/min) | 124 ± 65 | 246 ± 75.0 | 195 ± 92.9 |
| Qb/S (mL·min−1·m−2) | 160 ± 29 | 178 ± 32 | 170 ± 32 |
| Qd (ml/min) | 500 ± 0 | 500 ± 0 | 500 ± 0 |
| Qd/Qb (ratio) | 5.11 ± 2.34 | 2.2 ± 0.68 | 3.41 ± 2.12 |
| K0A (ml/min) | 494 ± 175 | 967 ± 328 | 772 ± 360 |
| Kd (ml/min) | 92.9 ± 43 | 177 ± 47.8 | 142.6 ± 62 |
| t (minutes) | 240 ± 0 | 214 ± 23.7 | 225 ± 22 |
Qb, blood flow rate; Qd, dialysate flow rate; K0A, dialyzer mass transfer area coefficient; Kd, dialyzer clearance; t, dialysis time.
Results
The single- and double-pool modeling outputs are given in Table 3. The mean urea reduction ratio (URR) and spKt/V were 72.8 and 1.60, respectively, and the mean equilibrated Kt/V (eKt/V) was 1.40. StdKt/V averaged 2.49, well above the K/DOQI-recommended minimum value of 2.14 (after factoring in fluid removal). The mean modeled volume (Vm, 20.8 L) was similar to Vant (18.9 L; Table 1), with an average Vm-to-Vant ratio of 1.13. The ratio of Vant to S averaged 15.6, with a strong relationship to age. The SAN-stdKt/V averaged 2.21.
Table 3.
Modeling outputs
| Center 1 | Center 2 | All | |
|---|---|---|---|
| URR | 77.3 ± 3.75 | 69.7 ± 5.63 | 72.8 ± 6.21 |
| spKt/V | 1.81 ± 0.18 | 1.45 ± 0.23 | 1.60 ± 0.28 |
| eKt/V | 1.61 ± 0.16 | 1.26 ± 0.21 | 1.41 ± 0.26 |
| G (mg/min) | 2.88 ± 1.36 | 4.86 ± 2.05 | 4.05 ± 2.03 |
| PCRn (g/kg/day) | 1.53 ± 0.50 | 1.14 ± 0.25 | 1.30 ± 0.42 |
| stdKt/V (dialysis) | 2.70 ± 0.13 | 2.34 ± 0.34 | 2.49 ± 0.27 |
| SAN-stdKt/V (dialysis) | 2.12 ± 0.38 | 2.28 ± 0.29 | 2.21 ± 0.48 |
| Vm (L) | 11.87 ± 5.46 | 27.0 ± 9.19 | 20.8 ± 10.9 |
| Vm/Vant | 1.14 ± 0.18 | 1.11 ± 0.16 | 1.13 ± 0.17 |
| Kc (ml/min) | 187 ± 88 | 433 ± 147 | 333 ± 173 |
| Vant/S | 13.7 ± 2.30 | 17.0 ± 1.17 | 15.6 ± 2.69 |
PCRn, normalized protein catabolic rate; Vm, modeled urea volume; Vant, anthropometric urea volume; Kc, intercompartmental urea clearance.
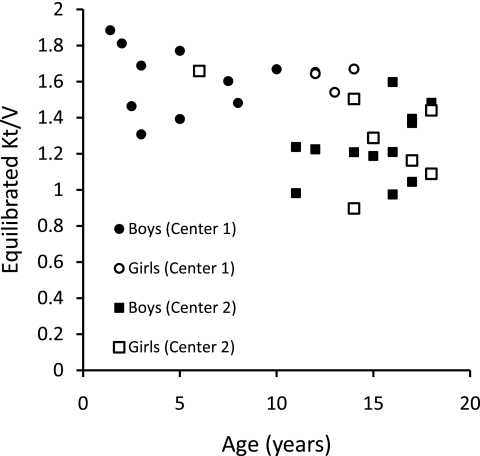
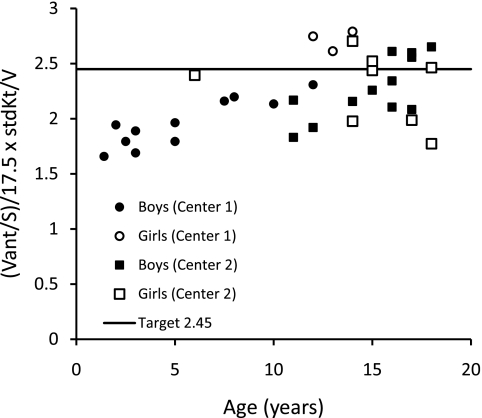
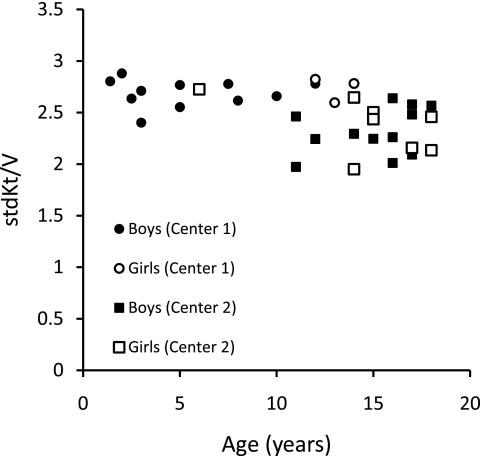
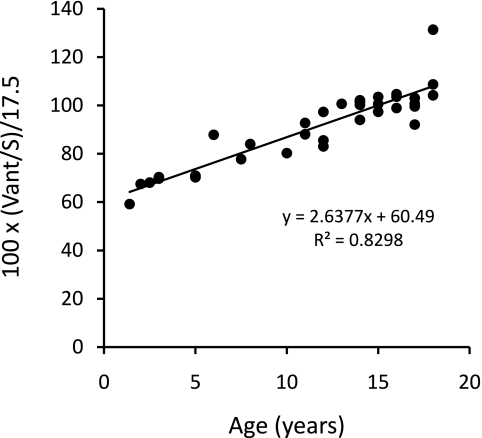
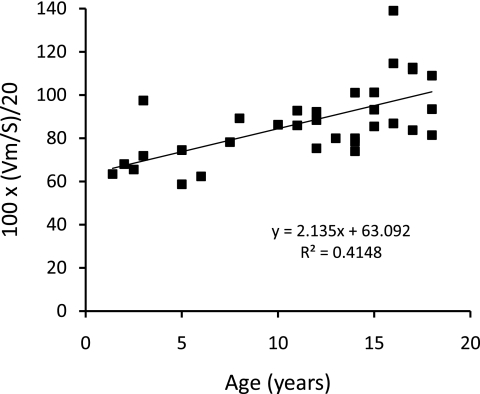
The relationships of eKt/V, stdKt/V, Vant/S, and SAN-stdKt/V to age are shown in Figures 1 through 5. From Figures 1 and 2, it is clear that eKt/V and stdKt/V values tended to be slightly higher in the younger children. Figure 3 shows that the Vant-to-S ratio fell progressively as children were younger, and that at ages 2 to 5 the Vant-to-S ratio was considerably lower than the mean value of approximately 17.5 seen in older adolescents (Figure 3). In Figure 3, the Vant-to-S ratio is normalized to the mean value found in older adolescents of approximately 17.5, and the data are displayed in percent format. Figure 4 shows that a similar relationship of V/S was present when Vm was used. The average ratio of Vm to S in older adolescents was close to 20 (19.8). Hence, in Figure 4 the Vm-to-S ratio is expressed as a percent of 20.
Figure 1.
eKt/V versus age.
Figure 5.
SAN-stdKt/V versus age. A proposed target SAN-stdKt/V value of 2.45 is also shown.
Figure 2.
stdKt/V versus age.
Figure 3.
Morgenstern Vant divided by S as a percent of 17.5 (17.5 is the approximate mean value for children aged 15 to 20 years) plotted against age. A linear relationship is apparent below age 16.
Figure 4.
Vm divided by S as a percent of 20 (20 is the approximate mean value for children aged 15 to 20) plotted against age. A linear relationship is apparent below age 16.
We considered that a reasonable target (not necessarily a minimum value) for SAN-stdKt/V would be 2.45 as measured by formal modeling because this was the mean value seen in the women randomized to the high-dose group in the HEMO study and was the value seen in the men randomized to the conventional-dose group (7). Figure 5 shows the values of SAN-stdKt/V in our patients as a function of center, gender, and age. SAN-stdKt/V was progressively lower in the children younger than age 14 and was lower than the candidate target value of 2.45 in all children <12 years of age regardless of gender.
To determine the dialysis prescription that would be required in the children <14 years of age to achieve a SAN-stdKt/V value of 2.45, we simulated weekly BUN profiles for each of the children in center 1 using the same K and fluid removal rate and the same value for V and G as calculated in their modeling session. We increased time progressively, keeping to a 3-times/wk schedule, to a maximum time value of 8 hours. The results are presented in Table 4. The three patients from center 1 who were 12 to 13 years of age were already close to a hypothetical SAN-stdKt/V target of 2.45 and would need only minimal, if any, changes to their existing prescriptions. Three patients aged 7.5 to 10 years would need to have session lengths extended to 5 to 6 hours to achieve a 2.45-SAN-stdKt/V target using a thrice-weekly schedule, although perhaps some additional increase in blood flow or dialyzer efficiency might allow a slightly shorter session length. The required 5- to 6-hour session lengths would not be practical unless a nocturnal dialysis schedule were to be adopted. Otherwise, these three patients would need to dialyze more frequently than thrice weekly. The remaining seven patients from center 1 were ≤5 years of age. In four of these seven, a SAN-stdKt/V target of 2.45 could be achieved using a 3-times/wk schedule, but only if t was extended to 8 hours, perhaps using a nocturnal schedule. In the remaining three of these youngest patients, dialysis would have to be given more frequently than 3 times/wk.
Table 4.
Target stdKt/V values and projected stdKt/V with increasing t for patients in Center 1 with age <14 years
| Age | Vant/S | Actual stdKt/V (t = 240 minutes) | Target stdKt/Va (SAN-stdKt/V = 2.45) | Projected stdKt/V at t (minutes) |
Target t (minutes) | ||
|---|---|---|---|---|---|---|---|
| 300 | 360 | 420 | |||||
| 1.4 | 10.3 | 2.80 | 4.14 | 3.05 | 3.24 | 3.39 | >480 |
| 2 | 11.8 | 2.87 | 3.63 | 3.15 | 3.36 | 3.52 | 480 |
| 2.5 | 11.9 | 2.63 | 3.60 | 2.94 | 3.18 | 3.38 | >480 |
| 3 | 12.3 | 2.39 | 3.48 | 2.69 | 2.93 | 3.13 | >480 |
| 3 | 12.2 | 2.71 | 3.51 | 2.98 | 3.19 | 3.36 | 480 |
| 5 | 12.4 | 2.72 | 3.46 | 2.99 | 3.20 | 3.36 | 480 |
| 5 | 12.3 | 2.56 | 3.49 | 2.87 | 3.11 | 3.31 | 480 |
| 7.5 | 13.6 | 2.77 | 3.15 | 3.06 | 3.30 | 3.49 | 320 |
| 8 | 14.7 | 2.59 | 2.92 | 2.88 | 3.12 | 3.31 | 310 |
| 10 | 14.0 | 2.63 | 3.04 | 2.90 | 3.11 | 3.28 | 340 |
| 12 | 17.0 | 2.82 | 2.78 | 3.12 | 3.35 | 3.54 | 240 |
| 12 | 14.5 | 2.79 | 2.63 | 3.08 | 3.30 | 3.45 | 240 |
| 13 | 17.6 | 2.60 | 2.86 | 2.88 | 3.10 | 3.27 | 300 |
Target stdKt/V calculated as 2.45·17.5/Vant/S.
Discussion
In these two pediatric dialysis units, children were being dialyzed 3 times/wk and their delivered dialysis dose, as assessed by formal modeling, was completely compliant with current K/DOQI guidelines (1). In center 1 and 2, respectively, the mean URR values were 77% and 70%, the spKt/V values averaged 1.81 and 1.45, and the stdKt/V values averaged 2.70 and 2.34. These values are well above the K/DOQI recommended minimums for adults and children of 65% (URR), 1.2 (spKt/V), and 2.14 (stdKt/V when measured by formal modeling). However, on rescaling dose to S, specifically, in terms of Vant/S-normalized stdKt/V, the dialysis dose received by these children, especially those <10 years of age, was much less than comparable SAN doses being given to older adolescents. In children <7 years of age, the shortfall in dose was of such a magnitude that, to correct it, a change to a more frequent dialysis schedule would most likely be necessary.
What is the rationale for changing the dialysis denominator from V to S? The concept of using V is based on the use of urea as a target solute. Urea is distributed in the total body water, and G is proportional to V (12). However, total body water in adult patients is importantly determined by muscle mass. It is not clear that muscle tissue per se generates important amounts of uremic toxins (18). Also, the amount of muscle mass relative to S is higher in men than in women and higher in African Americans than in Caucasians (reviewed in reference 18). Adjusting dialysis dose on the basis of V is a de facto adjustment of dialysis dose to muscle mass, and a V-based dosing system will result in relatively more dialysis for men than comparably sized (in terms of S) women and more dialysis for African Americans than for comparably sized Caucasians (7,15–18). Also, because V is more steeply related to body weight than is S, a V-based dialysis dosing system will allow marked reductions in dose for lighter patients compared with heavier patients, more so than an S-based dosing system, because the decrement in S for lighter patients is relatively attenuated compared with the decrement in V (7,15–18).
In effect, if one considers dialysis as “replacement renal function,” it makes some sense to scale dialysis to body size and age the same way the kidney function calculated as GFR is scaled. In adult kidney donors, iothalamate-measured GFR is higher in men than in women, but the difference disappears when GFR is scaled to S (24). In contrast, if GFR is scaled to V, a marked gender disparity results, with adjusted GFR/V being considerably higher in women than in men (24). In children, inulin-measured GFR divided by S is relatively constant in different age groups until one gets below 2 years of age (reviewed in reference 25). Kidney size, which logically is related to GFR, also is related to S (reviewed in reference 25).
Whereas the argument of scaling dialysis dose to V or S in adults affects primarily sex-based differences, in prepubertal children especially the ratio of V to S in both genders is markedly lower than that in older adolescents or adults. For example, in adult ESRD patients enrolled in the HEMO study, the median ratio of Watson-estimated V to Dubois-estimated S was approximately 18.5 in women and 21.5 in men (17). For this reason, a value of 20 for the Vant-to-S ratio represents more or less a population mean value for adult (late middle-age or elderly) ESRD patients. In the data presented here, in adolescents aged 15 to 18, Vant/S calculated using Morgenstern/Gehan averaged approximately 17.5, considerably lower than the mean value of 20 using Watson/Dubois in HEMO study patients. However, the Watson estimate was derived from healthy subjects, and when we calculated the population mean V-to-S ratio using an estimating equation for V developed using the HEMO study data (26), this ratio was also in the range of 17.5 to 18 (7). The actual value of the mean V-to-S ratio is not critical. The SAN-stdKt/V normalization adjusts to whatever the mean value is in adults to allow for compensation for the effects on the V/S ratio of gender (in adults) or age in younger children.
Figures 3 and 4 show what the percent difference in dose will be when comparing a V-scaled dialysis measure with an S-scaled measure. It can be seen from these figures that a 10-year-old child will have a V-to-S ratio that is approximately 80% that of an older adolescent, and a 4-year-old child will have a V-to-S ratio that is approximately 60% to 70% of the older adolescent value. Therefore, their required dialysis doses would need to be multiplied by 1/0.8 = 1.25, or 1/0.65 = 1.53, respectively. Ideally this adjustment should be applied to a continuous equivalent of the dialysis dose (e.g., stdKt/V). For any given frequency of treatments per week, the relationship between session eKt/V and stdKt/V is curvilinear; hence, it is difficult if not impossible to achieve a 50%, or even a 25%, increase in stdKt/V unless the frequency of treatments is increased.
In our simulations, we chose a target SAN-stdKt/V of 2.45. This is the value that was attained in the women randomized to the high-dose group in the HEMO study (URR of approximately 75%). However, this is also close to the currently prescribed dose for women as shown by the fact that in recent USRDS data reports, the mean URR in women is currently approximately 75% (27) The SAN-stdKt/V value of 2.45 corresponds to a URR of only 67% in men in the HEMO trial, and this is actually lower than the URR currently being delivered according to information from the 2009 USRDS data (27).
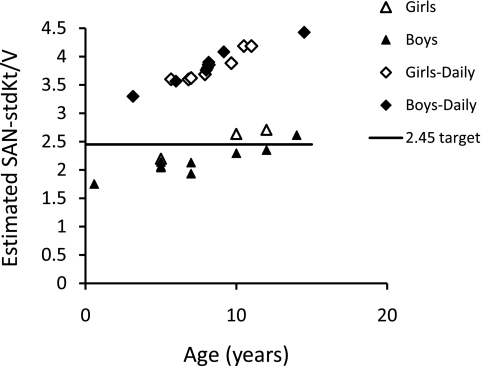
Although there are no randomized trials of dialysis adequacy in children, there are several observational studies reporting improved results with more frequent dialysis (reviewed in reference 28). Two recently reported series are of interest: one by Tom et al. (10), in which 5-hour, 3-times/wk treatments were given; and one by Fischbach et al. (11), in which 3-hour, 6-times/wk hemodiafiltration treatments were provided. In both series, a marked increase in growth was reported. Using the data from the patients reported in these papers, we computed the approximate dose in terms of the SAN-stdKt/V that was being delivered. The Vant-to-S ratio in this calculation was not done on a per-patient basis because height and weight were not available, but we used the general regression of Vant/S versus age derived from Figure 3. The results are shown in Figure 6. It is clear that in the 3-times/wk treatments given by Tom et al., SAN-stdKtV values of 2.45 were achieved in the older children, although not in those under age 10. In the Fischbach study, all children had SAN-stdKt/V values well over 2.45. Also, in the latter treatment group, the provision of convective solute removal via hemodiafiltration may a have been of additional benefit.
Figure 6.
Estimated SAN-stdKt/V versus age in two studies in which increased growth rates were linked to intensified dialysis regimens, one with hemodialysis treatments given 3 times/wk by Tom et al. (10) and one using 6-times/wk hemodiafiltration by Fischbach et al. (11).
We believe it would be premature to suggest mandating a change to more frequent dialysis in younger children at this point in time. Such a change in clinical practice would have major implications: Should all pediatric dialysis centers now present dialysis as a 4- to 6-d/wk therapy for all patients younger than 10 to 12 years of age? This would have substantial financial ramifications as well as other issues—social, educational, organizing the family around the child's care, etc. One must be careful about recommending a global increase in pediatric dialysis dose on the basis of a theoretical analysis, and further studies, including randomized controlled trials with hard end points, are urgently needed in this area.
If one did move to a more frequent dialysis schedule, attainment of a SAN-stdKt/V of 2.45 would be very easy, even for very young patients with a low Vant-to-S ratio. For example, two very young patients in center 1 are on 6-d/wk dialysis because of the underlying disease of primary hyperoxaluria to achieve maximum clearance of oxalate. Their SAN-std Kt/V values (3.36 and 4) were well above 2.45, despite an S value of only 0.5 m2 and Vant/S of approximately 11.
In summary, our results suggest that if one rescales dialysis dose proportional to S, then most children <10 years of age being dialyzed 3 times a week are not currently achieving a SAN dose comparable to those given routinely to adult patients or to older adolescents. This is true even when levels of session eKt/V are quite high and t is 4 hours. To achieve such a comparable SAN dose, most children <10 years of age would require hemodialysis >3 times/wk.
Disclosures
None.
Footnotes
Published online ahead of print. Publication date available at www.cjasn.org.
Access to UpToDate on-line is available for additional clinical information at http://www.cjasn.org/
References
- 1.Hemodialysis Adequacy 2006 Work Group: Clinical practice guidelines for hemodialysis adequacy, update 2006. Am J Kidney Dis 48[ Suppl 1]: S2– S90, 2006 [DOI] [PubMed] [Google Scholar]
- 2.Keshaviah P: The solute removal index: A unified basis for comparing disparate therapies. Perit Dial Int 15: 101– 104, 1995 [PubMed] [Google Scholar]
- 3.Gotch FA: The current place of urea kinetic modeling with respect to different dialysis modalities. Nephrol Dial Transplant 13[ Suppl 6]: 10– 14, 1998 [DOI] [PubMed] [Google Scholar]
- 4.Leypoldt JK: Urea standard Kt/V for assessing dialysis treatment adequacy. Hemodial Int 8: 193– 197, 2004 [DOI] [PubMed] [Google Scholar]
- 5.Daugirdas JT, Depner TA, Greene T, Levin NW, Chertow GM, Rocco MRthe Frequent Hemodialysis Network (FHN) Trial Group: Standard Kt/Vurea: A method of calculation that includes the effects of fluid removal and residual kidney clearance. Kidney Int 2010, in press [DOI] [PubMed] [Google Scholar]
- 6.Eknoyan G, Beck GJ, Cheung AK, Daugirdas JT, Greene T, Kusek JW, Allon M, Bailey J, Delmez JA, Depner TA, Dwyer JT, Levey AS, Levin NW, Milford E, Ornt DB, Rocco MV, Schulman G, Schwab SJ, Teehan BP, Toto R; Hemodialysis (HEMO) Study Group: Effect of dialysis dose and membrane flux in maintenance hemodialysis. N Engl J Med 347: 2010– 2019, 2002 [DOI] [PubMed] [Google Scholar]
- 7.Daugirdas JT, Greene T, Chertow GM, Depner TA: Can rescaling of dialysis dose to body surface area in the HEMO study explain the different results in men vs. women? Kidney Int 2010, manuscript under review [DOI] [PMC free article] [PubMed] [Google Scholar]
- 8.Greene T, Daugirdas JT, Depner TA, Gotch F, Kuhlmann M: Frequent Hemodialysis Network Study Group: Solute clearances and fluid removal in the frequent hemodialysis network trials. Am J Kidney Dis 53: 835– 844, 2009 [DOI] [PubMed] [Google Scholar]
- 9.Fadrowski JJ, Frankenfield D, Amaral S, Brady T, Gorman GH, Warady B, Furth SL, Fivush B, Neu AM: Children on long-term dialysis in the United States: Findings from the 2005 ESRD clinical performance measures project. Am J Kidney Dis 50: 958– 966, 2007 [DOI] [PubMed] [Google Scholar]
- 10.Tom A, McCauley L, Bell L, Rodd C, Espinosa P, Yu G, Yu J, Girardin C, Sharma A: Growth during maintenance hemodialysis: Impact of enhanced nutrition and clearance. J Pediatr 134: 464– 471, 1999 [DOI] [PubMed] [Google Scholar]
- 11.Fischbach M, Terzic J, Menouer S, Dheu C, Seuge L, Zalosczic A: Daily on line haemodiafiltration promotes catch-up growth in children on chronic dialysis. Nephrol Dial Transplant 2010, in press [DOI] [PubMed] [Google Scholar]
- 12.Gotch FA, Sargent JA: A mechanistic analysis of the National Cooperative Dialysis Study (NCDS). Kidney Int 28: 526– 534, 1985 [DOI] [PubMed] [Google Scholar]
- 13.Lowrie EG, Chertow GM, Lew NL, Lazarus JM, Owen WF: The urea [clearance × dialysis time] product (Kt) as an outcome-based measure of hemodialysis dose. Kidney Int 56: 729– 737, 1999 [DOI] [PubMed] [Google Scholar]
- 14.Lowrie EG, Li Z, Ofsthun N, Lazarus JM: The online measurement of hemodialysis dose (Kt): Clinical outcome as a function of body surface area. Kidney Int 68: 1344– 1354, 2005 [DOI] [PubMed] [Google Scholar]
- 15.Daugirdas JT: Urea Kinetic Modeling Appendix. In: Handbook of Dialysis, 4th Ed., edited by Daugirdas JT, Blake PB, Ing TS.Philadelphia, Kluwer, 2006 [Google Scholar]
- 16.Spalding EM, Chandna SM, Davenport A, Farrington K: Kt/V underestimates the hemodialysis dose in women and small men. Kidney Int 74: 348– 355, 2008 [DOI] [PubMed] [Google Scholar]
- 17.Daugirdas JT, Depner TA, Greene T, Kuhlmann MK, Levin NW, Chertow GM, Rocco MV: Surface-area-normalized Kt/V: A method of rescaling dialysis dose to body surface area-implications for different-size patients by gender. Semin Dial 21: 415– 421, 2008 [DOI] [PMC free article] [PubMed] [Google Scholar]
- 18.Daugirdas JT, Levin NW, Kotanko P, Depner TA, Kuhlmann MK, Chertow GM, Rocco MV: Comparison of proposed alternative methods for rescaling dialysis dose: Resting energy expenditure, high metabolic rate organ mass, liver size, and body surface area. Semin Dial 21: 377– 384, 2008 [DOI] [PMC free article] [PubMed] [Google Scholar]
- 19.Morgenstern BZ, Wühl E, Nair KS, Warady BA, Schaefer F: Anthropometric prediction of total body water in children who are on pediatric peritoneal dialysis. J Am Soc Nephrol 17: 285– 293, 2006 [DOI] [PubMed] [Google Scholar]
- 20.Gehan E, George SL: Estimation of human body surface area from height and weight. Cancer Chemother Rep 54: 225– 235, 1970 [PubMed] [Google Scholar]
- 21.Daugirdas JT, Depner TA, Greene T, Silisteanu P: Solute-solver: A web-based tool for modeling urea kinetics for a broad range of hemodialysis schedules in multiple patients. Am J Kidney Dis 54: 798– 809, 2009 [DOI] [PubMed] [Google Scholar]
- 22.Watson PE, Watson ID, Batt RD: Total body water volumes for adult males and females estimated from simple anthropometric measurements. Am J Clin Nutr 33: 27– 39, 1980 [DOI] [PubMed] [Google Scholar]
- 23.Dubois D, Dubois EF: A formula to estimate the approximate surface area if height and weight be known. Arch Intern Med 17: 863– 871, 1916 [Google Scholar]
- 24.Daugirdas JT, Meyer K, Greene T, Butler RS, Poggio ED: Scaling of measured glomerular filtration rate in kidney donor candidates by anthropometric estimates of body surface area, body water, metabolic rate, or liver size. Clin J Am Soc Nephrol 4: 1575– 1583, 2009 [DOI] [PMC free article] [PubMed] [Google Scholar]
- 25.Schwartz GJ, Work DF: Measurement and estimation of GFR in children and adolescents. Clin J Am Soc Nephrol 4: 1832– 1843, 2009 [DOI] [PubMed] [Google Scholar]
- 26.Daugirdas JT, Greene T, Depner TA, Chumlea C, Rocco MV, Chertow GM: Hemodialysis (HEMO) Study Group: Anthropometrically estimated total body water volumes are larger than modeled urea volume in chronic hemodialysis patients: Effects of age, race, and gender. Kidney Int 64: 1108– 1119, 2003 [DOI] [PubMed] [Google Scholar]
- 27.U.S. Renal Data Systems: 2009 Annual Report, Bethesda MD, National Institutes of Health, National Institute of Diabetes and Digestive and Kidney Diseases, 2009 [Google Scholar]
- 28.Müller D, Zimmering M, Chan CT, McFarlane PA, Pierratos A, Querfeld U: Intensified hemodialysis regimens: Neglected treatment options for children and adolescents. Pediatr Nephrol 23: 1729– 1736, 2008 [DOI] [PubMed] [Google Scholar]


