Abstract
Background and objectives: Variable hemoglobin (Hb) response to erythropoiesis stimulating agents may result in adverse outcomes. The utility of model predictive control for drug dosing was previously demonstrated.
Design, setting, participants, & measurements: This was a double-blinded, randomized, controlled trial to test model predictive control for dosing erythropoietin in ESRD patients. The trial included 60 hemodialysis patients who were randomized into a treatment arm (30 subjects) that received erythropoietin doses on the basis of the computer recommendations or a control arm (30 subjects) that received erythropoietin doses on the basis of recommendations from a standard anemia management protocol (control). The subjects were followed for 8 months, and the proportions of measured Hb within the target of 11 to 12 g/dl and outside 9 to 13 g/dl were measured. Variability of the Hb level was measured by the absolute difference between the achieved Hb and the target Hb of 11.5 g/dl as well as the area under the Hb curve.
Results: Model predictive control resulted in 15 observations >13 or <9 g/dl (outliers), a mean absolute difference between achieved Hb and 11.5 g/dl of 0.98 ± 0.08 g/dl, and an area under the Hb curve of 2.86 ± 1.46. The control group algorithm resulted in 30 Hb outliers (P = 0.051), produced a mean absolute difference between achieved Hb and 11.5 g/dl of 1.18 ± 0.18 g/dl (P < 0.001 difference in variance), and an area under the Hb curve of 3.38 ± 2.69 (P = 0.025 difference in variance).
Conclusions: Model predictive control of erythropoietin administration improves anemia management.
Anemia in ESRD patients is effectively treated by the administration of erythropoiesis-stimulating agents (ESAs) such as recombinant human erythropoietin (EPO). The National Kidney Foundation Kidney Disease Outcomes Quality Initiative (NKF-K/DOQI) guidelines recommend a hemoglobin (Hb) target between 11 and 12 g/dl (1). The NKF-K/DOQI later amended recommendations to maintain Hb levels above 11 g/dl with little evidence to justify Hb levels above 13 g/dl (2). Recently reported observations in chronic kidney disease patients demonstrate that higher Hb concentrations are associated with increased risk and no improvement in the quality of life (3,4).
Effective anemia management is complex and expensive. To provide standardized care for ESRD patients, NKF-K/DOQI developed and published guidelines on EPO dosing (1). In most hemodialysis facilities, nonvalidated algorithmic anemia management protocols (AMP) are used for EPO administration on the basis of these guidelines. Despite these algorithms, patients move through the target range during the year and only approximately one-third (38%) are within the target range at any given time (5). This behavior is not surprising given the contribution of measurement error, the fact that patients' responsiveness to EPO can change over time, and the economic and medical pressures to avoid falling below or exceeding specific levels.
More precise control of ESA dosing is needed to avoid adverse effects associated with increased Hb concentrations while minimizing the effects of anemia. We have demonstrated that a new approach to ESA administration that is based on model predictive control (MPC) improves the effectiveness of the therapy by decreasing the deviation of Hb from 11.5 mg/dl, which is the midpoint of the recommended range of 11 to 12 g/dl (6). We now present results of a double-blinded, randomized control trial in which MPC was compared against a trained nurse practitioner following a standard AMP.
Materials and Methods
Study Design
MPC is an advanced control method applicable to drug dosing (7). It uses a predictive model of the controlled process to plan future changes in the process inputs aiming for a desired outcome. In our application, the controller determines the EPO dose to be delivered, subject to current Hb level and prior EPO dose(s), to minimize the Hb deviation from a preset Hb target.
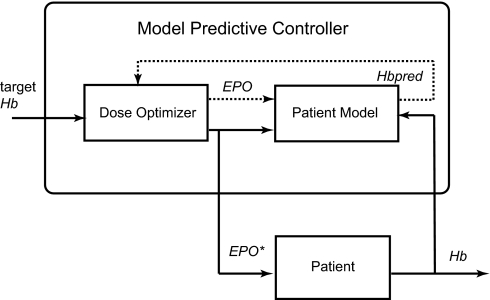
The proposed MPC system for EPO dosing is shown in Figure 1. It contains two blocks: (1) the patient model, which predicts the Hb response to EPO, and (2) the dose optimizer. We used the following mathematical equation to represent the patient model:
The monthly Hb change (ΔHb) was estimated by an artificial neural network developed from the Hb and EPO data records of 100 patients undergoing anemia management in the year 2005 at our dialysis unit. We developed this model using the approach we have described previously (8).
Figure 1.
Schematic diagram of MPC applied to EPO administration.
The role of the dose optimizer is to generate and evaluate a range of potential EPO dose changes that are used by the patient model to compute the predicted Hb (Hbpred). We performed the Hb prediction over a 3-month horizon by looping through the patient model 3 times. The dose optimizer evaluates the three predicted monthly Hb levels using the following cost function:
 |
This function (J) sums the absolute differences between the target Hb (11.5 g/dl) and the three predicted Hb levels. The most desirable EPO dose, EPO*, causes the predicted Hb to minimize the value of J. This dose is presented to the supervising physician for validation and administration to the patient.
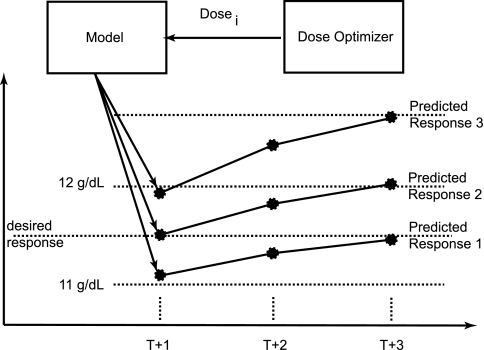
Figure 2 shows how the dose optimizer looks at the response for each evaluated dose and selects the dose that best achieves the desired response. This model makes use of the delay between the administered dose and the ultimate response through time for that dose in an attempt to reduce algorithmic cycling, or the artificial rise and fall in Hb because of the used dosing algorithm.
Figure 2.
Method used by MPC to determine best dose.
After delivering the recommended EPO dose to the patient, we measure the achieved Hb (Hb) at the beginning of the subsequent month. Differences between the predicted and the achieved Hb gradually decrease as we repeat the dose selection process every month. We evaluated EPO dose adjustments from a range of 50% of the last average monthly dose received up to a maximum of 114,000 U/wk. In the last 2 months, we limited the dose increase to 150% of the preceding dose.
We conducted a clinical trial comparing anemia management with MPC to a protocol based on an interpretation of the K/DOQI guidelines and the package insert for EPOGEN (AMP). The research protocol conformed to the Declaration of Helsinki and informed consent was obtained from each subject before participation in the study. The institutional review boards for the University of Louisville and the Louisville Veterans Administration Medical Center approved the study.
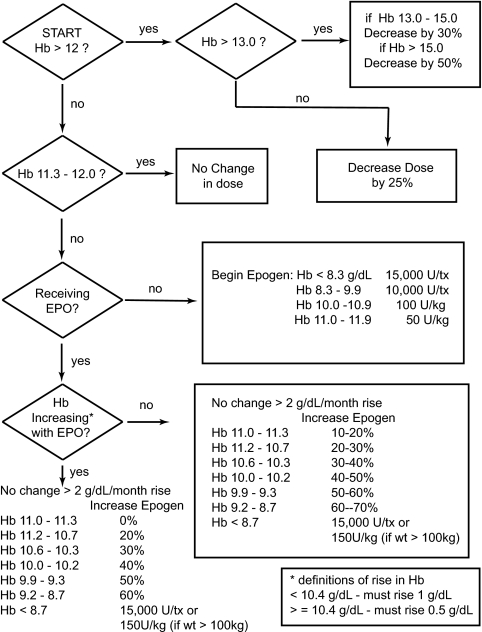
A total of 60 subjects were recruited and followed for 8 months from December 2006 until July 2007. The principal investigator randomly assigned the subjects to the treatment or the control arm using the select case function in SPSS. All subjects had EPO doses altered monthly by a blinded nurse practitioner according to an AMP, which was derived from NKF-K/DOQI recommendations and shown in Figure 3, or by MPC. The AMP was previously validated (6), and the blinded nurse practitioner was instructed to maintain Hb between 11 and 12 g/dl by targeting a value of 11.5 g/dl.
Figure 3.
AMP used in the control arm of the study.
Dosage recommendations were entered into a spreadsheet containing study participant name and dose and evaluated by the unblinded study physician. Recommended doses in both groups were validated by an unblinded physician supervisor before administration to the study participants according to membership in the control or treatment group. Intravenous iron sucrose was administered according to a protocol derived from NKF-K/DOQI recommendations. Iron was administered if ferritin was <500 and transferrin saturation (TSAT) was <30%. The maximum iron dose was 100 mg 3 times per week. The MPC algorithm was implemented in MATLAB (The Mathworks). The EPO dose and any EPO-related adverse events were recorded on a weekly basis.
Participants
Subjects were recruited to participate on the basis of the following entry criteria: (1) currently on EPO, (2) age 18 to 80 years, (3) adequacy of dialysis Kt/V ≥ 1.2, and (4) adequate iron stores as measured by ferritin and TSAT. Patients were excluded from participation for (1) diastolic blood pressure >100 mmHg, (2) life expectancy <6 months, (3) uncontrolled blood loss from gastric bleeding or other site, (4) frequent clotting of the dialyzer such that the expected number of reuses per dialyzer was less than four, (5) frequent access-related problems such as clotting, (6) active infection, (7) severe cardiac disease, and (8) coronary-artery bypass grafting in the 3 months before the study.
Statistical Methods
The sample size was based on a power analysis to detect a 15% and 20% difference in proportion assuming that Hb measurements during the 4-month evaluation period were independent. This resulted in a sample size of 121 (30 patients) and 62 (15.5 patients).
To establish the difference between the AMP and MPC, we evaluated the following statistical measures:
Proportion of observed Hb values within the target range of 11.0 to 12.0 g/dl and exceeding 13.0 g/dl or below 9.0 g/dl.
Mean absolute difference between achieved Hb and 11.5 g/dl and the variability of this measure.
Area under the Hb curve (AUC) and the variability of this measure defined as
 |
where i is the month and Hbobs(i) is the observed Hb for month i.
A 4-month washout/equilibration period was used to eliminate the effect of the EPO doses administered before the beginning of the study. The remaining 4 months were used to establish the difference between the AMP and MPC. Statistical comparisons were made using a two-sample t test for samples with unequal variance and by χ2.
Differences in weekly EPO dose between groups were evaluated by a repeated measures analysis correcting for sex, iron administration, vascular access, and hospitalization.
Results
Of 60 subjects enrolled in the study, 23 completed the study in the treatment arm and 28 completed the study in the control arm. In the treatment arm, one subject transferred out of the unit and six subjects died. Two of the deaths were cardiovascular in nature. All dropouts in the control arm were because of transfers. Dropouts in both groups occurred within the first 4 months of the study. Mortality rate for the study was below the facility rate.
The demographics of the two groups as they entered the study at randomization are shown in Table 1. Three subjects (one in AMP, two in MPC) had a ferritin level >800 ng/ml and a TSAT level >50%. The groups were similar except for some differences in the distribution of hemodialysis access and prevalence of diabetes. There were 15 grafts in the treatment group versus 7 in the control group. The number of catheters was the same (three).
Table 1.
Demographic and access data of the study population in December 2006 at time of randomization
| AMP | MPC | P Value | |
|---|---|---|---|
| Age | 58.6 ± 11.5 | 57.4 ± 15.7 | 0.7 |
| Race (black/white) | 21/9 | 24/6 | 0.6 |
| Gender (male/female) | 19/11 | 16/14 | 0.6 |
| Diabetes (yes/no) | 9/21 | 17/13 | 0.07 |
| Hb (g/dl) | 11.9 ± 1.3 | 11.7 ± 1.4 | 0.8 |
| EPO dose (1000 U/week) | 12.8 ± 13.1 | 14.9 ± 17.9 | 0.6 |
| Albumin | 3.86 ± 0.40 | 3.91 ± 0.32 | 0.5 |
| TSAT (%) | 31.3 ± 10.6 | 29.4 ± 11.2 | 0.5 |
| Ferritin (ng/ml) | 791 ± 590 | 757 ± 412 | 0.8 |
| Ferritin >800 ng/ml | 11/29 | 14/30 | 0.6 |
| Access (AV fistula/AV graft/CVC) | 20/7/3 | 12/15/3 | 0.09 |
CVC, central venous catheter.
No EPO dose recommendation made by the MPC or AMP was overridden by the physician supervisor. However, in the last 2 months of the study, we limited the maximum dose increase recommended by MPC to 150% of the last dose received in response to the U.S. Food and Drug Administration advisory on EPO.
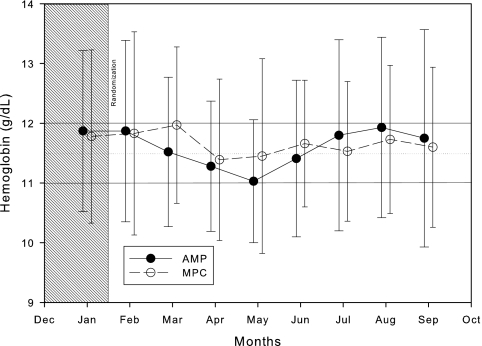
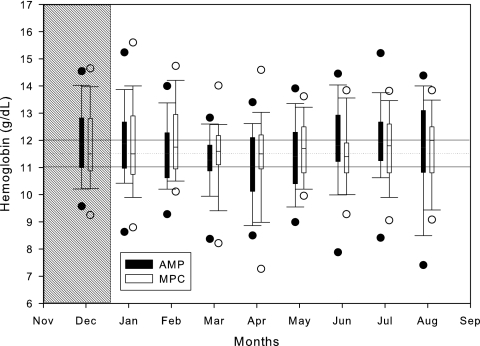
The mean and SD of Hb levels observed in the study subjects during the 8 months of the study are shown in Figure 4. The mean Hb levels achieved by MPC (open circles) are closer to 11.5 g/dl and are more stable than those achieved by the AMP (closed circles). A box plot of Hb level distributions over time between groups is shown in Figure 5. The results of the statistical analysis are shown in Table 2.
Figure 4.
Mean and SD of Hb achieved during the trial by group.
Figure 5.
Box plot of Hb level distributions over time achieved by group.
Table 2.
Comparisons between the control (AMP) and treatment group (MPC) for the statistical parameters of interesta
| Parameters | AMP | MPC |
P Value |
|
|---|---|---|---|---|
| Difference | Variance | |||
| Proportion 11.0 to 12.0 g/dl | 42/112 (37%) | 34/92 (37%) | 0.53b | |
| Proportion >13.0 and <9.0 g/dl | 30/112 (27%) | 15/92 (16%) | 0.05b | |
| Mean absolute difference from 11.5 g/dl | 1.14 ± 1.18 | 0.96 ± 0.70 | 0.16c | <0.001 |
| AUC | 3.38 ± 2.69 | 2.86 ± 1.46 | 0.41c | 0.025 |
| Number of dose changes | 3.9 ± 1.6 | 4.8 ± 2.2 | 0.031d | |
| Total EPO dose (1000 U) | 97.6 ± 66.1 | 129.3 ± 170.8 | 0.162c | 0.005 |
| 0.415e | ||||
| Total iron dose (mg) | 1133 ± 1212 | 1496 ± 1573 | 0.321c | 0.261 |
Values are proportions and mean ± SD.
Fisher's exact test.
t test.
Mann–Whitney U test.
Corrected for AV graft and hospitalization.
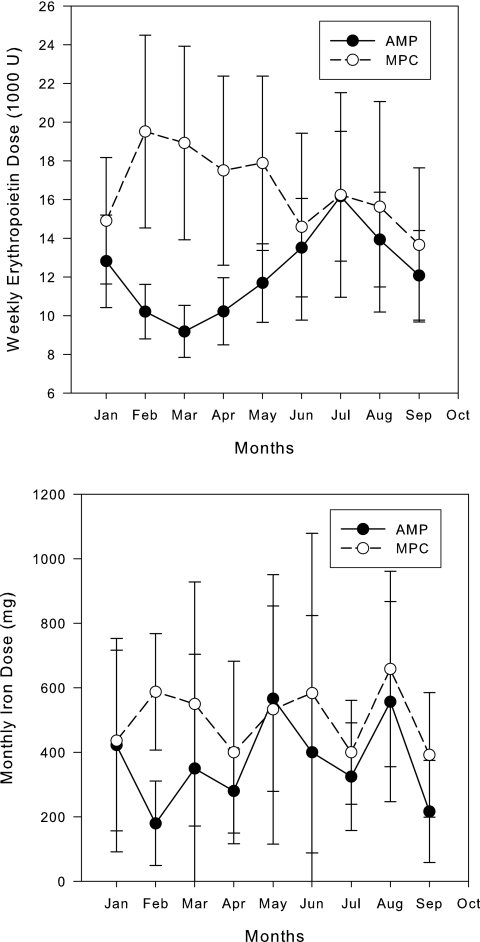
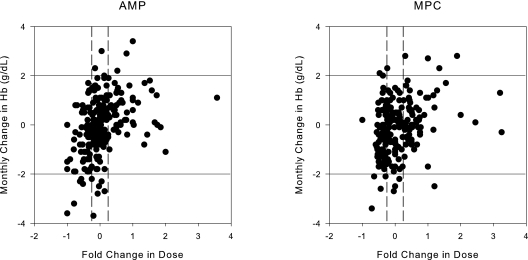
The weekly dose of EPO and the monthly iron dose for both groups are shown in Figure 6. The monthly change in Hb concentration plotted against the fold change in EPO dose for the two groups is shown in Figure 7.
Figure 6.
Average weekly EPO dose (SEM) and average monthly iron dose (SD) for both groups.
Figure 7.
Monthly change in Hb in response to the prior months' EPO dose as a fold change from the previous dose for AMP and MPC. The solid horizontal lines represent a 2-g/dl change in Hb and the vertical dashed lines represent a 25% change in dose.
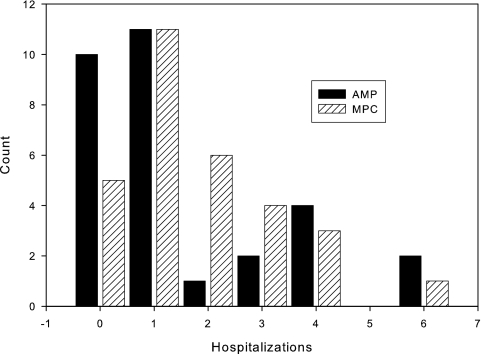
Figure 8 shows a histogram plot of hospitalization events between the two treatment arms. A total of 53 hospitalization events occurred in the treatment arm, compared with 47 in the control arm. There were 35 access-related, 22 cardiac, 4 endocrine, 1 gastrointestinal, 17 infectious, 7 neurologic, 6 vascular, and 8 hospitalizations for other reasons. The average Hb change due to hospitalization across both arms was −0.9 ± 1.7 g/dl. The average EPO dose received by the subjects during hospitalization was 50% of the recommended dose amount.
Figure 8.
Histogram of hospitalization events. The horizontal axis represents the number of hospitalizations, and the vertical axis represents the number of patients.
Discussion
We present the results of a randomized controlled study designed to evaluate the effectiveness of anemia management with a new drug dosing tool that we previously demonstrated in a pilot study (6). We show that the administration of EPO performed by the simplest version of our MPC algorithm leads to a 15% tighter control of Hb around the midpoint of the NKF-K/DOQI specified target range of 11 to 12 g/dl. As a result of this tighter control, MPC resulted in fewer patients with Hb levels above 13 g/dl and below 9 g/dl. This result is facilitated by the statistically significant decrease in variability of mean Hb and in the variability of Hb from the stated target of 11.5 g/dl.
Patients dosed using MPC appeared to use more total EPO than those dosed by nurse practitioners (although not statistically greater). The higher EPO usage was primarily seen in the first 4 months of the study as evidenced in Figure 6. Dosing was similar during the evaluation phase of the study. The amount of EPO used was modified by hospitalization but not by use of an arteriovenous (AV) graft. MPC was not optimized to conserve EPO and therefore these results are not unexpected. Future versions of our MPC tool can be developed that optimize the number of observations within a target range (10 to 12 g/dl or 11 to 12 g/dl) and the dose of EPO used. In fact, MPC can be controlled by the user to target any Hb concentration and therefore can be individualized for each dialysis facility. The differences in dosing did not appear to result in substantial changes in the mean rates of change in Hb as seen in Figure 7. The number of patients that had a rise in Hb >2 g/dl in a 1-month period was low in both groups. The length of the study presented here was too short to evaluate the effect of MPC on EPO dose and was not designed to evaluate this aspect of anemia management. Future versions of this tool will incorporate dose minimization as part of the objective function.
In this study, we used a washout period of 4 months. This purpose of using this washout period was to eliminate the effect of EPO doses administered before the beginning of the study. The model of erythropoiesis proposed by Uehlinger et al. (9) postulates that a single EPO dose remains effective for as long as the red blood cells (RBCs) it creates are alive. Furthermore, they estimated the average RBC lifespan in an ESRD patient to be around 60 days. Other studies show that the RBC lifespan in patients on EPO increases and approaches values typical for a healthy individual (approximately 120 days) (10). A 4-month washout would appear to accommodate these estimates.
Evaluation of the true effects of MPC is confounded by a partial failure of the randomization process to equalize risk. It is known that correct anemia management in patients with AV graft requires larger EPO doses than in patients with AV fistulae (11). The treatment group contained twice as many patients with AV graft as the control group. Further hospitalization was different between groups, and the effect on Hb was significant.
We used a simplified formulation of the MPC algorithm with the goal to only minimize the Hb variability without minimizing the change in EPO dose. As a result, MPC had a tendency to recommend aggressive dose increases when the Hb level reached values of ≤9 g/dl. The reason for this lies in the nature of the clinical data we used to develop the MPC. These data were collected during actual treatment and contain predominantly Hb values close to the target range. This is a common problem in mathematical modeling of clinical data (12). Several studies indicate potential risks of using excessive EPO doses (3). Although we did not observe adverse events due to large EPO doses in the treatment arm, we decided to limit the maximum dose increase to 150% of the current dose in the course of the study. To address the aggressive dosing performed by MPC for low Hb, we will incorporate components into the MPC that constrain the dose adjustment and prevent excessive Hb changes in future applications.
We chose to use as the control group an anemia protocol managed by humans, in particular nurse practitioners with >5 years of anemia management experience. These nurses were well acquainted with the subjects in the study and add value to the AMP used by being able to add specific knowledge about the subject in modifying the dose (e.g., recent hospitalization, infection, etc.) that MPC did not use. The AMP that the nurses followed is similar to those used at all hemodialysis facilities and has been previously validated in our prior work. As an example of how the nurse-dosed group performed, one subject did not require a change in EPO dose during the study, and this subject was in the AMP group. It is likely that MPC would have changed the dose of this patient. This example and others resulted in the AMP group having the largest range in variability with those subjects, with the highest and lowest variability occurring in this group. MPC resulted in moderate variability. The goal of future work will be to incorporate the low variability of the nurse-dosed AMP group into MPC.
This work and our previous work (6) represent a new approach to the management or EPO dosing in an in-center hemodialysis population and to the best of our knowledge is the only application of these techniques in a clinical setting for the management of anemia. Others have used computer-based algorithms like that used in AMP with good results (13,14). Our approach is to develop a pharmacodynamic model of EPO response and combine that with a dose optimizer into the MPC tool that we have developed. A key feature of our approach is the ability to predict Hb 3 months into the future. We show that this approach resulted in fewer Hb measurements >13 and <9 g/dl. Other work in this area and tested in clinical trials has concentrated on the computer implementation of paper algorithms (15). At this time, MPC is limited to intravenous EPO in hemodialysis patients. Expanding the application of MPC to other ESAs, patient populations, and routes of administration are the goal of future research efforts.
In summary, MPC was better at avoiding high and low Hb compared with paper implementation of an EPO dosing algorithm managed by experienced nurse practitioners. Our implementation of MPC is primarily different from an algorithmic approach by the prediction of Hb 1, 2, and 3 months into the future and that the desired Hb is achieved at 3 months. Furthermore, we allow for the contribution of past EPO doses to continue to affect Hb for 3 months. Approaching anemia management using MPC then allows us to provide some level of individualization on the basis of the distance between the current and desired Hb and the sequence of EPO doses leading up to the current dosing decision.
Disclosures
None.
Acknowledgments
This material is based on work supported by the Office of Research and Development, Medical Research Service, Department of Veterans Affairs and National Institute of Diabetes and Digestive and Kidney Diseases grant 1K25DK072085.
Footnotes
Published online ahead of print. Publication date available at www.cjasn.org.
References
- 1.National Kidney Foundation: NKF-K/DOQI Clinical Practice Guidelines for Anemia of Chronic Kidney Disease: Update 2000. Am J Kidney Dis 37: S182– S238, 2001 [DOI] [PubMed] [Google Scholar]
- 2.National Kidney Foundation: NKF-K/DOQI Clinical Practice Guidelines for Anemia of Chronic Kidney Disease: Update 2000. Am J Kidney Dis 47: S33– S53, 2006 [Google Scholar]
- 3.Singh AK, Szczech L, Tang KL, Barnhart H, Sapp S, Wolfson M, Reddan D: Correction of anemia with epoetin alfa in chronic kidney disease. N Engl J Med 355: 2085– 2098, 2006 [DOI] [PubMed] [Google Scholar]
- 4.Drueke T, Locatelli F, Clyne N, Eckardt K, MacDougall I, Tsakiris D, Burger H, Scherhag A: Normalization of hemoglobin level in patients with chronic kidney disease and anemia. N Engl J Med 355: 2071– 2084, 2006 [DOI] [PubMed] [Google Scholar]
- 5.Lacson E, Ofsthun N, Lazarus JM: Effect of variability in anemia management on hemoglobin outcomes in ESRD. Am J Kidney Dis 41: 111– 124, 2003 [DOI] [PubMed] [Google Scholar]
- 6.Gaweda AE, Jacobs AA, Aronoff GR, Brier ME: Model predictive control of erythropoietin administration in the anemia of ESRD. Am J Kidney Dis 51: 71– 79, 2008 [DOI] [PubMed] [Google Scholar]
- 7.Chassin LJ, Wilinska ME, Hovorka R: Evaluation of glucose controllers in virtual environment: Methodology and sample application. Artif Intell Med 32: 171– 181, 2004 [DOI] [PubMed] [Google Scholar]
- 8.Gaweda AE, Jacobs AA, Brier ME, Zurada JM: Pharmacodynamic population analysis in chronic renal failure using artificial neural networks—A comparative study. Neural Networks 16: 841– 845, 2003 [DOI] [PubMed] [Google Scholar]
- 9.Uehlinger DE, Gotch FA, Sheiner LB: A pharmacodynamic model of erythropoietin therapy for uremic anemia. Clin Pharmacol Ther 51: 76– 89, 1992 [DOI] [PubMed] [Google Scholar]
- 10.Schwartz AB, Kahn SB, Kelch B, Kim KE, Pequignot E: RBC improved survival due to recombinant human erythropoietin explains effectiveness of less frequent, low dose subcutaneous therapy. Clin Nephrol 38: 283– 289, 1992 [PubMed] [Google Scholar]
- 11.Goicoechea M, Caramelo C, Rodriguez P, Verde E, Gruss E, Albalate M, Ortiz A, Casado S, Valderrábano F: Role of type of vascular access in erythropoietin and intravenous iron requirements in haemodialysis. Nephrol Dial Transplant 16: 2188– 2193, 2001 [DOI] [PubMed] [Google Scholar]
- 12.MacNamee B, Cunningham P, Byrne S, Corrigan OI: The problem of bias in training data in regression problems in medical decision support. Artif Intell Med 24: 51– 70, 2002 [DOI] [PubMed] [Google Scholar]
- 13.Richardson D, Bartlett C, Jones C, Will EJ: An evolving computer-aided algorithm for the management of renal anemia in a hemodialysis cohort. J Am Soc Nephrol 10: 179A, 1999 [Google Scholar]
- 14.Tolman C, Richardson D, Bartlett C, Will E: Structured conversion from thrice weekly to weekly erythropoietic regimens using a computerized decision-support system: A randomized clinical study. J Am Soc Nephrol 16: 1463– 1470, 2005 [DOI] [PubMed] [Google Scholar]
- 15.West RM, Harris K, Gilthorpe MS, Tolman C, Will EJ: Functional data analysis applied to a randomized controlled clinical trial in hemodialysis patients describes the variability of patient responses in the control of renal anemia. J Am Soc Nephrol 18: 2371– 2376, 2007 [DOI] [PubMed] [Google Scholar]


