Abstract
Background
A significant problem in the operation of mechanical heart valve prostheses is the propensity for thrombus formation near the valve leaflet and housing. This may be caused by the high shear stresses present in the leakage jet flows through small gaps between leaflets and the valve housing during the valve closure phase.
Methods
This two-dimensional study was undertaken to demonstrate that design changes in bi-leaflet mechanical valves result in notable changes in the flow-induced stresses and prediction of platelet activation. A Cartesian grid technique is used for the 2D simulation of blood flow through two models of the bi-leaflet mechanical valve and their flow patterns, closure characteristics and platelet activation potential are compared. A local mesh refinement algorithm allows efficient and fast flow computations with mesh adaptation based on the gradients of the flow field in the gap between the leaflet and housing at the instant of valve closure. Leaflet motion is calculated dynamically based on the fluid forces acting on it. Platelets are modeled and tracked as point particles by a Lagrangian particle tracking method which incorporates the hemodynamic forces on the particles.
Results
The comparison of results shows that the velocity, wall shear stress, and simulated platelet activation parameter are lower in the valve model with a smaller angle of leaflet traverse between the fully open to the fully closed position. The parameters are also affected to a lesser extent by the local changes in the leaflet and housing geometry.
Conclusions
Computational simulations can be used to examine local design changes to help minimize the fluid induced stresses that may play a key role in thrombus initiation with the implanted mechanical valves.
Keywords: Bi-leaflet Valve, Platelet Activation, Cartesian Grid, Vortex Interaction, Comparison of valves
INTRODUCTION
Mechanical heart valve prostheses have been employed as a replacement for diseased human heart valves for more than four decades and provide the ability for patients to lead a relatively normal life. However, patients with implanted mechanical valves have to be under long-term anticoagulant therapy in order to mitigate problems due to thrombus deposition on the valves and ensuing embolic complications [1,2]. Numerous studies have suggested the development of abnormal flow dynamics past heart valve prostheses and the resulting relatively high shear stresses as factors in the activation and aggregation of platelets resulting in thrombus deposition. The fluid dynamics during the mechanical valve opening phase in the aortic position and the resulting turbulent stresses downstream from the valve structures have been reported in the literature [3,4,5,6]. King et al.[7] analyzed the effect of two different leaflet opening angles for the bileaflet mechanical valve and suggested that valves with larger opening angles yielded more centralized flow characteristics downstream even though valves opening to an angle of 85° resulted in increased wall shear stresses compared to that at 78°.
Several recent studies strongly suggest that the fluid dynamics during the closing phase, particularly in the mitral position, may be dominant in the development of thrombus in the vicinity of the mechanical heart valves [8,9]. Thrombus deposition with the mechanical valves is often found in the peripheral region of bileaflet mechanical valves in the vicinity of the leaflet edge and the valve housing as well as in the hinge region. Experimental studies to assess the cavitation potential with mechanical valves have demonstrated the presence of large positive and negative pressure transients on the downstream and upstream side of the leaflets during the valve closing phase [10] and computational simulations have shown that high-velocity jet-like flow is induced in the gap between the leaflet edge and the valve housing at the instant of valve closure [9]. The computed flow-induced shear stresses are of relatively high magnitude and platelets in these regions have the potential to become activated. Experimental studies have demonstrated the activation of platelets due to shear stress magnitudes larger than 10 Pascals (Pa) [1 Pa = 10 dynes/cm2] particularly in the presence of foreign surfaces in the human circulation such as the mechanical valve structures [11]. Several computational studies have also proposed a platelet activation parameter as the integral of shear stress that the platelet may be subjected to in these high shear flow regions and the duration of exposure of platelets to these high shear stress magnitudes [12,13]. Immediately after valve closure and leaflet rebound, large vortical flow development has also been observed experimentally [14, 15, 16] and computationally [8, 9] and it can also be anticipated that those platelets that are activated during the valve closure may be trapped in these vortical flows for a significant duration and hence have a tendency to aggregate and attach to the valve structures in this region resulting in the initiation of thrombus formation. Number of studies has suggested a similar mechanism for the tendency for thrombus deposition in the hinge region for the bileaflet valves as well [17,18, 19].
The design and development of mechanical valves have been empirical to date and the flow dynamics past mechanical valves during the valve function can be anticipated to be dependent on the design of these valves. Computational fluid dynamics can be exploited to study the effect of various design parameters on the resulting flow dynamics and can be potentially employed to improve the design of the mechanical valves to provide optimal flow dynamics that minimizes the potential for platelet activation. Even though initial computational studies were restricted to simulations with steady flow across the valve leaflets in the stationary fully open position [20], more recently, studies employing fluid-structure interaction (FSI) analysis for the simulation of unsteady flow past moving leaflets have been reported [8,3]. FSI analysis for valve dynamics encounters numerous challenges such as the requirement for the development of complicated three-dimensional (3D) geometry including the hinge region, development of a strongly coupled FSI analysis, mesh regeneration due to large changes in the geometry to accommodate the leaflet motion during the opening and closing phases, and requirement of very fine mesh density to resolve the flows accurately in regions of high shear flows such as near the moving leaflets, and in the gap width between the leaflet edges and valve housing as well as in the hinge region at the instant of valve closure. We have previously employed a two-dimensional fluid-structure interaction (FSI) simulation of mechanical valve flow dynamics using a Cartesian grid flow solver that incorporates local mesh refinement (LMR) to resolve the flow within the small leaflet-housing gap. We also incorporated a particle dynamic analysis towards detailed analysis of the fluid-induced stresses and the simulation of platelet activation based on the shear stress-time integral history of the particles in the computations [9].
Differences in the design parameters among the bi-leaflet valves include the geometry of the leaflets, the hinge location and design, material selection and thickness of the leaflets and the angle of traverse of the leaflet from the fully open to the fully closed position. In this study, we present the analysis to compare the fluid-induced stresses and the platelet activation parameter during the closing phase of two bi-leaflet valve models in order to demonstrate the significant differences in the results based on the differences in the design between the two models. Restricting this analysis to variations in the flow dynamics only to geometrical design variations, we chose the two valve models that have two different angles of traverses from the fully open to the fully closed position, and also incorporated the nominal dimensions and geometry of the leaflets in order to investigate the effect of local leaflet geometrical variations on the flow dynamics during valve closure. The results from the simulation indicate that the angle of traverse of the leaflet during valve closure is a major factor in the resulting flow dynamics and potential for platelet activation where as the fluid dynamic alterations due to local changes in geometry of the leaflets were found to be less significant.
COMPUTATIONAL SIMULATIONS
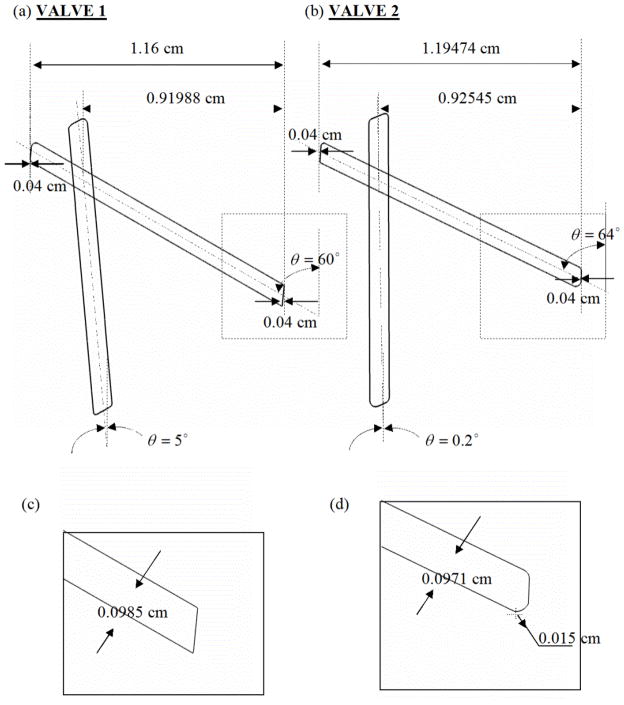
The governing equations employed for the fluid flow, the motion of the leaflets, and the computation of the platelet activation parameter are included in the Appendix. The nominal dimensions and the geometry of the two bi-leaflet valves used in the current simulations are shown in Fig. 1. The nominal dimensions for Valve-1 corresponded to a St. Jude Medical bi-leaflet valve that has a traverse angle of about 55° and the leaflet edges are flat (Fig. 1(c)). The dimensions for Valve-2 corresponded to that of a Medtronic bi-leaflet valve [9] with a traverse angle of about 64° and rounded leaflet edges (Fig. 1(d)). The two valves will be henceforth referred to as Valve-1 and Valve-2. Since this analysis was restricted to a 2D geometry, the hinge region was approximated to a pivot point about which the leaflet rotated from the fully open to the fully closed position in the analysis of the fluid dynamics during the closing phase of the cardiac cycle. The left boundary of the domain representing the b-datum gap is symmetric while the right boundary represents the valve housing. The leaflet edge at the symmetry side will henceforth be referred to as the left edge and the housing side will be referred to as the right edge. The leaflet-housing gap and the b-datum gap are specified to be 0.04 cm for both valves. The hinge locations, thickness and length of the leaflets are slightly but not significantly different between the two valves. The other major difference between the valves is the shape of the leaflet edge. The left edges of both leaflets are similar with slightly rounded edges. The region below the valve represents the ventricular side and the region above is the atrium with the valve in the mitral position employed in the simulation. The pressure on the atrial side boundary is fixed at 0 mmHg while the pressure on the ventricular side boundary is increased linearly from 0 mmHg (0 Pa ) to 120 mmHg (160 kPa ) over a time period of 60 ms at a constant pressure rise rate of 2000 mmHg / s (267 kPa / s ).
Figure 1.
Comparison of valve geometry for: (a) Valve-1 and (b) Valve-2; (c) and (d): The leaflet edge geometry of valve-1 is sharper than that of Valve-2 shown in (d). The angle made by the valve leaflets in fully open and closed positions is also indicated in the figure. The leaflet dimensions differ slightly but not significantly from each other.
The fluid is assumed to be incompressible, laminar, and Newtonian with a density of 1056 kg / m3 and viscosity of 0.0035 kgm−1s−1, which is representative of normal human blood properties at 37°C. At the symmetry boundary, the normal velocity component is set to zero and all other quantities are extrapolated assuming zero normal gradient. The valve housing is assumed to be a solid wall, and the standard no-slip condition is used. The leaflet properties are assumed to be that of pyrolytic carbon with density (ρl) of 2000 kg / m3 and the platelets are assumed to be point spheres of radius 2 micrometers (μm) with the density of blood.
RESULTS
Validation
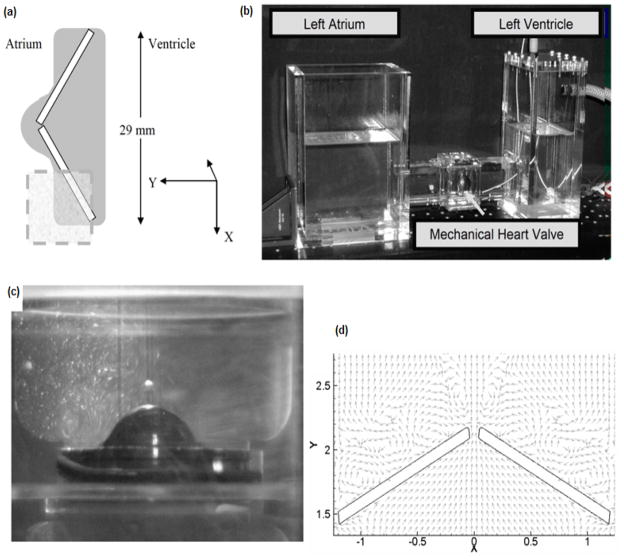
The computational results obtained for Valve-1 are compared with experimental data for the same valve to validate the bulk characteristics of the flow obtained from the calculations. The schematic of the experimental set-up and the region of interest explored experimentally and also the comparison of flow patterns in the region downstream of the leaflet at a particular time instant are shown in Figure 2. In this study, the valve is housed in an acrylic chamber with near valve dimensions comparable to what is observed for an implanted mitral valve. Figure 2(b) shows a photograph of the experimental setup. Valve closure was controlled via a pneumatic drive at 75bpm, with a pressure rise ( dP / dt ) of 2,000 mmHg / s. Ventricular pressure was monitored with a Millar catheter. A laser Doppler velocimetry (LDV) system (TSI, Inc. Shoreview, MN, USA) was manipulated to provide a light sheet along the centerline of the leaflet. Images of the near-field flow were acquired at 125 frames per second using a high speed camera. Three-component LDV was used to acquire velocity measurements near the leaflet- housing gap on the atrial side of the valve. However, because the in vitro experiments capture the 3D flow field generated by valve closure whereas the simulation predicts the 2D flow in the centerline plane, only a qualitative comparison is possible. The experimental conditions were consistent with those applied in the model. The leaflet angle was measured by analyzing the contrast levels of images collected from the valve’s proximal view. MATLAB™ and ImageJ™ (NIH) were used to determine the precise location of the walls and angle of the leaflets at a given time in the closing cycle. As seen in the Fig. 2(d) the computations are able to capture the recirculation zones seen in Fig. 2(c) very near the leaflet.
Figure 2.
(a) Schematic of experimental set-up. The rectangle marked out in the figure indicates the regions where the LDV measurements are made. (b) Photograph of experimental set-up. (c) Flow visualization with a light sheet illuminating the centerline of the valve indicating the recirculation regions near the leaflets during the valve closing phase. (d) Numerical simulation results show qualitatively similar re-circulation regions.
Leaflet Closure Characteristics
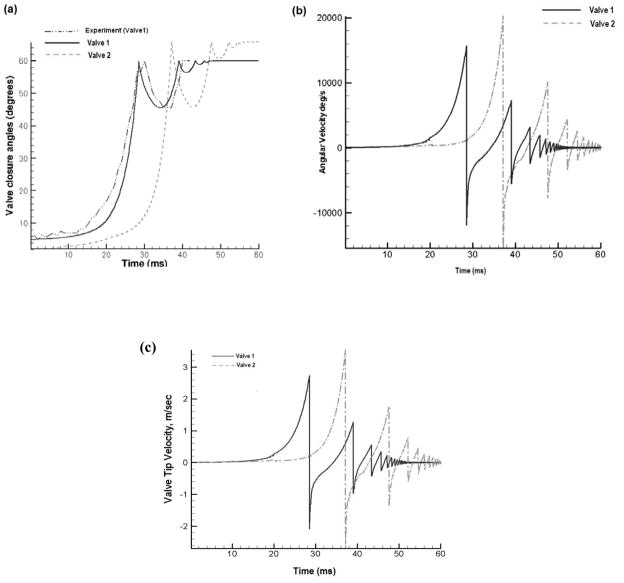
Figure 3 shows the closure characteristics of the leaflets for the two valve models. Figure 3(a) shows the orientation of the two leaflets over time. The leaflet of Valve-1 closes significantly faster (28 milliseconds (ms)) than that of Valve-2 (37 ms) because of its initial orientation and lower traverse angle. Also superposed in this figure are the experimental measurements of closure angle as a function of time for Valve-1. The resilience factor in Equation 4 (see appendix) for the simulation was adjusted until the computationally predicted rebound amplitude agreed with that of the experiment and the resulting magnitude of the resilience factor was determined to be 0.782. As stated before, we had assumed the resilience factor to be 0.5 in our previous simulations due to lack of experimental data for the same. We employed this new value for the resilience factor for both the valves for the rest of the simulation. The simulation is continued for 20 ms after the initial closure in the rebound stage. Once the leaflet impacts the valve housing in the initial closure stage, the angular velocity is reversed due to the leaflet rebound. Figure 3(b) shows the angular velocity of the two leaflets in the closure and rebound stages. As seen in the figure, the angular velocity of the leaflet at the instant of closure for Valve-1 is about 15000°/s while that of Valve-2 is 20000°/s. In the initial stages of valve closure, until the leaflet moves to about 10°from the vertical, the angular velocity is very low. After this point, there is an exponential rise in the leaflet rotation rate. As the leaflet swings shut, it obstructs the flow from the ventricle to the atrium causing a large pressure rise on the upstream side of the leaflet. This causes the forces acting on the leaflet to increase correspondingly, leading to exponential increase of angular velocity during the later stages of leaflet motion towards closure. Added to that is the effect of increased ventricular pressure and increased flow from the ventricle to the atrium.
Figure 3.
Leaflet closure characteristics of Valve-1 and Valve-2: (a) angle made by leaflet with vertical axis as a function of time; (b) leaflet angular velocity as a function of time; and (c) leaflet tip velocity as a function of time.
The higher angular velocity of the leaflet of Valve-2 is due to many factors. Initially, it is aligned at 0.2° with the vertical axis. Starting from this position, due to the alignment of the leaflet along the flow direction, the forces causing the leaflet to swing shut are very low and correspondingly, the angular velocity is very low. From this position, as seen in Fig. 3(a), the leaflet moves very little for the first 30 ms of the closure cycle. By the time the leaflet is aligned at 5° with the vertical axis after 30 ms, the ventricular pressure has already risen to about 60 mmHg. For the same leaflet alignment for Valve-1, the ventricular pressure is 0 mmHg. Hence the force experienced by the leaflets of Valve-2 in the exponential part of the closure curve is much higher than that experienced by those of Valve-1. Valve-1 is completely closed at 60°, while the leaflets of Valve-2 have to swing through another 4° to close completely. The longer the leaflet stays in the exponential part of the curve, the higher the angular velocity. All these factors contribute to the much higher angular velocity of the leaflets of Valve-2. Higher angular velocity at the instant of closure will cause a much more forceful impact against the valve housing and a stronger rebound. Figure 3(c) shows the tip velocity of the leaflets during the closing phase. Tip velocity is dependent on both the angular velocity of the leaflets and the distance of the leaflet tip from the hinge. As seen in the figure, the tip velocity of leaflets of Valve-1 at the instant of valve closure is around 2.8 meters/second (m/s) and that of Valve-2 is 3.6 m / s. The tip distance of Valve-2 leaflet from the hinge is slightly higher than that of Valve-1.
Fluid dynamics during valve closure
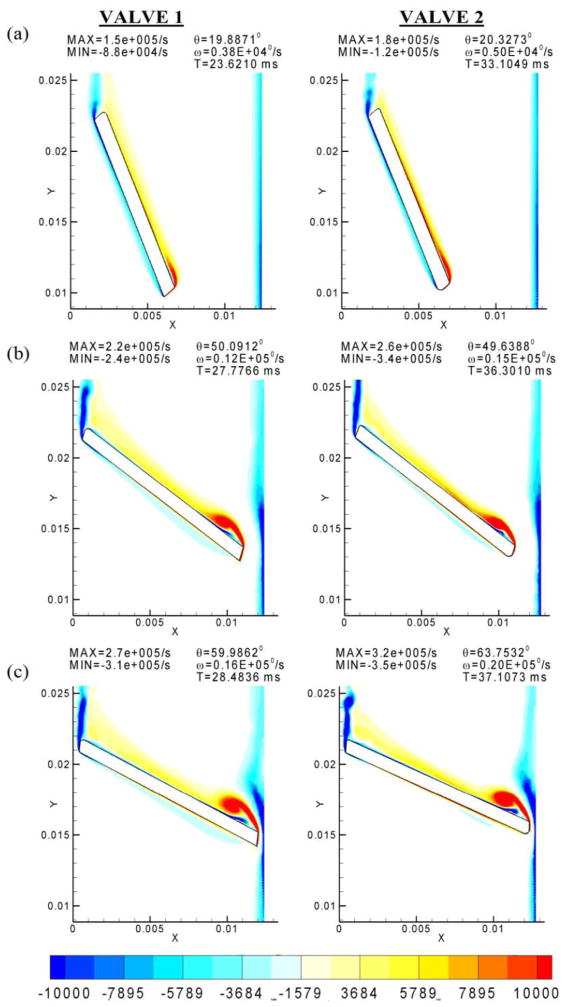
Figure 4 shows the comparison of vorticity contours at comparable angles of orientation of the leaflets with the vertical axis. As observed from the vorticity plots, the flow structure in both cases is very similar. Both valves exhibit similar patterns of flow separation from the leaflet edges and eventual orientation of flow towards the central axis. In the b-datum gap, both valves exhibit periodic shedding of vortices (Figure 4(c)) which occurs very close in time to the closure point. In the leaflet-housing gap, the shear layer from the edge of the leaflet pulls the wall boundary layer toward the valve symmetry line. The only difference in the flow as seen from the figure is in the intensity of the vortices. For the same angle of orientation of the leaflets, the intensity of vorticity is higher in the case of Valve-2. The angular velocity of the leaflets at the instant of closure is also higher for Valve-2. Because Valve-2 closes about 10 ms after Valve-1, the high shear region near the right edge of the leaflet can also be expected to have persisted for a longer period of time compared to Valve-1. The intensity of vortices can be directly related to the differences in angular velocity acquired by leaflets in the closure period.
Figure 4.
Comparison of the simulation results during the closure stage for Valve-1 and Valve-2. Note that the intensity of vortices is much lower for the first valve. The valve closure angle and the time during the leaflet motion for (a), (b), and (c) are indicated in the legend.
Platelet Activation
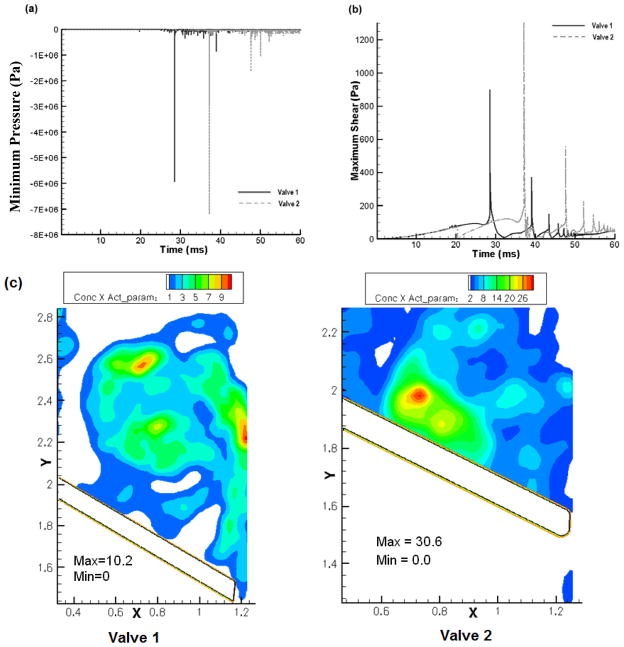
Figure 5(a) and 5(b) compare the minimum pressure and the maximum shear stress in the computational domain during the leaflet closure. It can be noted that the magnitudes of shear stress and pressure for Valve-2 are higher than that for Valve-1. Figure 5(c) compares the product of the platelet concentration and the computed platelet activation parameter at the instant of valve closure. In this plot, regions with bright red represents higher potential for platelets to be activated and dark blue represents minimum potential for activation. It can be observed that more bright red regions are seen with Valve-2 indicating a larger potential for platelet activation with this valve compared to that for Valve-1.
Figure 5.
Comparison of: (a) the minimum pressure; and (b) the maximum shear stress in the leaflet-housing gap region for the two valves. (c) Comparison of the computed product of platelet activation parameter and concentration at the instant of closure for the two valves. In this plot, regions with bright red indicates higher potential for platelets to be activated and dark blue represents minimal potential for the same. Larger regions of bright red for Valve-2 indicate higher potential for platelet activation compared to that for Valve-1.
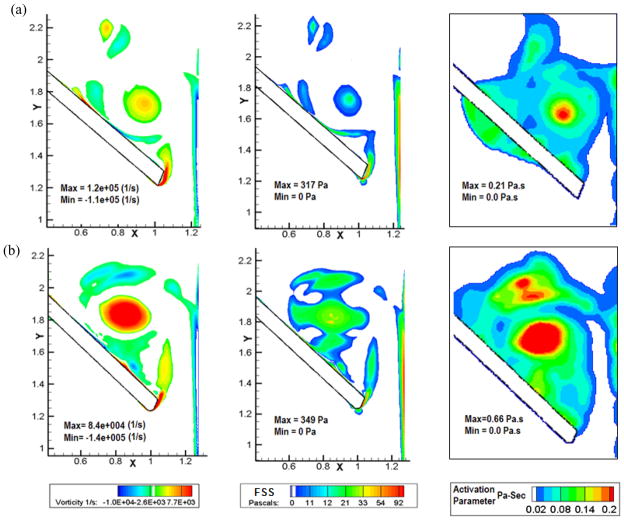
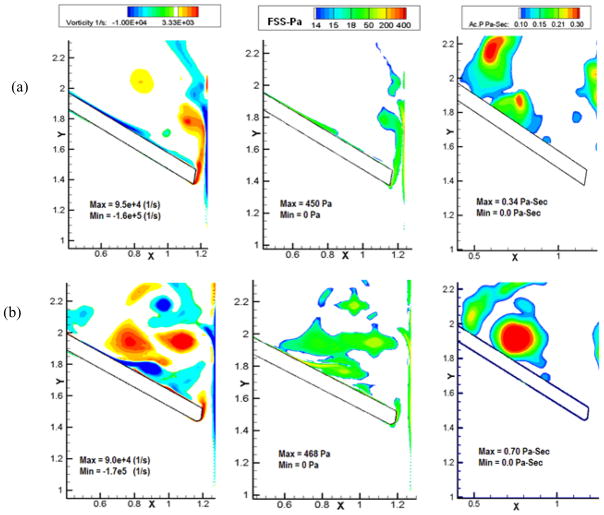
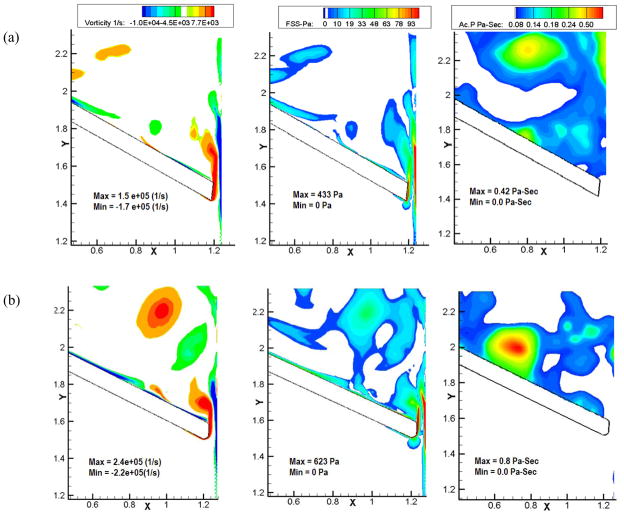
Figures 6, 7 and 8 show the vorticity contours, shear stress and activation parameter (Pascal-seconds (Pa-s)) at 6 ms, 12 ms and 18 ms after the instant of leaflet closure comparing Valve-1 and Valve-2 respectively in each figure. Bright red regions in the platelet activation plots for various times after the initial impact represent higher potential for platelets to be activated. Both valves exhibit the highly dynamic region at the right tip of the leaflets where the shear layer from the leaflet edge interacts with the boundary layer separating from the housing. A comparison of the vorticity contours shows that the vorticity magnitude is higher in case of Valve-2 (regions with bright red in the vorticity plots). In the case of Valve-1, the vortices diffuse quickly and are almost cleared out by the end of 18 ms. For Valve-2, the vortices are still relatively strong at this time and remain trapped in the vicinity of the leaflets. Correspondingly, the shear stress is also higher for a longer period of time for Valve-2. The higher vorticity magnitude shown by Valve-2 at the instant of closure also contributes to its persistence for a longer time and consecutive higher shear stress and activation parameter values.
Figure 6.
Plots of vorticity contours (Column 1), shear stress (Column 2), and the platelet activation parameter (Column 3) of (a) Valve-1 and (b) Valve-2 at 6 ms after the instant of valve closure. In the activation parameter plots, regions with bright red indicates higher potential for platelets to be activated and dark blue represents minimal potential for the same. Larger regions of bright red for Valve-2 indicate higher potential for platelet activation compared to that for Valve-1 during the initial impact and rebound phases of valve closure.
Figure 7.
Plots of vorticity contours (Column 1), shear stress (Column 2), and the platelet activation parameter (Column 3) of (a) Valve-1 and (b) Valve-2 at 12 ms after the instant of valve closure. In the activation parameter plots, regions with bright red indicates higher potential for platelets to be activated and dark blue represents minimal potential for the same. Larger regions of bright red for Valve-2 indicate higher potential for platelet activation compared to that for Valve-1 during the initial impact and rebound phases of valve closure.
Figure 8.
Plots of vorticity contours (Column 1), shear stress (Column 2), and the platelet activation parameter (Column 3) of (a) Valve-1 and (b) Valve-2 at 18 ms after the instant of valve closure. In the activation parameter plots, regions with bright red indicates higher potential for platelets to be activated and dark blue represents minimal potential for the same. Larger regions of bright red for Valve-2 indicate higher potential for platelet activation compared to that for Valve-1 during the initial impact and rebound phases of valve closure.
CONCLUSIONS AND DISCUSSION
Two models of bi-leaflet mechanical heart valves are compared in terms of their effectiveness against simulated platelet activation and thrombus formation. Valve-2 has a longer closure time and higher magnitudes of closure velocity and consequently higher vorticity strength and shear stress compared to that for Valve-1. Global flow patterns are found to be qualitatively similar for both the valves. However, the closure time, angular velocity and generated shear stresses (local flow characteristics) are quite different. This indicates that modest changes in valve design can result in unforeseen significant effects on blood cell damage and platelet trauma. The most critical parameter that affects the valve closure and subsequent shear stresses and the simulated platelet activation in the models under consideration is the initial and final orientation of the leaflets. Our conclusion that the local fluid dynamics in the leaflet edge- valve housing gap is predominantly affected by the leaflet angular velocity at the instant of valve closure (affected by the traverse angle of the leaflet) and to a lesser extent by the local leaflet tip geometry is supported by our earlier simulations [21], where changes in local geometry was not shown to affect the fluid dynamics in that region significantly. The rebound characteristics of the leaflets after the initial impact of the leaflet with the valve housing also introduces additional increased velocity magnitudes and shear stresses and the rebound is dependent upon the resilience factor based on the material of the leaflet and the valve housing. Even though data is not available on the experimental determination of the resilience factor between the pyrolytic carbon leaflets and the valve housing, we have used the same magnitude to compare the data between the two valves. Computational simulations can potentially help in analyzing the effect of the various design parameters before prototypes of valve designs are developed.
In this simulation, we have assumed symmetry at the center gap between the leaflets and hence simulated the closing of only one leaflet. In the bileaflet valves, asynchronous closing of the leaflets may be present due to slight variations in dimensions and material properties as well as due to the interaction between the leaflets and the valve housing in the hinge region for the two leaflets. However, these variations cannot be realistically incorporated in the governing equations of motion employed in the simulation and hence use of two leaflets without the symmetry assumption should yield similar results to those in the present study. However, we do not anticipate noticeable differences in the vortex shedding behavior of flow in the gap between the two leaflets even in the presence of asynchronous closing of the leaflets.
There are several limitations in the present simulations that need to be addressed. Previous studies [22, 8] have shown that while 2D flow analysis is able to capture the valve closure dynamics qualitatively, quantitative comparison will require 3D models. With regard to potential sites of platelet activation, a limitation of the 2D model is that hinge geometry cannot be incorporated in the flow simulation. The design of the hinge geometry and the interaction between the leaflets and the housing in this region will also affect the leaflet closure dynamics and was not considered in the present simulation. Platelet activation and thrombus formation is reported to occur due to the leakage flow in the hinge region and previous reports have concentrated on this aspect [17, 23, 24, and 25]. The dimension of the hinge region is two orders of magnitude lower than the valve dimension and will need to be considered in the computational analysis. We have performed a detailed 2D fluid dynamic analysis in the valve hinge region and have demonstrated that comparable potential for platelet activation exists in that region during the instant of valve closure as well [19].
The long-term goals of this work are to develop complete 3D simulations. However, meaningful 3D simulations, i.e. those that will capture the details of the leakage flow, require very dense meshes and will require large-scale parallel computing as well as additional improvements in local mesh refinement to obtain results with reasonable computational effort. Work is currently underway to accomplish this. Even with 2D simulations, the closure time shows a close match between experiment and simulation and hence important information is being conveyed in the manuscript with 2D simulation results. The 2D simulation presented here has yielded valuable information on the effect of design parameters such as the leaflet traverse angle on the flow dynamics in the clearance region and the potential for platelet activation.
The present platelet activation model is purely based on the shear stress-time integral experienced by the platelets in flowing through leaflet-housing gap. Previous studies have suggested a specific shear stress-time relationship for platelet activation in arterial flows [26, 27]. Tambasco et al., [13] suggested a minimum shear stress beyond which the platelets will be activated in the shear stress-time integral employed in Eq. 5 (See Appendix). However, the process of platelet activation, aggregation, and thrombus initiation particularly in the presence of foreign surfaces such as a mechanical valve leaflet is highly complex. There are many other factors like agonist synthesis and release by activated platelets and concentration, platelet-phospholipid-dependent thrombin generation, and thrombin inhibition by heparin that need to be incorporated to build a comprehensive activation model [28, 29]. Inclusion of biochemical effects on platelets accounting for all these factors will improve the prediction of thrombus formation. In this study, a simple activation model based on shear stress exposure and time show that significant differences in platelet activation can be expected in mechanical valves based solely on a few simple design changes.
The current analysis can easily be extended to other valve designs such as tilting disc valve or valves with floating leaflets to estimate their performance with regard to potential for platelet activation.
Acknowledgments
Partial support of this work from a grant from the NIH (NHLBIHL-071814) and the Iowa Department of Economic Development are gratefully acknowledged.
APPENDIX NUMERICAL METHOD
Flow Solver
The computational method is explained in detail in our previous study [9] and will not be elaborated here. To summarize, the two-dimensional Navier-Stokes equations in the non-dimensional form (Equations 1 and 2) are solved by an Eulerian Levelset based Sharp Interface Cartesian grid method [30, 31, 32]
| (1) |
| (2) |
In the above equations, Re = ρ U D / μ is the Reynolds number. ρ, U, D, μ are the fluid density, typical fluid velocity and valve dimension and fluid viscosity respectively.
All interfaces are represented by levelsets [33, 34] on a Cartesian mesh. This method allows a natural representation and computation of the movement of complex objects on a fixed mesh, with the interface velocity being derived from the physics of the problem under consideration. The sharp interface method allows boundary conditions to be applied in a sharp fashion at the interfaces without any smearing of the interface or sacrificing solution accuracy. Typically, a no-slip condition is applied for the velocity and a Neumann condition is applied for the pressure at the interfaces.
In the present problem, the leaflet (interface) rotation velocity in the closure phase is calculated from the fluid stresses (pressure and shear) acting on it employing a fluid-structure interaction algorithm. The leaflet rotation during closure can be described by the relationship [8, 34]
| (3) |
In the above equation, θ(t) is the opening angle, indicating the leaflet position at any instant t; Io is the moment of inertia of the leaflet about the pivot, and M is the total momentum applied on the leaflet from the external forces (pressure, shear, buoyancy) inducing the leaflet motion.
The leaflet impacts against the valve seating lip at the instant of valve closure and bounces back from the housing. The governing equation of leaflet dynamics during impact can be expressed as follows [8]:
| (4) |
where σ is the coefficient of resilience that depends upon the material of the leaflet and the valve housing. ω1 and ω2 are the angular velocities before and after impact, respectively. No published data are available on the experimental determination of the resilience factor for the impact of leaflets against the seat stop for the pyrolytic carbon material. In our previous simulations, we assumed the coefficient of resilience σ as 0.5 [8, 9]. However, in the present analysis, the amplitude of the leaflet edge rebound data immediately after impact from experimental studies was available for one of the valves and hence we adjusted the magnitude of the resilience factor such that the computer predicted rebound magnitude agreed with the experimental data as described in the results section.
When dealing with problems of disparate length scales encountered in many applications, it is necessary to resolve the physically important length scales adequately to ensure accuracy of the solution. A local mesh refinement algorithm [35, 36, and 37] is incorporated in the flow solver to allow efficient, fast and accurate flow computations. The mesh is refined or coarsened based on solution gradients and curvature without any need for user intervention.
Platelet Activation Model
Platelets are modeled as point particles by a Lagrangian particle tracking algorithm [38] with one-way coupling. A dilute particulate flow is assumed and particle-particle interactions are neglected. The primary cause of platelet activation is exposure to high shear stress over an extended period of time. Therefore, a measure for level of platelet activation due to shear-stresses can be defined as [39]:
| (5) |
The activation parameter is calculated by integrating the fluid shear stresses acting on each platelet over the entire time period T for which it remains in the computational domain. Previous studies have emphasized the cumulative effect of the magnitude of shear stress and the time of exposure as an important factor in platelet activation and we have employed a simple relationship [40] given in Eq.5 to simulate platelet activation with mechanical valve closure.
References
- 1.Chandran KB. Heart Valve Prostheses. John Wiley and Sons; New York: 2006. [Google Scholar]
- 2.Yoganathan AP, Chandran KB, Sotiropoulos F. Flow in prosthetic heart valves: state-of-the-art and future directions. Ann Biomed Eng. 2005;33:1689–1694. doi: 10.1007/s10439-005-8759-z. [DOI] [PubMed] [Google Scholar]
- 3.Dumont K, Vierendeels J, Kaminsky R, van Nooten G, Verdonck P, Bluestein D. Comparison of the Hemodynamic and Thrombogenic Performance of Two Bileaflet Mechanical Heart Valves Using a CFD/FSI Model. Journal of Biomechanical Engineering. 2007;129:558–566. doi: 10.1115/1.2746378. [DOI] [PubMed] [Google Scholar]
- 4.Ge L, Leo HL, Sotiropoulos F, Yoganathan AP. Flow in a mechanical bileaflet heart valve at laminar and near-peak systole flow rates: CFD simulations and experiments. J Biomech Eng. 2005;127:782–797. doi: 10.1115/1.1993665. [DOI] [PubMed] [Google Scholar]
- 5.Shi Y, Zhao Y, Yeo TJ, Hwang NH. Numerical simulation of opening process in a bileaflet mechanical heart valve under pulsatile flow condition. J Heart Valve Dis. 2003;12:245–255. [PubMed] [Google Scholar]
- 6.Shipkowitz T, Ambrus J, Kurk J, Wickramasinghe K. Evaluation technique for bileaflet mechanical valves. J Heart Valve Dis. 2002;11:275–282. [PubMed] [Google Scholar]
- 7.King MJ, David T, Fisher J. Three-dimensional study of the effect of two leaflet opening angles on the time-dependent flow through a bileaflet mechanical heart valve. Med Eng Phys. 1997;19:235–241. doi: 10.1016/s1350-4533(96)00066-5. [DOI] [PubMed] [Google Scholar]
- 8.Cheng R, Lai YG, Chandran KB. Three-dimensional fluid-structure interaction simulation of bileaflet mechanical heart valve flow dynamics. Annals of Biomedical Engineering. 2004;32:1469–1481. doi: 10.1114/b:abme.0000049032.51742.10. [DOI] [PMC free article] [PubMed] [Google Scholar]
- 9.Krishnan S, Udaykumar HS, Marshall JS, Chandran KB. Two-dimensional dynamic simulation of platelet activation during mechanical heart valve closure. Ann Biomed Eng. 2006;34:1519–1534. doi: 10.1007/s10439-006-9194-5. [DOI] [PubMed] [Google Scholar]
- 10.Chandran KB, Lee CS, Chen LD. Pressure field in the vicinity of mechanical valve occluders at the instant of valve closure: correlation with cavitation initiation. J Heart Valve Dis. 1994;3(Suppl 1):S65–75. discussion S75–66. [PubMed] [Google Scholar]
- 11.Hellums JD. 1993 Whitaker Lecture: biorheology in thrombosis research. Ann Biomed Eng. 1994;22:445–455. doi: 10.1007/BF02367081. [DOI] [PubMed] [Google Scholar]
- 12.Einav S, Bluestein D. Dynamics of blood flow and platelet transport in pathological vessels. Ann N Y Acad Sci. 2004;1015:351–366. doi: 10.1196/annals.1302.031. [DOI] [PubMed] [Google Scholar]
- 13.Tambasco M, Steinman DA. Path-dependent hemodynamics of the stenosed carotid bifurcation. Ann Biomed Eng. 2003;31:1054–1065. doi: 10.1114/1.1603257. [DOI] [PubMed] [Google Scholar]
- 14.Kini V, Bachmann C, Fontaine A, Deutsch S, Tarbell JM. Flow visualization in mechanical heart valves: occluder rebound and cavitation potential. Ann Biomed Eng. 2000;28:431–441. doi: 10.1114/1.281. [DOI] [PubMed] [Google Scholar]
- 15.Kini V, Bachmann C, Fontaine A, Deutsch S, Tarbell JM. Integrating particle image velocimetry and laser Doppler velocimetry measurements of the regurgitant flow field past mechanical heart valves. Artif Organs. 2001;25:136–145. doi: 10.1046/j.1525-1594.2001.025002136.x. [DOI] [PubMed] [Google Scholar]
- 16.Manning KB, Kini V, Fontaine AA, Deutsch S, Tarbell JM. Regurgitant Flow Field Characteristics of the St. Jude Bileaflet Mechanical Heart Valve under Physiologic Pulsatile Flow Using Particle Image Velocimetry. Artif Organs. 2003;27:840–846. doi: 10.1046/j.1525-1594.2003.07194.x. [DOI] [PubMed] [Google Scholar]
- 17.Ellis JT, Travis BR, Yoganathan AP. An in vitro study of the hinge and near-field forward flow dynamics of the St. jude Medical (R) Regent (TM) bileaflet mechanical heart valve. Annals of Biomedical Engineering. 2000;28:524–532. doi: 10.1114/1.297. [DOI] [PubMed] [Google Scholar]
- 18.Ellis JT, Yoganathan AP. A comparison of the hinge and near-hinge flow fields of the St Jude medical hemodynamic plus and regent bileaflet mechanical heart valves. J Thorac Cardiovasc Surg. 2000;119:83–93. doi: 10.1016/s0022-5223(00)70221-2. [DOI] [PubMed] [Google Scholar]
- 19.Govindarajan V, Udaykumar HS, Chandran KB. Two-Dimensional Simulation of Flow and Platelet Dynamics in the Hinge Region of a Mechanical Heart Valve. J Biomech Eng. 2009;131 doi: 10.1115/1.3005158. 031002(1–12) [DOI] [PMC free article] [PubMed] [Google Scholar]
- 20.King MJ, Corden J, David T, Fisher J. A Three-Dimensional, Time-Dependent Analysis of Flow Through a Bileaflet Mechanical Heart Valve: Comparison of Experimental and Numerical Results. Journal of Biomechanics. 1996;29:609–618. doi: 10.1016/0021-9290(95)00107-7. [DOI] [PubMed] [Google Scholar]
- 21.Lai YG, Chandran KB, Lemmon J. A numerical simulation of mechanical heart valve closure fluid dynamics. J Biomech. 2002;35:881–892. doi: 10.1016/s0021-9290(02)00056-8. [DOI] [PubMed] [Google Scholar]
- 22.Cheng R, Lai YG, Chandran KB. Two-dimensional fluid-structure interaction simulation of bileaflet mechanical heart valve flow dynamics. Journal of Heart Valve Disease. 2003;12:772–780. [PubMed] [Google Scholar]
- 23.Gross JM, Shu MCS, Dai FF, Ellis J, Yoganathan AP. Microstructural flow analysis within a bileaflet mechanical heart valve hinge. Journal of Heart Valve Disease. 1996;5:581–590. [PubMed] [Google Scholar]
- 24.Leo HL, He ZM, Ellis JT, Yoganathan AP. Microflow fields in the hinge region of the CarboMedics bileaflet mechanical heart valve design. Journal of Thoracic and Cardiovascular Surgery. 2002;124:561–574. doi: 10.1067/mtc.2002.125206. [DOI] [PubMed] [Google Scholar]
- 25.Simon HA, Leo HL, Carberry J, Yoganathan AP. Comparison of the hinge flow fields of two bileaflet mechanical heart valves under aortic and mitral conditions. Annals of Biomedical Engineering. 2004;32:1607–1617. doi: 10.1007/s10439-004-7814-5. [DOI] [PubMed] [Google Scholar]
- 26.Hellums JD, Peterson DM, Stathopoulos NA, Moake JL, Giorgio TD. Studies of mechanisms of shear-induced platelet activation. Cerebral Ischemia and Hemorheology. 1987:80–89. [Google Scholar]
- 27.Jesty J, Yin W, Perrotta P, Bluestein D. Platelet activation in a circulating flow loop: combined effects of shear stress and exposure time. Platelets. 2003;14:143–149. doi: 10.1080/0953710031000092839. [DOI] [PubMed] [Google Scholar]
- 28.Sorensen EN, Burgreen GW, Wagner WR, Antaki JF. Computational simulation of platelet deposition and activation: I. Model development and properties. Annals of Biomedical Engineering. 1999;27:436–448. doi: 10.1114/1.200. [DOI] [PubMed] [Google Scholar]
- 29.Sorensen EN, Burgreen GW, Wagner WR, Antaki JF. Computational simulation of platelet deposition and activation: II. Results for Poiseuille flow over collagen. Annals of Biomedical Engineering. 1999;27:449–458. doi: 10.1114/1.201. [DOI] [PubMed] [Google Scholar]
- 30.Marella S, Krishnan S, Liu H, Udaykumar HS. Sharp interface Cartesian grid method I: An easily implemented technique for 3D moving boundary computations. Journal of Computational Physics. 2005;210:1–31. [Google Scholar]
- 31.Udaykumar HS, Mittal R, Rampunggoon P, Khanna A. A sharp interface cartesian grid method for simulating flows with complex moving boundaries. Journal of Computational Physics. 2001;174:345–380. [Google Scholar]
- 32.Yang Y, Udaykumar HS. Sharp interface Cartesian grid method III: Solidification of pure materials and binary solutions. Journal of Computational Physics. 2005;210:55–74. [Google Scholar]
- 33.Sethian JA. Tracking interfaces with level sets. American Scientist. 1997;85:254–263. [Google Scholar]
- 34.Sethian JA. Fast marching methods. Siam Review. 1999;41:199–235. [Google Scholar]
- 35.Greaves D. A quadtree adaptive method for simulating fluid flows with moving interfaces. Journal of Computational Physics. 2004;194:35–56. [Google Scholar]
- 36.Greaves D. Simulation of interface and free surface flows in a viscous fluid using adapting quadtree grids. International Journal for Numerical Methods in Fluids. 2004;44:1093–1117. [Google Scholar]
- 37.Yiu KFC, Greaves DM, Cruz S, Saalehi A, Borthwick AGL. Quadtree grid generation: Information handling, boundary fitting and CFD applications. Computers & Fluids. 1996;25:759–769. [Google Scholar]
- 38.Chen H, Marshall JS. A Lagrangian vorticity method for two-phase particulate flows with two-way phase coupling. Journal of Computational Physics. 1999;148:169–198. [Google Scholar]
- 39.Bluestein D, Yin W, Affeld K, Jesty J. Flow-induced platelet activation in mechanical heart valves. Journal of Heart Valve Disease. 2004;13:501–508. [PubMed] [Google Scholar]
- 40.Bluestein D, Niu L, Schoephoerster RT, Dewanjeet MK. Fluid Mechanics of Arterial Stenosis: Relationship to the development of Mural Thrombus. Annals of Biomedical Engineering. 1997;25:344–356. doi: 10.1007/BF02648048. [DOI] [PubMed] [Google Scholar]


