Abstract
One goal in drug design is to decrease clearance due to metabolism. It has been suggested that a compound’s metabolic stability can be increased by incorporation of a sp2 nitrogen into an aromatic ring. Nitrogen incorporation is hypothesized to increase metabolic stability by coordination of nitrogen to the heme iron (termed type II binding). However, questions regarding binding affinity, metabolic stability, and how metabolism of type II binders occurs remain unanswered. Herein, we use pyridinyl quinoline-4-carboxamide analogs to answer these questions. We show that type II binding can have a profound influence on binding affinity for CYP3A4, and the difference in binding affinity can be as high as 1,200 fold. We also find that type II binding compounds can be extensively metabolized, which is not consistent with the dead-end complex kinetic model assumed for type II binders. Two alternate kinetic mechanisms are presented to explain the results. The first involves a rapid equilibrium between the type II bound substrate and a metabolically oriented binding mode. The second involves direct reduction of the nitrogen-coordinated heme followed by oxygen binding.
INTRODUCTION
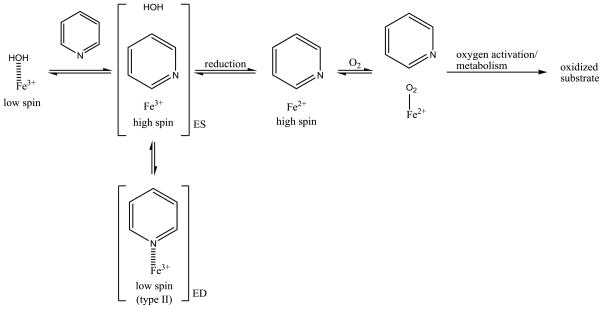
Cytochrome P450s (P450s) are heme-containing monoxygenases that are responsible for a plethora of oxidation reactions important in plants, bacteria, and mammals [1]. In mammals, P450s carry out the biotransformation of several endogenous compounds in the body such as bile acids, biogenic amines, fatty acids and steroids. This family of enzymes also plays a role in the metabolism of drugs, and more importantly can be a major factor in failures in drug development. Metabolic stability is an important factor in determining the amount of a potential drug that will reach the site of action. It has been shown that metabolic stability can be increased by the incorporation of a sp2 nitrogen into an aromatic ring [2,3]. Two potential (nonexclusive) mechanisms for nitrogen containing aromatic systems to slow metabolism are by; 1) decreasing electron density on the aromatic carbons, reducing metabolic rate by the electrophilic active-oxygen species, and 2) nitrogen coordination with the heme-iron to form what is known as a type II binder (Figure 1). The electronic mechanism will play a role anytime aromatic hydroxylation is the major pathway for metabolism, and both can contribute to altering metabolic rates.
Figure 1.
Kinetics for Metabolism of type II binding compounds by cytochrome P450.
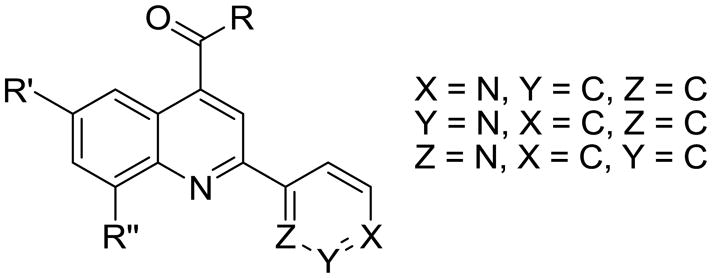
With respect to type II binding, it is hypothesized that coordination to the iron slows down the catalytic cycle by trapping the ferric iron in low spin state forming a dead-end complex which cannot be reduced by P450 reductase to initiate the catalytic cycle (Figure 1) [2,3]. Three questions remain unanswered with respect to type II binding: 1) How much is the affinity increased by nitrogen coordination to the heme iron? 2) Does type II iron coordination slow or prevent metabolism? 3) How does a compound that coordinates to the heme-iron get metabolized? Our recent studies indicate that nitrogen coordination to the heme iron of 2C9 leads to a very strong interaction, yielding up to a 4,200 fold increase in binding affinity [4–6]. Given this strong affinity, it is difficult to envision how a type II binding substrate can be metabolized significantly, since the fraction of high-spin 5-coordinate heme that could be reduced would be very small. In an attempt to answer these questions we use experimental and computational methods to study pyridinyl quinoline-4-carboxamide analogs (Figure 2) which have been designed to change from type II, nitrogen coordination, to type I binding by altering the position of the nitrogen in the aromatic ring. Measurements of binding affinity, metabolic stability, and regioselectivity of metabolism in CYP3A4 are used to explore the affect of type II binding on reaction rates. The substrates are designed to modulate the amount of type II binding without altering other properties, such as solvation. The ortho substituted compound (Z=N, X=C, Y=C in Figure 2) should not be able to coordinate to the heme iron since coordination is precluded by steric interactions with the heme [5]. We chose to study CYP3A4 instead of CYP2C9 because CYP3A4 gives better type II UV/vis difference spectra [7,8]. This enzyme also allows us to see if the increases in binding affinity observed for 2C9 can be extrapolated to other P450 enzymes. Furthermore, CYP3A4 is a major drug P450 enzyme that metabolizes more than 50% of clinically used drugs.
Figure 2.
Quiniline-4-carboxaide analog.
METHODS
Ki MEASUREMENTS
CYP3A4 Supersomes® were obtained from BD Biosciences (Gentest, Woburn, MA USA) and contained human CYP3A4 at a concentration of 1 μM, with P450 reductase (3200 nmole/min × mg protein) and cytochrome b5 (1300 pmol per mg protein). Testosterone was used as the CYP3A4 marker substrate and run at four concentrations (7.81, 15.6, 31.2, and 125 μM) against five different inhibitor concentrations. Incubations (200 μL) consisted of 0.5 pmol of 3A4 enzyme in 100 mM potassium phosphate buffer at pH 7.4 containing 1 mM MgCl2. The reaction was preincubated for 5 minutes at 37 °C before initiation of the reaction with a final concentration of 1 mM NADPH. Reactions were quenched after ten minutes by addition of 100 μL acetonitrile containing 0.5 μM tolbutamide as the internal standard. The enzyme was removed by centrifugation and 6β-OH testosterone was analyzed by LC-MS/MS as described in the following section.
METABOLIC STABILITY
CYP3A4 Supersomes® were diluted into 100 mM potassium phosphate buffer (7.4) with 3 mM MgCl2 to yield a final concentration of 5.6 pmol of CYP3A4 protein per 100μL of incubation mix. Compounds in DMSO were added to yield the desired final concentrations of 1 and 25 μM with total DMSO in the incubation at 0.5%. After addition of compound, incubation mixes were mixed by gentle pipeting before being split into 90μL aliquots for triplicate measurements for each time point. Samples were pre-incubated at 37°C for 5 minutes before initiation of the reaction by the addition of 10 μL of 10 mM reduced β-NADPH dissolved in buffer. Reactions were initiated in a staggered format so all incubations could be quenched simultaneously by the addition of 100 μL of acetonitrile containing 0.5 μM tolbutamide to yield the desired time points. The enzyme was removed by centrifugation and parent compound was analyzed using LC-MS/MS (Applied Biosystem 4000 Q-Trap). HPLC separation was achieved using a Gemini C18 2.0 × 30 mm 5 μm column (Phenomenex, Torrance, CA). Gradient elution (flow rate = 0.5 mL/min) was carried out using a mobile phase system consisting of (A) 5 mM ammonium formate with 0.1% formic acid and (B) acetonitrile with 0.1% formic acid. Gradient conditions were as follows: 5% B for 0.5 minutes; increase of B from 5% to 100% B over the next 0.5 minutes; hold for 1 minute; decrease of B from 100% to 5% over 0.5 minutes; hold at 5% for 1.0 minute. Generic MS/MS parameters included curtain gas (10 arbitrary units), CAD gas (medium), ionspray voltage (4500 V), source temperature (450 °C) and ion source gas 1 and gas 2 (40 arbitrary units, each). Interface heaters were kept on for all analytes.
DIFFERENCE SPECTROSCOPY FOR BINDING OF SUBSTRATES FOR BOTH NON-REDUCED AND REDUCED CYP3A4
Difference spectra were collected using a double-beam Olis upgraded Aminco DW-2000 spectrophotometer (Olis, Inc., Bogart, GA). The wavelength range was 350 to 500 nm. Both sample and reference cuvettes contained 470 nM purified CYP3A4 in 100 mM KPi buffer with 20% glycerol, pH 7.4 [7,8]. To obtain difference spectra, a baseline was first recorded for both sample and reference cuvettes containing CYP3A4 enzyme and buffer equilibrated at 30°C, followed by substrate titration into the sample cuvette with the same volume of solvent added to the reference cuvette. Substrate concentrations were between 0.343 and 110 μM for the non-reduced form and 6.87 to 164.8 μM for reduced CYP3A4. Dithionite was added prior to titration for the reduced binding experiments. Substrate binding curves were fit by nonlinear regression with GraphPad Prism4 using equation ΔA = (Bmax × [S])/(Ks + [S]), where A is the absorbance difference, Bmax is the maximum absorbance difference, S is the substrate concentration. The types of substrate-induced binding spectra with P450 heme were determined by the positions of wavelengths for peaks (λmax) and minima (λmin) on the spectra [9]. The values for compounds 10 and 16 were calculated correcting for the effect of enzyme concentration of substrate concentration using the equation of Henderson [10], and Bmax estimates from the fits to the binding curves as described above. For reduced heme iron difference spectra, a few flakes of dithionite were added to the enzyme mixture to reduce the ferric iron to ferrous before the spectra were measured.
REGIOSELECTIVITY INCUBATIONS
Compounds 26, 7, 8, 9 and 13 were used as CYP3A4 substrates. CYP3A4 Baculosomes 5 pmole were added to the incubation mixtures containing a final concentration of 50 μM substrate in 100 mM potassium phosphate buffer at pH 7.4 followed by pre-incubation for 5 minutes at 37°C. NADPH was added to a final concentration of 10 mM to initiate the reaction. The final volume of all incubations was 500 μL. Reactions were quenched after one hour by adding 200 μL of 6% acetic acid in acetonitrile containing an internal standard (0.05 mM phenacetin). The enzyme was removed by centrifugation and metabolites were analyzed using LC/MS (Thermo Quest HPLC series coupled with Thermo Finnigan LCQ Advantage). The HPLC system used reverse phase chromatography beginning with 95% of mobile phase A: water and 5% of mobile phase B: acetonitrile with a linear gradient to 95% of acetonitrile over 20 minute. The m/z monitored for compound 26 were as following: internal standard: MS – 180; substrate: MS/MS – 375.3, 205.3; metabolites: MS/MS – 391.3. The m/z monitored for compound 7 were as following: internal standard: MS – m/z 180; substrate: MS/MS – 376.3, 233.1, 205.3; metabolites: MS/MS – 392.3; MS - 408. The m/z monitored for compound 13 were as following: internal standard: MS – m/z 180; substrate: MS/MS – 326.4; metabolites: MS/MS – 342.4.
COMPUTATIONAL METHODS
Density functional calculations were performed using Gaussian 03. The TPSS [11], OPBE [12] or B3LYP functionals were used with the cc-pVDZ basis set with effective core potential on iron [13], the aug-cc-pVDZ on sulfur and nitrogen with diffuse d functions removed, and the cc-VDZ basis set on carbon and hydrogen. The basis set, energies of optimized structures and optimized geometries are available as supplemental material. The heme model was the abbreviated heme with an S-H fifth ligand used by Shaik and coworkers [14–16].
RESULTS
The affinity for the active site of CYP3A4 for each compound listed in Table 1 was measured by their ability to inhibit CYP3A4 dependent metabolism of testosterone. The compounds were synthesized as previously reported [5]. All of the compounds studied are competitive inhibitors versus testosterone and their Ki values are shown in Table 1. Within each series as shown in Table 1, the para nitrogen containing compounds bind more tightly than meta or ortho nitrogen containing compounds (a series is illustrated in Figure 2 where R, R′ and R″ remain constant and only the position of the nitrogen is altered). The binding affinity can be as much as a 1,200 fold different, as illustrated by the tightest series of ortho, meta, para analogs compounds 7, 8 and 9. The smallest difference is still a substantial 6-fold increase in affinity for the para-linkage over the ortho-linkage (series 9, Table 2). In most cases within a series, the compound with a nitrogen in the meta position bound more tightly than when nitrogen was in the ortho position, with the sole exception being series 9, where the values are within 1 standard deviation of each other. When comparing affinities for the para-linked compounds in each series, it is obvious that para compounds in series 1 and 2 with aliphatic rings bind less tightly than other compounds which all have aromatic rings. In general, the series with a naphthalene moiety bind more tightly than series with a single aromatic ring at the R position (Figure 2). Finally, too much steric bulk in the R′ and R′ position appears to decrease affinity.
Table 1.
Compounds Ability to Inhibit (Ki) Testosterone Metabolism by CYP3A4. The number of paraphrases is the error in the last digit from at least three measurements.
| Series | Cmpd | Structure | Ki +/− SD (μM) | Series | Cmpd | Structure | Ki +/− SD (μM) |
|---|---|---|---|---|---|---|---|
| 1 | 1 | 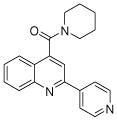 |
3.9 (7) | 6 | 16 |  |
0.31 (5) |
| 1 | 2 | 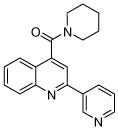 |
>100 | 6 | 17 | 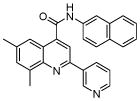 |
N.D.1 |
| 1 | 3 | 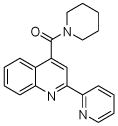 |
N.D.1 | 6 | 18 |  |
>100 |
| 2 | 4 | 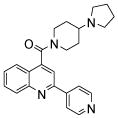 |
45 (7) | 7 | 19 |  |
0.067 (1) |
| 2 | 5 | 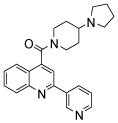 |
N.D.1 | 7 | 20 | 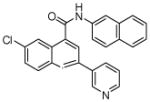 |
7 (2) |
| 2 | 6 | 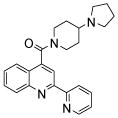 |
N.D.1 | 8 | 21 |  |
1.0 (2) |
| 3 | 7 |  |
0.076 (3) | 8 | 22 | 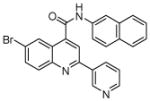 |
16 (5) |
| 3 | 8 |  |
0.41 (6) | 9 | 23 | 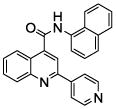 |
0.24 (4) |
| 3 | 9 |  |
95 (21) | 9 | 24 | 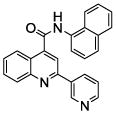 |
2.3 (7) |
| 4 | 10 |  |
0.16 (4) | 9 | 25 | 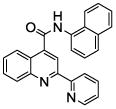 |
1.5 (3) |
| 4 | 11 | 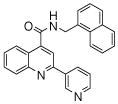 |
0.52 (4) | 26 |  |
N.D.1 | |
| 4 | 12 |  |
1.2 (4) | ||||
| 5 | 13 |  |
0.7 (2) | ||||
| 5 | 14 |  |
0.98 (9) | ||||
| 5 | 15 |  |
14 (3) |
ND, not determined do to solubility or very low affinity.
Table 2.
Comparison of binding affinity on para, meta, ortho compounds.
| Series | Ki (nM) para | Ki (nM) Meta | Ki (nM) ortho | ortho/para |
|---|---|---|---|---|
| 1 | 3,900 | >100,000 | >100,000 | >25 |
| 2 | 45,000 | ND1 | ND | ND |
| 3 | 76 | 418 | 94,900 | 1,249 |
| 4 | 163 | 517 | 1,200 | 7 |
| 5 | 667 | 982 | 14,490 | 22 |
| 6 | 313 | ND | >100,000 | 319 |
| 7 | 67 | 7,432 | NS2 | 1113 |
| 8 | 1,027 | 15,670 | NS | 153 |
| 9 | 240 | 2,264 | 1,514 | 6 |
ND, not determined see results.
NS, not synthesized.
meta/para since ortho value is not available.
To determine if the differences in binding affinity are a result of changes in binding modes from nitrogen coordination (type II) to high spin type I binding, we chose series 1, 3, 4, 5, 6, and 9 of para, meta, and ortho analogs for UV/vis difference spectra analysis (the UV absorbance of these compounds does not interfere with the assay; data not shown). The results are shown in Table 3. All of the compounds with a para nitrogen (1, 10, 13, 16, 23) showed normal type II binding spectra with a peak at ~427 nm and a trough at ~395 nm. The Ks values for compounds 10 and 16 were corrected for tight binding to the enzyme (see experimental), this correction did not significantly effect other compound. Compounds with a meta nitrogen gave either type II spectra such as compounds 8, 11, 14, 24, or mixed spectra which shows a peak at ~ 422 nm, but no obvious trough in difference spectra including compounds 2 and 7. Compounds with ortho nitrogen including 3, 9, 12, 15, 18, 25 gave typical type I spectra with a peak at ~393 nm and a trough at ~427 nm.
Table 3.
Binding mode results of UV/vis difference spectra.
| Compound | Binding spectra min(nm)/max(nm) | Ks (μM) | Reduced heme iron (2+) Ks (μM) |
|---|---|---|---|
| 1 | type II 393/427 | > 22.64 | NDc |
| 2 | mixed −/422 | NDc | NDc |
| 3 | type I 429/393 | NDb | NDc |
| 8 | type II 393/425 | 13.33 | NDc |
| 9 | type I | NDc | NDc |
| 10 | type II 395/428 | 0.345 | 10.23 |
| 11 | type II 388/425 | 8.45 | NDc |
| 12 | type I 426/391 | NDb | NDc |
| 13 | type II 394/428 | 2.34 | 47.95 |
| 14 | type II 393/428 | 11.64 | Shifted type I 449/414 |
| 15 | type I 430/388 | NDb | NDc |
| 16 | type II 397/425 | 0.54 d | NDb |
| 17 | mixed −/424 | NDc | NDc |
| 18 | type I | NDc | NDc |
| 23 | type II 393/427 | 3.06 | NDc |
| 24 | type II 394/425 | 10.85 | NDc |
| 25 | type I 431/388 | NDc | NDc |
substrate absorbance prevented characterization
data cannot be determined due to solubility issues
data were not collected
these values were corrected for changes in substrate concentration as a result of enzyme binding as described in the experimental section.
Interestingly, the Ks values in Table 3 are larger than the Ki values shown in Table 1. While we are not certain as to the cause of the difference but one possibility is that testosterone increases the affinity of the quinoline carboxamides by an allosteric effect as described in Johnson et al., [17].
Theoretical methods provide useful tools for estimating enzyme-substrate interaction, and have been a particularly useful tool in understanding P450 enzymes [14–16]. In order to see if theoretical methods could be used to estimate the energetics of type II binding relative to water coordinated ferric iron, we conduct DFT computational calculations on pyridine coordinated to the heme and water coordinated to the heme. The results are shown in Table 4 and it is obvious that the two most popular functionals could not reproduce the rank-order of binding. The B3LYP functional predicts water would bind much tighter than pyridine, which is inconsistent with type II binding occurring. The OPBE functional correctly predicts that pyridine would bind tighter than water, although by a very small amount of energy. However, the high-spin five-coordinate sextet would be favored over the water coordinated (6.5 kcal/mol), or pyridine coordinated heme (5.8 kcal/mol), again predicting that type II binding would not occur to any extent. The non-empirical TPSS functional was found to reproduce the known binding order, although it did miss-order the five-coordinate spin-state giving a doublet that was 4.4 kcal/mol more stable than the sextet. Even very large basis sets did not change this spin-state ordering (data not shown). The TPSS functional calculations show pyridine binding tighter than water by around 5 kcal/mol, which would translate into a around a 3,000 fold difference in binding affinity between water and pyridine binding and place a limit on the difference between type II and type I binding compounds. Interestingly, this is about the difference we measured previously for the strength of type II binding to CYP2C9 [5], and given the errors associated with the DFT calculations close to the 1,000 fold difference seen for CYP3A4. Given the results of this benchmarking experiment for water versus pyridine binding we decided to use the TPSS functional for the remaining calculations. The energies and structures for each method are given in Table S1 in the supplementary material.
Table 4.
The enthalpy of binding water and pyridine relative to doublet heme and free substrate with cc-VDZ basis set1.
| different functionales \ heme coordination | OPBE2 | B3LYP | TPSS |
|---|---|---|---|
| Pyridine + Heme | −1.56 | −9.14 | −13.7 |
| Water + Heme | −0.86 | −20.06 | −8.4 |
| Sextet relative to Doublet | −7.39 | −6.6 | 4.4 |
See methods and supplemental for a full description of the basis set.
(kcal/mol).
To determine the metabolic stability of this series of compounds, we measured the substrate depletion of 1 μM substrate concentration over 30 minutes. The results show that a number of these compounds are very good substrates with over 49% of the substrate metabolized over the course of the experiment. Only compounds 1–3 are resistant to metabolism. No clear trend is observed within a series, although often the para nitrogen containing compounds are metabolized faster relative to the meta or ortho compounds.
Since a number of the compounds have Ki values higher than 1 μM, we selected compounds to test for substrate depletion at 25 μM. The results are shown in Table 6. Of the compound tested all still were still subject to extensive metabolism, but the slight preference for increased metabolism of the para compound in the series is not observed at this higher substrate concentration. The metabolic stability was increased for para compounds in series 3, 4, 7, 8 except for compound 13 in series 5.
Table 6.
Metabolic stability of 25 μM of selected compounds at 0, 5, 10, 15, 20, 30 time points.
| Series | compound | Structure | Percent Remaining (%) at Time Point 0 (min) | 5 (min) | 10 (min) | 15 (min) | 20 (min) | 30 (min) |
|---|---|---|---|---|---|---|---|---|
| 3 | 7 |  |
100 | 82 | 76 | 76 | 77 | 90 |
| 3 | 8 |  |
100 | 100 | 80 | 66 | 56 | 41 |
| 3 | 9 |  |
100 | 105 | - | 104 | 118 | 73 |
| 4 | 10 |  |
100 | 78 | 61 | 58 | 55 | 50 |
| 4 | 11 | 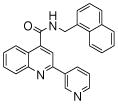 |
100 | 61 | 40 | 44 | 33 | 17 |
| 4 | 12 |  |
100 | 71 | 50 | 36 | 24 | 15 |
| 5 | 13 |  |
100 | 101 | 96 | 92 | 74 | 53 |
| 5 | 14 |  |
100 | 91 | 85 | 69 | 60 | 47 |
| 5 | 15 |  |
100 | 107 | 109 | 104 | 91 | 70 |
| 7 | 19 |  |
100 | 97 | 86 | 89 | 77 | 57 |
| 7 | 20 | 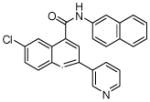 |
100 | 98 | 81 | 52 | 41 | 33 |
| 9 | 23 | 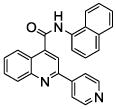 |
100 | 95 | 87 | 89 | 79 | 72 |
| 9 | 24 | 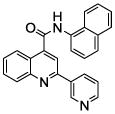 |
100 | 88 | 71 | 62 | 61 | 54 |
| 9 | 25 | 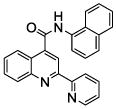 |
100 | 99 | 76 | 74 | 57 | 42 |
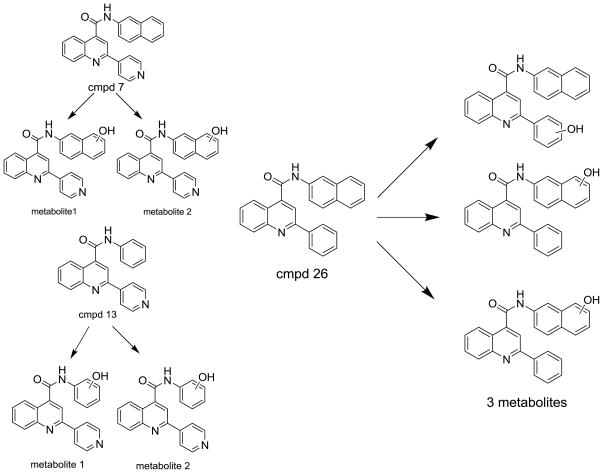
We chose four of the tight binders compounds 7, 8, 9 and 13 and one analog of compound 7, compound 26, to study the regioselectivity of metabolism (Figure 3). The difference between compound 7 and 26 is that the nitrogen atom on the pyridine moiety was replaced by a carbon atom. The regioselectivity results from LC-MS/MS experiments show the sites of metabolism to be aromatic hydroxylation of the phenyl and naphthalene groups, with no metabolism on the quinoline ring. The para nitrogen containing compounds 7, 8, 9 and 13 are metabolized to two different metabolites on the naphthalene or phenyl group, but not on the pyridine type II coordinating ring. Attempts to find pyridine N-oxides were not successful, but no standard was available so the limits of detection are not known. Compound 26 was metabolized on both the naphthalene and phenyl group. The two metabolites on the naphthalene ring system comprise 40 and 30 % of the total metabolism respectively, with the remaining 30% occurring on the phenyl ring.
Figure 3.
Metabolic regioselectivity results of compound 7, 13, and 26.
Given the extensive metabolism, and the obvious translational and rotational mobility of the substrates evident from the multiple metabolites formed (Figure 3), it becomes of interest to understand how type II binding compounds get metabolized. The major kinetic question is whether they form a dead-end complex, or if they can reorient rapidly to an orientation that can undergo reduction, or if type II complexes can be reduced directly. While it has always been assumed type II complexes cannot be directly reduced, to our knowledge, the differences in reduction potential have never been measured or estimated by other means. One possible method to explore this is the use of titration spectroscopy of the ferric and ferrous state of the enzyme. Thus, to determine the difference in nitrogen coordination affinity for heme between reduced and oxidized heme, we measured spectral binding affinity, Ks for both states. We were able to measure the type II Ks for the oxidized and reduced heme for two different compounds, 10 (oxidized form: 0.34 μM and reduced form: 10.23 μM) and 13 (oxidized form: 2.34 μM and reduced form: 47.95 μM). The reduced type II spectra were measured at ~444 nm maximum peak as described in Testa and Jenner [18]. The average differences in spectral dissociation constants indicate that the reduced heme binds type II compounds less tightly compared to oxidized ferric heme by 25 fold, or 1.9 kcal/mol. One potential concern is that the enzyme might auto-oxidize back to the ferric heme since the reactions are not explicitly anaerobic. However, dithionite depletes oxygen entirely from the cuvette, as measured by an oxygen electrode, (data not shown) and the measurement is made at 444 nm while the oxidized heme absorbs at a lower wavelength.
The TPSS DFT computational methods agree with the change in affinity measured by the spectral dissociation constants associated with reduction of the heme. The predicted difference in energy for pyridine binding to the heme in the Fe3+ versus Fe2+ state is 1.8 kcal/mol in good agreement with the experimental measurement of 1.9 kcal/mol. Since binding and reduction are state functions, a thermodynamic cycle can be constructed to determine the change in redox potential for free heme and type II coordinated heme. This 1.8 kcal/mol energy difference in binding to oxidized and reduced heme would change the redox potential by 72 mV for reducing the coordinated (type II) versus the reduction of the five-coordinate heme.
DISCUSSION
Coordination to the heme-iron of P450 by sp2 nitrogen containing compounds (type II binding) has been shown to affect the binding modes of the ligand and increase metabolic stability for some compounds [2,3]. It is tempting to speculate that this is a general phenomenon that can be used to modulate affinity and metabolic stability for the P450 enzyme family. Given the potential for drug design it is important that we understand the underlying chemistry of this interaction.
Previously we have shown that a series of quinoline carboxamide analogs could show up to a 4,200-fold difference in affinity for CYP2C9 for almost identical compounds simply by changing the position of the nitrogen in the aromatic ring (structures shown in Figure 2) [5]. In this and the previous study each series of compounds only differs by the position of the nitrogen, while the remaining functionality is unchanged. This allows us to study the effect of nitrogen coordination in the relative absence of other confounding variables. In the previous studies for CYP2C9, compounds with nitrogen in the para-position (see Figure 2 for structure) had a higher affinity as a result of their ability to coordinate to the heme-iron. Given the high coordination affinity, almost no metabolism of type II binders would be expected if type II binding represents a dead-end kinetic complex as shown in Figure 1. Herein we describe experiments which again show that type II binding can have a profound influence on binding affinity for a different P450 enzyme, CYP3A4. However, we unexpectedly found that type II binding compounds could also be subjected to extensive metabolism which appears inconsistent with the existing dead-end complex kinetic model for type II binding. We tentatively hypothesize that some fraction of the metabolism may occur through direct reduction of the type II coordinated enzyme-substrate complex.
In general, substrates binding to P450 enzymes cause a change in the spin state of the heme-iron as reflected in the UV/vis difference spectra. Most compounds bind above the distal plane of the heme normally around 3–5 angstroms from the heme-iron altering the solvation of the distal face giving rise to a high-spin five-coordinate heme which absorbs around 390 nm (type I difference spectra) resulting in a decrease of the high-spin six-coordinate heme which absorbs at 420 nm. An alternate type of binding is observed for some sp2 nitrogen containing compounds, in that they can coordinate to the iron, causing a red shift in the six coordinate spectra, and remain low-spin (type II difference spectra). All the para linked pyridine compounds show type II difference spectrum which confirms that the nitrogen can coordinate to the heme iron. The difference spectra for meta compounds show mixed type I and type II spectra or type II spectra, while the ortho compounds, gave typical type I binding spectra, and never give a type II absorbance spectra. Overall this means that we can use each series of para, meta, and ortho linked pyridines to study the effect of type II binding on affinity and kinetics. As expected from our previous studies with CYP2C9, the affinity within a series of pyridine containing compounds for CYP3A4 is always highest for the para linkage, versus the meta and ortho linkage. The difference in binding affinity can be as high as 1,200 fold. We were able to correlate the high affinity with UV/vis spectral changes associated with coordination to the heme-iron.
Given that these studies indicate nitrogen has a rather high affinity for iron and that the measurements are relatively simple to interpret, it is interesting to use these interactions as a benchmark to determine how different theoretical DFT methods behave in predicting heme-nitrogen interactions. We assume that the largest difference in measured affinities reflects the best estimate of the strength of binding, since protein substrate interactions would disrupt “perfect type II interactions” and decrease the difference between ortho, meta, and para linkages. The measured Ki values indicate that the largest difference in affinity is 1,200 fold, for compounds 7 and 9. The fact that compounds 7, 8 and 9 represent the tightest binding complete series compared to other series tends to support our assumption that enzyme-substrate interactions that decrease ortho/para difference disrupt “perfect type II interactions”. This leaves a lower limit on energy difference of 4.4 kcal/mol between type II binding (para linkage) and type I binding (ortho linkage), which is very similar to the value of 5.0 kcal/mol measured for CYP2C9. Using the measured difference in binding affinity as a benchmark for different DFT funtionals for determining each methods ability to predict type II binding affinity versus water (See Table 4). It can be seen that for looking at resting state (Fe3+) nitrogen coordination only the TPSS functional predicts that nitrogen will bind to the heme iron more favorably then the water-coordinated or the five coordinate high-spin heme. OPBE, which correctly predicts the sextet to be lower in energy than the doublet, also predicts that the sextet state would be lower in energy than the water coordinated resting state, or the nitrogen coordinated type II complex. The B3LYP method predicts that water will bind tighter than nitrogen by over 10 kcal/mol. The TPSS method accurately predicts that pyridine binding to the heme-iron, ignoring entropy, will be 5.3 kcal/mol exothermic relative to the resting state water-bound-heme. Thus, the TPSS functional is the best one tested for predicting nitrogen-heme interaction energies. This should not be construed to be any indication of how these DFT methods would perform on transition states, or for mechanistic predictions. However, we will use the TPSS functional to help support a new kinetic mechanism associated with metabolism of nitrogen-coordinated compounds based on these results (see below).
It is obvious from the metabolic stability data presented at 1 μM (Table 5) and 25 μM (Table 6) that type II binding does not prevent metabolism, and in fact at the lower substrate concentration of 1 μM, the enhanced affinity associated with type II binding actually increases the clearance as measured by metabolic stability. This finding further highlights the fact that very little is known about how type II substrates are metabolized. Based on the high amounts of metabolism debinding of the type II inhibitor to give free enzyme and substrate with reorientation to a binding mode that would favor metabolism can be excluded. Debinding and rebinding of substrate would always lead to low ratios of type I to type II binding since nitrogen coordination to iron is strongly favored. This would lead to overall low concentrations of ES complex and a decrease in the overall rates of metabolism for type II substrate relative to the structurally related type I substrate. Thus, debinding and rebinding is not consistent with the enhanced metabolism of the type II binding compounds relative to the type I compounds. This is in contrast to itraconazole, which is metabolized slowly (0.0016 s−1) after an initial burst, and has been shown to debind and rebind to give a metabolically active ES complex by Pearson et al. [19].
Table 5.
Metabolic stability of 1 μM of each compound at 0, 5, 10, 15, 20, 30 time points. The number in parentheses is the error in the last digit for two measurements.
| Series | Compound | Structure | Percent Remaining (%) at Time Point 0 (min) | 5 (min) | 10 (min) | 15 (min) | 20 (min) | 30 (min) |
|---|---|---|---|---|---|---|---|---|
| 1 | 1 | 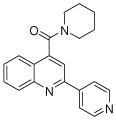 |
100.0 | 111 (5) | 105 (3) | 87 (8) | 107 (60) | 103 (20) |
| 1 | 2 | 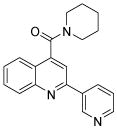 |
100.0 | 90 (4) | 73 (4) | 91 (64) | 82 (20) | 91 (16) |
| 1 | 3 | 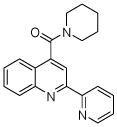 |
100.0 | 139 (7) | 139 (10) | 120 (14) | 129 (5) | 116 (15) |
| 2 | 4 | 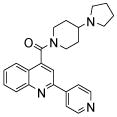 |
100.0 | 68.8 (14) | 39 (2) | 25 (2) | 30 (3) | 24.4 (3) |
| 2 | 5 | 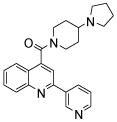 |
99.9 | 82 (32) | 74 (46) | 53 (14) | 67 (22) | 51 (70) |
| 2 | 6 | 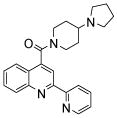 |
100.0 | 62 (20) | 31 (2) | 30 (2) | 34 (7) | 45 (18) |
| 3 | 7 |  |
100.0 | 58 (1) | 46 (6) | 18.0 (6) | 9.7 (5) | 4.5 (4) |
| 3 | 8 |  |
100.0 | 32.9 (3) | 16 (1) | 9.0 (2) | 5.2 (5) | 2.6 (1) |
| 3 | 9 |  |
100.0 | 76.7 (8) | 54 (1) | 46 (2) | 43 (8) | 25.5 (8) |
| 4 | 10 |  |
100.0 | 10 (3) | 0.9 (8) | 1 (2) | 0.4 (4) | 0.1 (2) |
| 4 | 11 | 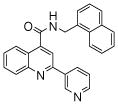 |
100.0 | 3 (3) | 8 (8) | 9 (3) | 4 (1) | 6 (1) |
| 4 | 12 |  |
100.0 | 1.2 (1) | 1.6 (8) | 1.2 (9) | 1.0 (6) | 0.2 (1) |
| 5 | 13 |  |
100.0 | 26 (2) | 9.6 (6) | 6 (1) | 4 (1) | 0.9 (2) |
| 5 | 14 |  |
100.0 | 53 (1) | 35 (4) | 25.7 (8) | 23 (68) | 12.1 (3) |
| 5 | 15 |  |
100.0 | 83.4 (2) | 68 (2) | 57.2 (2) | - | 44 (7) |
| 6 | 16 |  |
100.0 | 44 (14) | 30.2 (6) | 18 (5) | 14.1 (2) | 8.0 (3) |
| 6 | 17 | 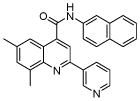 |
100.0 | 37.1 (4) | 24 (9) | 14.1 (3) | 8 (4) | 8 (10) |
| 6 | 18 |  |
100.0 | 79 (2) | 79 (6) | 51.5 (7) | 43.1 (3) | 32 (1) |
| 7 | 19 |  |
100.0 | 49 (5) | 28 (2) | 18 (1) | 11.8 (4) | 6.6 (1) |
| 7 | 20 | 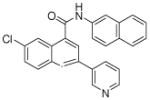 |
100.0 | 55 (1) | 39.0 (8) | 26.6 (8) | 19.5 (8) | 12.9 (4) |
| 8 | 21 |  |
100.0 | 59 (1) | 48 (5) | 24 (1) | 19 (2) | 11 (1) |
| 8 | 22 | 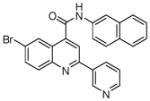 |
100.0 | 71 (1) | 47 (8) | 38 (3) | 25 (2) | 20.2 (1) |
| 9 | 23 | 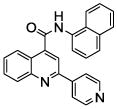 |
100.0 | 31 (1) | 7 (1) | 2 (1) | 1 (1) | 0.2 (1) |
| 9 | 24 | 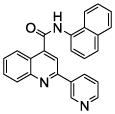 |
100.0 | 6 (3) | 5.3 (4) | 4 (1) | 0.9 (1) | 0.2 (1) |
| 9 | 25 | 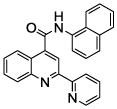 |
100.0 | 21 (2) | 10 (3) | 1.1 (1) | 1.7 (5) | 0.3 (2) |
| 26 |  |
100.0 | 73 (15) | 68 (22) | 39.5 (2) | 34 (2) | 25.1 (4) |
Given the lack of total debinding and reorientation, a second kinetic model, shown on Figure 1, may be useful in explaining the results. In this model dead-end complex formation (ED) is in equilibrium with a metabolically active binding orientation by translation and rotation in the active-site as opposed to debinding to give free substrate. This model would be consistent with faster type II versus type I metabolism if breaking the nitrogen-iron bond was rapid relative to reduction of the reoriented metabolically active ES complex. No definitive experiments are available in the literature to measure reorientation of substrate from the type II ED complex (see Figure 1) to give the ES complex. Intramolecular isotope effects indicate that for type I binding compounds reorientation is faster than oxidation of the substrate, which is in turn is faster than reduction of the protein [20–22]. However, surface plasmon resonance (SPR) studies on itraconazole debinding from 3A4 indicate that nitrogen coordination can influence the overall off-rate of the ED complex to give free substrate relative to the debinding of the metabolically active ES complex. This means that for itraconazole, breaking the nitrogen-iron bond is partially rate limiting. However, it is still possible that these smaller substrates rapidly reorient in the active-site leading to metabolism. This is supported in part by the regioselectivity of metabolism, which leads to hydroxylation away from the type II orientation (Figure 3).
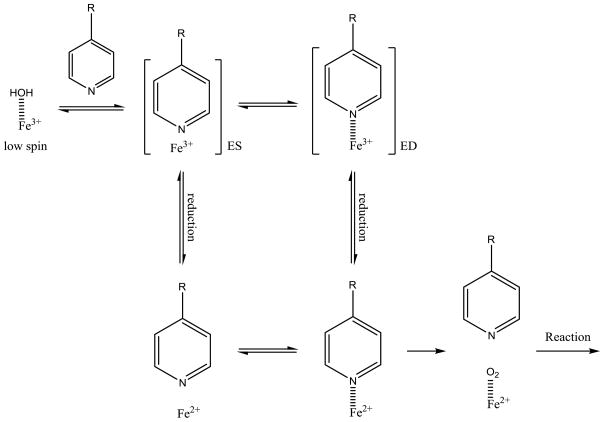
A final possible mechanism is direct reduction of the ED complex to give the Fe2+ nitrogen coordinated complex. This mechanism involves direct reduction, followed by breaking of the nitrogen-iron coordination, followed by oxygen binding, as shown in Figure 4.
Figure 4.
Kinetic mechanism of type II binding compound with six and five coordinated heme iron with direct reduction of six-coordinate heme.
The potential for this mechanism to describe type II metabolism rests on the assumption that reduction of the ED (type II) complex is possible, and faster than nitrogen-iron bond breaking to form the ES complex. Theoretical calculations using the TPSS method described above indicate that binding of pyridine to the Fe2+ iron is only 1.8 kcal/mol higher in energy than binding to Fe3+, indicating that direct reduction is possible (Table 4). The UV/vis dissociation constants for a type II binding compounds to the oxidized and reduced heme give Ks values that are in close agreement with the DFT calculations (the two values could be measured are 30 and 22 fold difference for compounds 10 and 13 at 30 °C or 1.9 kcal/mol, see Table 3). However the barrier heights are unknown for either process. (Attempts to determine the barrier height for dissociation did not lead to a transition state, but rather to a steady rise in energy as the iron-nitrogen bond was lengthened.)
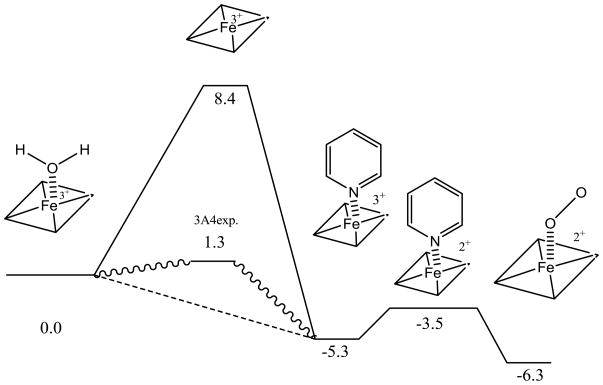
Thus, a new model shown in Figure 5 is a possibility for the metabolism of the series of pyridine containing compounds used in this study. The thermodynamics of the pathway as calculated by DFT methodology (Figure 5) indicates that the initial type II binding event is around 5.3 kcal/mol exothermic relative to the water bound resting state. While the TPSS 5-coordinate doublet state lays 13.7 kcal/mol higher in energy than type II binding. This state may be stabilized by type I binding compounds, and using the Ks values reported for testosterone the sextet 5-coordinate heme [23] would be about 1.3 kcal/mol endothermic from the resting state. The relatively stable type II coordinated heme can either debind, which is endothermic by 6.6 kcal/mol to follow the dead-end kinetics depicted in Figure 1, or can be reduced (endothermic at 3.3 kcal/mol) and the nitrogen be displaced by oxygen to start the catalytic cycle. While this is a thermodynamic argument, it provides lower limits on the kinetic barriers associated with the process. Ongoing kinetic measurements should clarify if this pathway is possible. The differences between the kinetic pathways shown in Figure 1 and Figure 8 are extremely important in understanding whether type II binding can be used to modulate reaction rates. Furthermore, understanding if these kinetic schemes are general and can be applied to other type II binding nitrogen containing aromatic compounds such as imidazole could play an important role in understanding how to develop metabolically stable drugs.
Figure 5.
Energy diagram of water versus pyridine bound heme using DFT (TPSS) calculation.
In conclusion, the systematic study of nitrogen-iron coordination in P450 3A4 indicates that increases in binding affinity of over thousand fold are associated with this interaction. Even with these very tight interaction energies the compounds are metabolized to a significant extent, and type II binding, at least for pyridine containing compounds, does not appear to increase metabolic stability. Furthermore, the results are difficult to reconcile with the formation of a dead-end kinetic complex unless the nitrogen-iron bond is rapidly broken, and a new kinetic model with direct reduction of the nitrogen-coordinated heme is proposed as an alternate explanation. At present we are conducting experiments to distinguish between these two mechanisms.
Supplementary Material
Acknowledgments
This work was supported by GM84546 for the National Institute of General Medical Sciences.
Footnotes
Supporting Information Available. The basis set, energies and Cartesian coordinates for all the DFT calculated structures are available.
Publisher's Disclaimer: This is a PDF file of an unedited manuscript that has been accepted for publication. As a service to our customers we are providing this early version of the manuscript. The manuscript will undergo copyediting, typesetting, and review of the resulting proof before it is published in its final citable form. Please note that during the production process errors may be discovered which could affect the content, and all legal disclaimers that apply to the journal pertain.
References
- 1.Ortiz de Montellano PR. In: Cytochrome P450:Structure, Mechanism, and Biochemistry. de Ortiz DM, editor. Plenum; New York: 1995. [Google Scholar]
- 2.Chiba M, Tang C, Neway WE, Williams TM, Desolms SJ, Dinsmore CJ, Wai JS, Lin JH. P450 interaction with farnesyl-protein transferase inhibitors. Metabolic stability, inhibitory potency, and P450 binding spectra in human liver microsomes. Biochem Pharmacol. 2001;62:773–776. doi: 10.1016/s0006-2952(01)00724-9. [DOI] [PubMed] [Google Scholar]
- 3.Chiba M, Jin L, Neway W, Vacca JP, Tata JR, Chapman K, Lin JH. P450 interaction with HIV protease inhibitors: relationship between metabolic stability, inhibitory potency, and P450 binding spectra. Drug Metab Dispos. 2001;29:1–3. [PubMed] [Google Scholar]
- 4.Peng CC, Rushmore T, Crouch GJ, Jones JP. Modeling and synthesis of novel tight-binding inhibitors of cytochrome P450 2C9. Bioorg Med Chem. 2008;16:4064–4074. doi: 10.1016/j.bmc.2008.01.021. [DOI] [PubMed] [Google Scholar]
- 5.Peng CC, Cape JL, Rushmore T, Crouch GJ, Jones JP. Cytochrome P450 2C9 type II binding studies on quinoline-4-carboxamide analogues. J Med Chem. 2008;51:8000–8011. doi: 10.1021/jm8011257. [DOI] [PMC free article] [PubMed] [Google Scholar]
- 6.Hudelson MG, Ketkar NS, Holder LB, Carlson TJ, Peng CC, Waldher BJ, Jones JP. High confidence predictions of drug-drug interactions: predicting affinities for cytochrome P450 2C9 with multiple computational methods. J Med Chem. 2008;51:648–654. doi: 10.1021/jm701130z. [DOI] [PubMed] [Google Scholar]
- 7.Dickmann LJ, Locuson CW, Jones JP, Rettie AE. Differential roles of Arg97, Asp293, and Arg108 in enzyme stability and substrate specificity of CYP2C9. Mol Pharmacol. 2004;65:842–850. doi: 10.1124/mol.65.4.842. [DOI] [PubMed] [Google Scholar]
- 8.Locuson CW, Hutzler JM, Tracy TS. Visible spectra of type II cytochrome P450-drug complexes: evidence that “incomplete” heme coordination is common. Drug Metab Dispos. 2007;35:614–622. doi: 10.1124/dmd.106.012609. [DOI] [PubMed] [Google Scholar]
- 9.Kumaki K, Sato M, Kon H, Nebert DW. Correlation of type I, type II, and reverse type I difference spectra with absolute changes in spin state of hepatic microsomal cytochrome P-450 iron from five mammalian species. J Biol Chem. 1978;253:1048–1058. [PubMed] [Google Scholar]
- 10.Henderson PJ. Steady-state enzyme kinetics with high-affinity substrates or inhibitors. A statistical treatment of dose-response curves. Biochem J. 1973;135:101–107. doi: 10.1042/bj1350101. [DOI] [PMC free article] [PubMed] [Google Scholar]
- 11.Staroverov VN, Scuseria GE, Tao JM, Perdew JP. Comparative assessment of a new nonempirical density functional: Molecules and hydrogen-bonded complexes. J Chem Phys. 2003;119:12129–12137. doi: 10.1063/1.4971853. [DOI] [PubMed] [Google Scholar]
- 12.Groenhof AR, Swart M, Ehlers AW, Lammertsma K. Electronic ground states of iron porphyrin and of the first species in the catalytic reaction cycle of cytochrome P450s. J Phys Chem. 2005;109:3411–3417. doi: 10.1021/jp0441442. [DOI] [PubMed] [Google Scholar]
- 13.Peterson KA, Figgen D, Dolg M, Stoll H. Energy-consistent relativistic pseudopotentials and correlation consistent basis sets for the 4d elements Y-Pd. J Chem Phys. 2007;126:124101. doi: 10.1063/1.2647019. [DOI] [PubMed] [Google Scholar]
- 14.Sharma PK, De Visser SP, Shaik S. Can a single oxidant with two spin states masquerade as two different oxidants? A study of the sulfoxidation mechanism by cytochrome p450. J Amer Chem Soc. 2003;125:8698–8699. doi: 10.1021/ja035135u. [DOI] [PubMed] [Google Scholar]
- 15.Shaik S, Kumar D, de Visser SP, Altun A, Thiel W. Theoretical perspective on the structure and mechanism of cytochrome P450 enzymes. Chem Rev. 2005;105:2279–2328. doi: 10.1021/cr030722j. [DOI] [PubMed] [Google Scholar]
- 16.Cho KB, Moreau Y, Kumar D, Rock DA, Jones JP, Shaik S. Formation of the active species of cytochrome P450 by using iodosylbenzene: A case for spin-selective reactivity. Chem Euro J. 2007;13:4103–4115. doi: 10.1002/chem.200601704. [DOI] [PubMed] [Google Scholar]
- 17.Johnson EF, Schwab GE, Vickery LE. Positive effectors of the binding of an active site-directed amino steroid to rabbit cytochrome P-450 3c. J Biol Chem. 1988;263:17672–17677. [PubMed] [Google Scholar]
- 18.Testa B, Jenner P. Inhibitors of Cytochrome P-450s and their mechanism of action. Drug Metab Rev. 1981;12:1–117. doi: 10.3109/03602538109011082. [DOI] [PubMed] [Google Scholar]
- 19.Pearson JT, Hill JJ, Swank J, Isoherranen N, Kunze KL, Atkins WM. Surface plasmon resonance analysis of antifungal azoles binding to CYP3A4 with kinetic resolution of multiple binding orientations. Biochemistry. 2006;45:6341–6353. doi: 10.1021/bi0600042. [DOI] [PMC free article] [PubMed] [Google Scholar]
- 20.Iyer KR, Jones JP, Darbyshire JF, Trager WF. Intramolecular Isotope Effects For Benzylic Hydroxylation Of Isomeric Xylenes and 4,4′-Dimethylbiphenyl By Cytochrome P450 - Relationship Between Distance Of Methyl Groups and Masking Of the Intrinsic Isotope Effect. Biochemistry. 1997;36:7136–7143. doi: 10.1021/bi962810m. [DOI] [PubMed] [Google Scholar]
- 21.Higgins L, Bennett GA, Shimoji M, Jones JP. Evaluation of Cytochrome P450 Mechanism and Kinetics Using Kinetic Deuterium Isotope Effects. Biochemistry. 1998;37:7039–7046. doi: 10.1021/bi9729864. [DOI] [PubMed] [Google Scholar]
- 22.Audergon C, Iyer KR, Jones JP, Darbyshire JF, Trager WF. Experimental and Theoretical Study of the Effect of Active-Site Constrained Substrate Motion on the Magnitude of the Observed Intramolecular Isotope Effect for the P450 101 Catalyzed Benzylic Hydroxylation of Isomeric Xylenes and 4,4′-Dimethylbiphenyl. J Am Chem Soc. 1999;121:41–47. [Google Scholar]
- 23.Das A, Sligar SG. Modulation of the Cytochrome P450 Reductase Redox Potential by the Phospholipid Bilayer. Biochemistry. 2009;48:12104–12112. doi: 10.1021/bi9011435. [DOI] [PMC free article] [PubMed] [Google Scholar]
Associated Data
This section collects any data citations, data availability statements, or supplementary materials included in this article.


