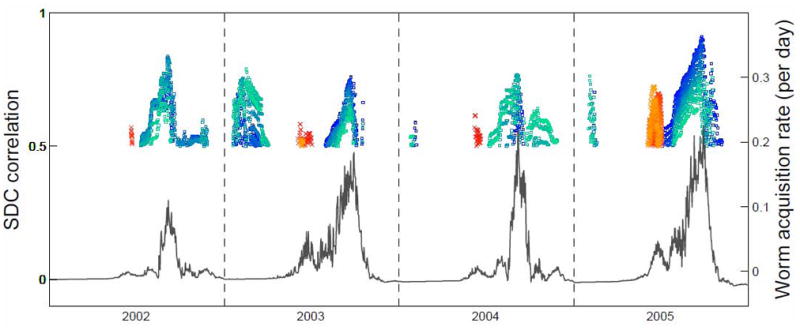
Figure 8.

Xichang (Top) and Changqiu (Bottom): Four years of median predicted worm acquisition rate (day−1), w′, solid line, and results of two-way SDC analysis of the influence of α11 (time lag from +30  to +49
  days) and α21 (time lag from +50 × to +85 × days) on w′ (θ =120, p<0.01). Colored boxes represent significant correlations of fragments accounting for at least 50 percent of total variance; these are overlaid on the predicted worm acquisition curve at the central value of the fragment. Box colors represent the time lag between the correlated fragments. Note differing worm acquisition y-axes.
