Abstract
Introduction
Tight glycemic control (TGC) remains controversial while successful, consistent, and effective protocols remain elusive. This research analyzes data from two TGC trials for root causes of the differences achieved in control and thus potentially in glycemic and other outcomes. The goal is to uncover aspects of successful TGC and delineate the impact of differences in cohorts.
Methods
A retrospective analysis was conducted using records from a 211-patient subset of the GluControl trial taken in Liege, Belgium, and 393 patients from Specialized Relative Insulin Nutrition Titration (SPRINT) in New Zealand. Specialized Relative Insulin Nutrition Titration targeted 4.0–6.0 mmol/liter, similar to the GluControl A (N = 142) target of 4.4–6.1 mmol/liter. The GluControl B (N = 69) target was 7.8–10.0 mmol/liter. Cohorts were matched by Acute Physiology and Chronic Health Evaluation II score and percentage males (p > .35); however, the GluControl cohort was slightly older (p = .011). Overall cohort and per-patient comparisons (median, interquartile range) are shown for (a) glycemic levels achieved, (b) nutrition from carbohydrate (all sources), and (c) insulin dosing for this analysis. Intra- and interpatient variability were examined using clinically validated model-based insulin sensitivity metric and its hour-to-hour variation.
Results
Cohort blood glucose were as follows: SPRINT, 5.7 (5.0–6.6) mmol/liter; GluControl A, 6.3 (5.3–7.6) mmol/liter; and GluControl B, 8.2 (6.9–9.4) mmol/liter. Insulin dosing was 3.0 (1.0–3.0), 1.5 (0.5–3), and 0.7 (0.0–1.7) U/h, respectively. Nutrition from carbohydrate (all sources) was 435.5 (259.2–539.1), 311.0 (0.0–933.1), and 622.1 (103.7–1036.8) kcal/day, respectively.
Median per-patient results for blood glucose were 5.8 (5.3–6.4), 6.4 (5.9–6.9), and 8.3 (7.6–8.8) mmol/liter. Insulin doses were 3.0 (2.0–3.0), 1.5 (0.8–2.0), and 0.5 (0.0–1.0) U/h. Carbohydrate administration was 383.6 (207.4–497.7), 103.7 (0.0–829.4), and 207.4 (0.0–725.8) kcal/day. Overall, SPRINT gave ∼2x more insulin with a 3–4x narrower, but generally non-zero, range of nutritional input to achieve equally TGC with less hypoglycemia.
Specialized Relative Insulin Nutrition Titration had much less hypoglycemia (<2.2 mmol/liter), with 2% of patients, compared to GluControl A (7.7%) and GluControl B (2.9%), indicating much lower variability, with similar results for glucose levels <3.0 mmol/liter. Specialized Relative Insulin Nutrition Titration also had less hyperglycemia (>8.0 mmol/liter) than groups A and B.
GluControl patients (A+B) had a ∼2x wider range of insulin sensitivity than SPRINT. Hour-to-hour variation was similar. Hence GluControl had greater interpatient variability but similar intrapatient variability.
Conclusion
Protocols that dose insulin blind to carbohydrate administration can suffer greater outcome glycemic variability, even if average cohort glycemic targets are met. While the cohorts varied significantly in model-assessed insulin resistance, their variability was similar. Such significant intra- and interpatient variability is a further significant cause and marker of glycemic variability in TGC. The results strongly recommended that TGC protocols be explicitly designed to account for significant intra- and interpatient variability in insulin resistance, as well as specifying or having knowledge of carbohydrate administration to minimize variability in glycemic outcomes across diverse cohorts and/or centers.
Keywords: critical care, GluControl, glycemic control, intensive care unit, intensive care, intensive insulin therapy, Specialized Relative Insulin Nutrition Titration, tight glycemic control, variability
Introduction
Critically ill patients often experience stress-induced hyperglycemia and high levels of insulin resistance.1–7 Hyperglycemia worsens outcomes, increasing the risk of severe infection,8 myocardial infarction,1 and critical illness such as polyneuropathy and multiple organ failure.7 The occurrence of hyperglycemia, particularly severe hyper-glycemia, is associated with increased morbidity and mortality in this group of patients.1,3 Glycemic variability, and thus poor control, are also independently associated with increased mortality.9,10
Some studies have shown that tight glycemic control (TGC) reduced intensive care unit (ICU) patient mortality up to 45%, with glycemic targets from 6.1 to 7.75 mmol/liter.7,11–13 However, there is little agreement on what constitutes desirable glycemic performance,14–16 particularly with regard to how TGC affects outcome. Despite the potential, many ICUs do not used fixed protocols.4,14,15,17,18
In general, any glycemic control protocol must reduce elevated blood glucose levels with minimal hypoglycemia, while accounting for interpatient variability, conflicting drug therapies, and dynamically evolving physiological condition. As patient condition evolves, particularly acutely, TGC and intensive insulin therapy can prove difficult. Protocols or clinical practices that utilize large insulin doses can thus suffer from high glycemic variability and excessive hypoglycemia.19 As a result, several clinical trials have not achieved any benefit from TGC.19–22
However, for comparison, any TGC result has to be viewed in the context of the following clinical aspects:
Patient condition and cohort (e.g., diagnostic codes, age, sex).
Insulin dosing and carbohydrate administration from all sources, relative to the resulting blood glucose.
Intrapatient variability and adaptability of the protocol to acute changes in patient condition and resulting acute changes in metabolic response.
Interpatient variability and/or adaptability of a protocol across patients with very different condition and thus different levels of insulin resistance.
Thus how TGC protocols are designed and implemented with respect to these clinical aspects will affect results.
In particular, only two reported protocols explicitly considered carbohydrate intake in protocol design or implementation.13,23–25 Of these, only Specialized Relative Insulin Nutrition Titration (SPRINT) was implemented long enough to show an impact on mortality. Importantly, carbohydrate input has been shown to be an independent marker of mortality in ICU patients26 and thus worthy of consideration in designing overall metabolic management.
More specifically, both cohorts and clinical practice vary between hospitals and countries. These differences may be physiological, be part of different clinical practice standard or culture, or have other causes. In particular, nutritional standards and practice can vary substantially across countries and practices26–28 and were thus potentially one cause of the high variability in nutritional intake and resulting glycemic outcome (the insulin protocols being equivalent) seen in the initial Normoglycemia in Intensive Care Evaluation—Survival Using Glucose Algorithm Regulation (NICE-SUGAR) results,20 as well as in other results that have not yielded a mortality outcome.22 Hence, to design protocols that will consistently yield any potential benefit of TGC, these differences need to be assessed and/or quantified.
This article examines data from SPRINT13 and a subset of the patients from one center (Centre Hospitale Universitaire [CHU], Liege, Belgium) of the GluControl29 study. The analysis examines the following:
Association between carbohydrate administration, insulin dosing, and glycemic outcome with respect to benefit (tight control) and risk (hypoglycemia).
Differences between cohorts in terms of insulin resistance, using a model-based measure, and thus differences in interpatient variability that might affect results.
Differences in the evolution of patient insulin resistance or insulin sensitivity between cohorts and thus differences in intrapatient variability that also might affect results.
In particular, while SPRINT was successful in achieving tight control and reducing both hypoglycemia and mortality, the overall 7-country and 21-center GluControl study was stopped early for reasons of compliance.29 Thus this evaluation compares these results to determine if the differences in control and glycemic outcomes were due to differences in the patient cohorts or their evolution or if they were due to aspects of the control protocol itself and/or its implementation in the context of the single GluControl center studied. The results should provide insight and clearer guidance into the design and implementation of clinical TGC protocols.
Methods
Specialized Relative Insulin Nutrition Titration Protocol
Specialized Relative Insulin Nutrition Titration is a model-derived24,30,31 protocol that controls both insulin and (carbohydrate) nutrition inputs. It was implemented at the Christchurch Hospital Department of Intensive Care in August 200513 and has now been used on over 1000 patients. Interventions consider current and previous blood glucose measurements, current nutrition feed rate relative to a patient-specific goal feed rate, and the prior hourly insulin dose to determine a new nutrition and insulin intervention for the coming 1–2 h measurement interval defined in the protocol.13
More specifically, SPRINT titrates its insulin and nutrition inputs to achieve a target range of 4–6 mmol/liter based on the patient's current insulin sensitivity, determined in response to the insulin and nutrition interventions. More resistant patients receive more insulin and less nutrition (relative to their 100% goal feed rate). Stability and stopping criteria were also based on patient-specific insulin sensitivity. Hence the protocol explicitly considers glycemic response in the context of both insulin and carbohydrate intake and is thus not blind to carbohydrate intake, which is unique, to the best of the authors' knowledge. Virtually all other studies leave nutritional intake to local clinical standards and are thus “blind” to this critical parameter.
A low carbohydrate enteral nutrition formula was also specified for all SPRINT patients per protocol, reducing the percentage of carbohydrate calories as a percentage of the total (specified) caloric intake. Minimum and maximum nutrition rates are 7.5 and 25 kcal/kg/day, respectively, with 2.7 to 9 kcal/kg/day (35–40%) from carbohydrates, which matches American College of Chest Physicians (ACCP) guidelines at the maximum level.27
A further difference is that SPRINT uses insulin boluses, limited to 6 U/h, to minimize insulin saturation.32–35 Boluses also avoid high rates of insulin infusion being left running when clinical staff are occupied, increasing potential safety, which is an important aspect in situations where high insulin infusion rates combined with infrequent measurement can lead to significantly increased hypoglycemic events and variability resulting from acute changes in patient condition and metabolic response.
GluControl
In the GluControl trial,29 patients were randomized in each center to intensive (group A, target: 4.4–6.1 mmol/liter) and conventional (group B, target: 7.8–10 mmol/liter) insulin therapy. Insulin was administered as a continuous intravenous infusion. Hourly measurement was used when the glycemic level was not within the target range. Otherwise, bihourly measurement was used in the case of limited variation of glycemia, defined as less than a 50% change from the previous glycemia in a 2 h range. Finally, quadhourly measurement was used when the glycemic level was less than 50% of the highest glycemia of the previous 4 h. The insulin infusion rates are defined as shown in Tables 1 and 2 for the intensive (Table 1) and conventional (Table 2) protocols. Nutritional input was left to local and/or clinician standards and was not explicitly considered in the design or implementation of the protocol.
Table 1.
GluControl Protocol for Intensive Insulin Therapy (Group A)
| Starting insulin infusion rate | |
|---|---|
| Glycemia | Insulin infusion rate |
| <110 mg/dl | On hold |
| 110–140 mg/dl | 1 U/h |
| 140–180 mg/dl | 2 U/h |
| >180 mg/dl | 4 U/h |
| Maintenance insulin infusion rates and increments | |
| Glycemia | Incremental insulin infusion rate |
| >300 mg/dl | +3 U/h |
| 180–300 mg/dl | +2 U/h |
| 140–180 mg/dl | +1 U/h |
| 110–140 mg/dl | +0.5 U/h |
| 80–110 mg/dl | +0 U/h (target range) |
| 40–80 mg/dl | Stop insulin, hourly control of glycemia until >80mg/dl |
| <40 mg/dl | Stop insulin, 10 g glucose intravenous dextrose, call physician immediately, hourly control of glycemia until >80 mg/dl |
Table 2.
Details of the GluControl Protocol for Conventional Insulin Therapy Group (Group B)
| Starting insulin infusion rate | |
|---|---|
| Glycemia | Insulin infusion rate |
| <180 mg/dl | On hold |
| 180–250 mg/dl | 1 UI/h |
| 250–300 mg/dl | 2 UI/h |
| >300 mg/dl | 4 UI/h |
| Maintenance insulin infusion rates and increments | |
| Glycemia | Incremental insulin infusion rate |
| >300 mg/dl | +3 UI/h |
| 250–300 mg/dl | +2 UI/h |
| 180–250 mg/dl | +1 UI/h |
| 140–180 mg/dl | +0 UI/H (target range) |
| 80–40 mg/dl | Decrease 50% rate insulin |
| 40–80 mg/dl | Stop insulin, hourly control of glycemia until >80mg/dl |
| <40 mg/dl | Stop insulin, 10 g glucose intravenous dextrose, call physician immediately, hourly control of glycemia until >80 mg/dl |
Patient Data
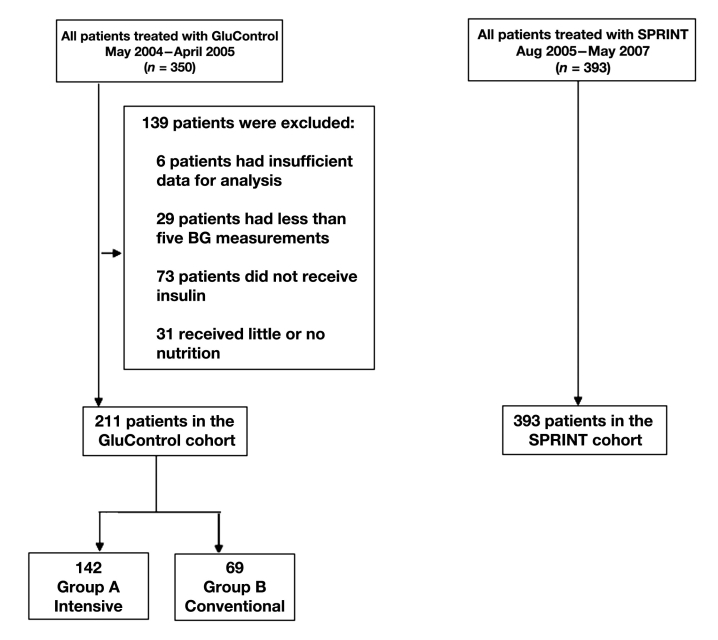
In this study, data were used from 350 patients treated using the GluControl protocol at CHU de Liege, Belgium, between March 2004 and April 2005. Thus the GluControl data are from only one center out of the full study.29 However, the other 21 centers were reported to be generally similar in behavior. Hence individual centers did not fail, but the overall trial did not achieve a clinical mortality outcome. Figure 1 shows the selection of patients used in this analysis. Patients were eliminated from the analysis if they received no insulin for their entire stay (per protocol), had less than five blood glucose measurements over their time in the study, or received little or no (recorded) carbohydrate administration (in any form) for more than 48 h of their stay. All 393 SPRINT patients studied met these criteria.
Figure 1.
Cohort selection for SPRINT and GluControl A (intensive) and B (conventional) insulin therapy groups, resulting in 211 total GluControl patients being retained from the original 350. BG, blood glucose.
Glucose–Insulin System Model
The analysis of patient-specific insulin sensitivity uses a glucose–insulin system model clinically validated in several studies,30,31,33,36–42 defined by,
| (1) |
| (2) |
| (3) |
In this model, G(t) is the total plasma glucose, I(t) is the plasma insulin, and Q(t) is the effect of previously infused insulin being utilized over time. EGPmax is the theoretical maximum endogenous glucose production for a patient, which is suppressed with increasing glucose concentrations. This suppression, independent of noninsulin-mediated glucose uptake by the central nervous system (CNS) is captured by the term with pG. In contrast, patient-specific insulin-mediated glucose removal is captured with SI, insulin sensitivity, which is identified from clinical data as a time-varying value that reflects evolving patient condition.37–39 Exogenous inputs are from the carbohydrate content of nutrition infusions that appear [P(t)] in plasma blood glucose via a two-compartment model leading to P(t)30,36 and intravenous insulin administration uex(t). The remaining parameters are physiologically defined population constants for transport rates (n, k), saturation parameters (αG, αI), or volumes (VG, VI) that have been validated over several studies.
The essential parameter that drives the observed patient-specific glycemic response to insulin and nutrition inputs is insulin sensitivity, SI. With this model, patient-specific profiles can be generated for time-varying SI and its hour-to-hour variation as patient condition evolves. This task is achieved by fitting the model to retrospective clinical data for blood glucose measurements and insulin and carbohydrate administration input data from the protocols.39 The resulting insulin sensitivity profile has been validated in correlation to gold standard euglycemic clamp and intravenous glucose tolerance test data,43–45 as well as in in silico virtual trials.24,31,37,38,42
Stochastic Model
Insulin sensitivity can evolve both gradually and acutely over time in ICU patients.36–38 Stochastic models based on the hour-to-hour variation of this model variable yield distributions of the potential change in insulin sensitivity over 1–4 hours. These distributions then allow the creation of outcome blood glucose confidence bands for a given insulin and nutrition intervention (using the model). Thus, these models also quantify the potential affect on glycemic control of both minor (frequent) and acute (rare) evolutions in patient condition as a function of current metabolic state and the clinical interventions. As a result, a model-based or adaptive TGC system can optimize interventions to minimize the risk of unexpected glycemic excursion and provide better decision making.37,38,42
Knowledge of these dynamic changes provides further metrics of how metabolically dynamic and insulin resistant a given cohort may be. Therefore, they are another means of comparing cohorts for similarities or differences relevant to the quality of glycemic control achieved. While details are left to the references, a more dynamic and/or insulin-resistant cohort would expect to have different bounds on this variability and thus, all else equal, more variable glycemic control. Similarly, a more insulin-resistant cohort would be expected to require more insulin to achieve equal glycemic outcomes. Thus, this model-based parameter and its variation can be used to quantify interpatient and intrapatient variability for different cohorts, also enabling comparison of metabolic variability (over time and across patients) between cohorts.
Results
Table 3 compares the SPRINT and GluControl patients, where the latter are separated by TGC therapy (groups A and B). Severity of illness over all GluControl (A+B) patients (via Acute Physiology and Chronic Health Evaluation II [APACHE II]) and percentage of male patients were similar (p > .35). The total GluControl cohort (A+B) was slightly older (p = .011).
Table 3.
Comparison of GluControl and SPRINT Cohorts
| SPRINT | GluControl | p valuea | ||
|---|---|---|---|---|
| A | B | |||
| Number of patients | 393 | 142 | 69 | |
| Percentage of males (%) | 62.8 | 64.8 | 56.5 | .8531 |
| Age (IQR) | 65 (50–74) | 71 (61–80) | 69 (53–77) | .0011 |
| Apache II score median (IQR) | 18 (14–24) | 17 (14–22) | 17 (14–21) | .3894 |
| Hours of control | 49,008 | 16,831 | 12,946 | |
| Total blood glucose measurement | 29,919 | 4571 | 2820 | |
| Cohorts | ||||
| Blood glucose median (IQR) (mmol/liter) | 5.7 (5.0–6.6) | 6.3 (5.3–7.6) | 8.2 (6.9–9.4) | |
| Insulin rate median (IQR) (mU/min) | 50.0 (16.7–50.0) | 25.0 (8.3–50.0) | 11.7 (0.0–28.3) | |
| Feed rate of carbohydrate median (IQR) (mmol/min) | 0.42 (0.25–0.52) | 0.30 (0.00–0.90) | 0.60 (0.10–1.00) | |
| Number of patients with blood glucose less than 2.2 mmol/liter | 8 (2.0%) | 11 (7.7%) | 2 (2.9%) | |
| Percentage of measurements less than 2.2 mmol/liter (%) | 0.05 | 0.4 | 0.1 | |
| Percentage of measurements less than 3.0 mmol/liter (%) | 0.28 | 1.3 | 0.4 | |
| Percentage of measurements less than 4.0 mmol/liter (%) | 3.9 | 5.3 | 0.8 | |
| Percentage of measurements less than 4.4 mmol/liter (%) | 9.4 | 9.4 | 1.7 | |
| Percentage of measurement between 4.4 and 6.1 mmol/liter (%) | 48.2 | 35.8 | 10.4 | |
| Percentage of measurements between 7.8 and 10.0 mmol/liter (%) | 6.2 | 15.6 | 40.6 | |
| Percentage of measurements greater than 8.0 mmol/liter (%) | 8.0 | 20.3 | 52.5 | |
| Per Patient Results | ||||
| Hours of control median (IQR) | 53 (19–149) | 61 (38–138) | 89 (43–229) | |
| Number of blood glucose measurements taken: median (IQR) | 37 (16–97) | 19 (11–37) | 22 (11–47) | |
| Blood glucose median (IQR) (mmol/liter) | 5.8 (5.3–6.4) | 6.4 (5.9–6.9) | 8.3 (7.6–8.8) | |
| Insulin rate median (IQR) (mU/min) | 50.0 (33.3–50.0) | 25.0 (13.3–33.3) | 8.3 (0.0–16.7) | |
| Feed rate median (IQR) (mmol/min) | 0.37 (0.20–0.48) | 0.1 (0.0–0.8) | 0.2 (0.0–0.7) | |
The p values are for comparing the GluControl A+B cohorts together versus SPRINT.
Median blood glucose for groups A and B were 6.3 and 8.2 mmol/liter, respectively, as expected, and SPRINT was 5.7 mmol/liter, which is similar to the group A value due to their similar glycemic targets. However, variability is much different across these protocols. Median inter-quartile range (IQR) spread (75th–25th percentile) was 1.6 mmol/liter for SPRINT, but 2.3 mmol/liter for group A and 2.5 mmol/liter for group B over the entire cohort(s).
To achieve these results, SPRINT used approximately 2x as much insulin (median: 2.8 U/h) as group A (median: 1.5 U/h), which had a similar glycemic target, and 4x more than group B (0.7 U/h) with the higher glycemic target. It is important to recall that this analysis does not include patients from GluControl who did not receive insulin, so the comparison is per protocol patient treated with insulin. Median nutrition, reported as appearance rate of carbohydrate in the nutritional formulas used, was broadly similar with median rates of 0.3, 0.6, and 0.42 mmol/min for group A, group B, and SPRINT, respectively. However, it is also clear in Table 3 that the spread of carbohydrate administration rates is much more tightly controlled by SPRINT with an IQR range of 0.27 mmol/min for SPRINT versus 0.9 mmol/min for GluControl groups A and B.
With respect to variability and safety from hypoglycemia, SPRINT had increasingly less percentage of measurements below 4.0, 3.0, and 2.2 mmol/liter compared to the similarly targeted group A. Surprisingly, it also had less percentage of measurements below 3.0 and 2.2 mmol/liter than group B, which had a much higher glycemic target, indicating that this protocol had significant variability in glycemic response. As a percentage of patients, SPRINT thus had a much lower rate of hypoglycemia below 2.2 mmol/liter with 2% compared to group A with 7.7% and the higher-targeted group B with 2.9%. The results for hyperglycemic measurements (percentage >8.0 mmol/liter) follow similar trends with expected differences for the higher-targeted group B.
On a per-patient basis, the median patient's median glucose was 6.4 mmol/liter for group A, 8.3 mmol/liter for group B, and 5.8 mmol/liter for SPRINT, similar to those results for each overall cohort. However, the spread of median glucose levels across patients in each cohort was comparable for SPRINT, with 1.1 mmol/liter separating the 25th and 75th percentile patient's median blood glucose value, and GluControl, with 1.0 and 1.2 mmol/liter spreads for groups A and B, respectively.
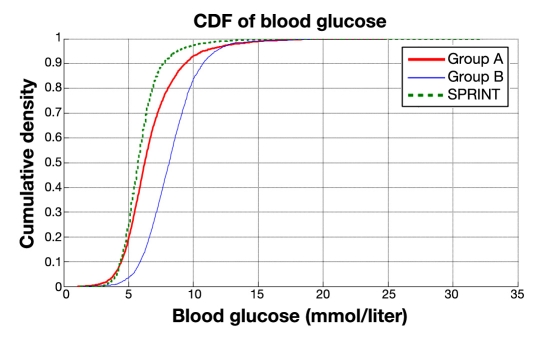
All these results indicate that SPRINT maintained far tighter control on a cohort-wide basis but was comparable for intrapatient glycemic variability when analyzing on a per-patient basis. Figure 2 provides cumulative distribution functions (CDFs) for each protocol's entire cohort, where the steeper SPRINT CDF clearly shows the lower variability compared to GluControl. The GluControl CDFs are similar in slope but shifted, indicating similar behavior around each glycemic target for each cohort. The crossover of the group A and SPRINT CDFs (at ∼0.1 y-axis likelihood value) shows the higher hypoglycemia risk in the similarly targeted group A cohort.
Figure 2.
Cumulative distribution function of measured blood glucose on cohort basis for SPRINT, group A, and group B (GluControl).
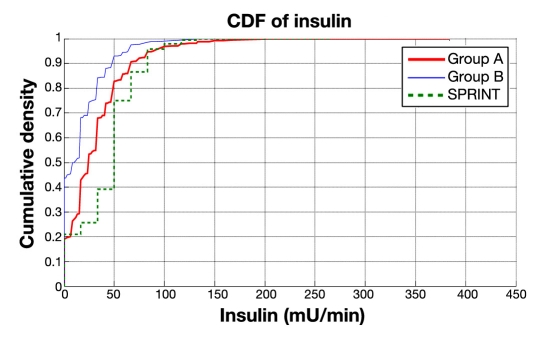
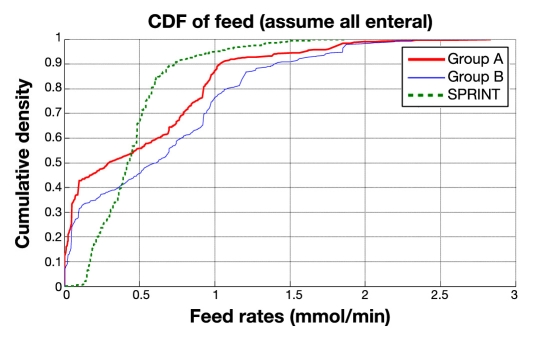
Figure 3 shows the same cohort CDFs for insulin delivered and Figure 4 for nutritional carbohydrate (all sources) delivery rate. It is clear in Figures 3 and 4 that SPRINT provides insulin and nutrition far more consistently across the cohort (steeper and less zero-valued CDFs). Thus SPRINT provided a more constant nutrition rate in terms of carbohydrate appearance from all sources to balance the insulin given with far less variation in glycemic outcome. Importantly, nutrition rate was not a controlled variable and specified only to local standards in the GluControl study, which likely resulted in the greater variability in this input, even in the single center studied here, and thus the greater resulting glycemic variability.
Figure 3.
Cumulative distribution function for hourly insulin infusion rate on cohort basis for SPRINT, group A, and group B (GluControl).
Figure 4.
Cumulative distribution function of nutrition rate on cohort basis for SPRINT, group A, and group B (GluControl).
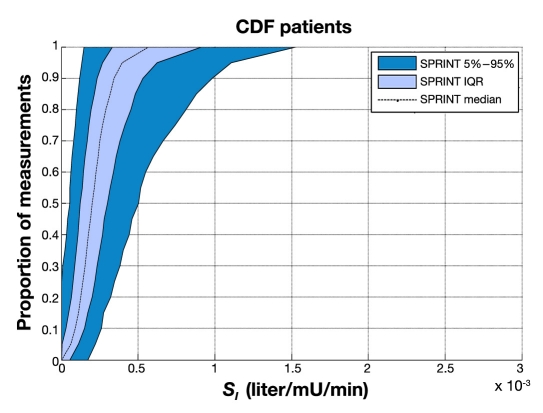
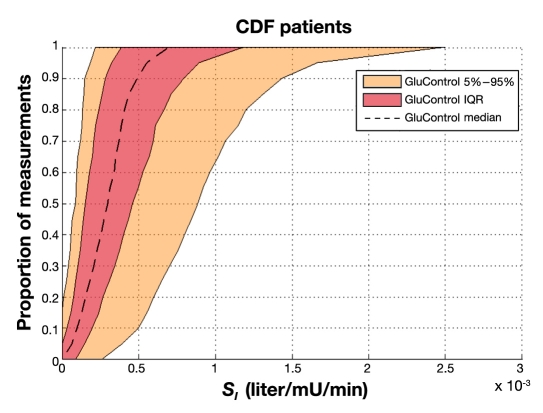
Figures 5 and 6 show empirical per-patient CDFs of model-based insulin sensitivity, SI, for each protocol. The shaded areas show the 90% confidence interval (CI) range and IQR, with the median patient noted by a line. It is clear that the GluControl cohort has higher insulin sensitivity at all likelihoods (y axis) and for all observed percentile patients compared to the SPRINT cohort. It is also clear that the spread or range of insulin sensitivity across the cohort is ∼2x wider for GluControl, indicating a cohort with far greater interpatient variability in insulin sensitivity/resistance and thus one potential reason for its greater outcome glycemic variability.
Figure 5.
Empirical CDFs per patient of insulin sensitivity on SPRINT.
Figure 6.
Empirical CDFs per patient of insulin sensitivity on GluControl.
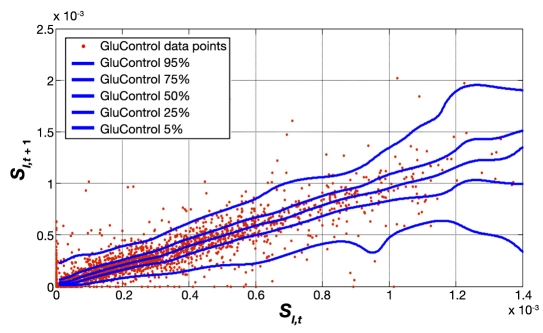
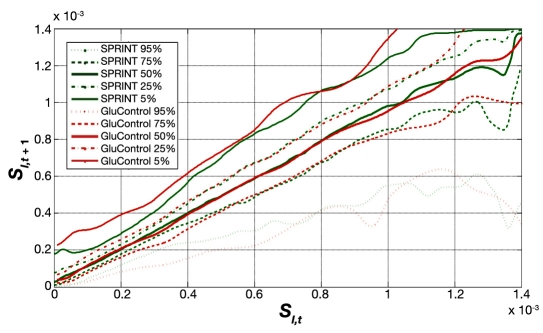
Figure 7 shows the distribution and hour-to-hour variation of fitted SI over time for all GluControl protocol patients, where measurements were 1–2 h apart, enabling the use of the stochastic model of Lin and colleagues.37,38 The x axis shows the SI value at hour t, and a vertical line shows the distribution of possible SI values in the next hour, t + 1 based on the entire cohort's data. The median, IQR, and 90% CI lines provide context and indicate the potential variability and the shape of its distribution over the next hour. This plot thus shows the hour-to-hour distribution and likelihood of metabolic intrapatient glycemic variability in response to an insulin dose for the GluControl cohorts. Hence it might be hypothesized that the greater the intrapatient variability in response to insulin interventions, the greater the resulting glycemic variability in response.
Figure 7.
Fitted hourly SI variation and probability distribution function of GluControl (1–2 h interval).
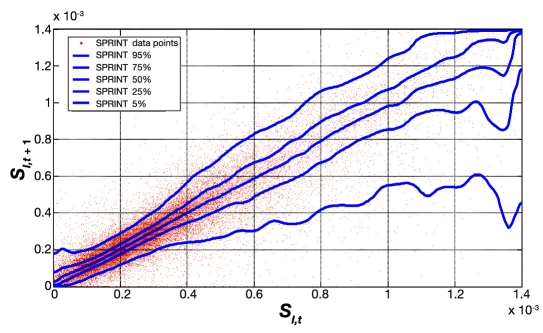
Figure 8 provides the same data for SPRINT on a different y axis scale for clarity. Figure 9 shows the combination of IQR, median, and 90% CI from Figures 7 and 8 for both protocols. Figure 9 clearly shows very similar trends of median, IQR, and 90% CI, indicating very similar metabolic intrapatient variability as assessed by this clinically validated parameter. Thus, despite the different interpatient variation between SPRINT and GluControl in Figures 5 and 6, the hour-to-hour intrapatient variation between cohorts is very similar.
Figure 8.
Fitted hourly SI variation and probability distribution function of SPRINT.
Figure 9.
Fitted hourly SI variation and probability distribution function of SPRINT and GluControl with a 1–2 h measurement interval. The trends are very similar at most SI values, with differences at very low insulin sensitivity (SI) due to lower numbers of data points in the GluControl cohort, per Figures 5 and 6.
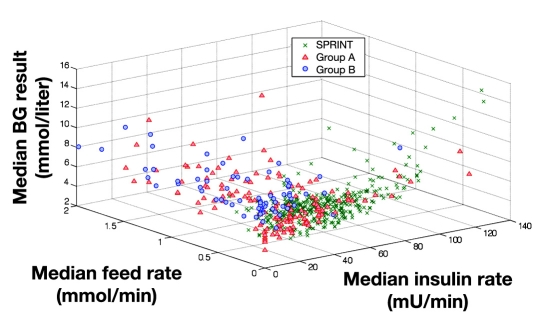
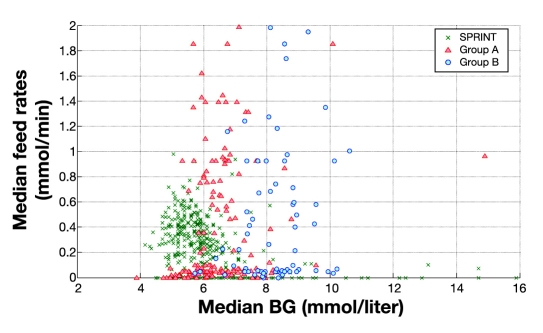
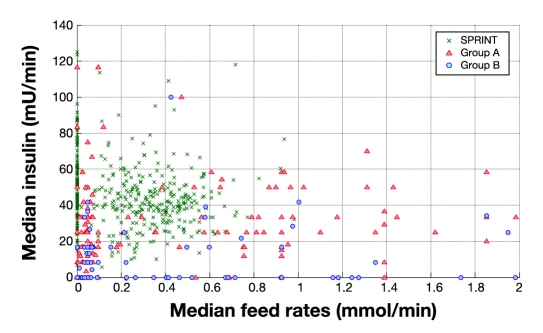
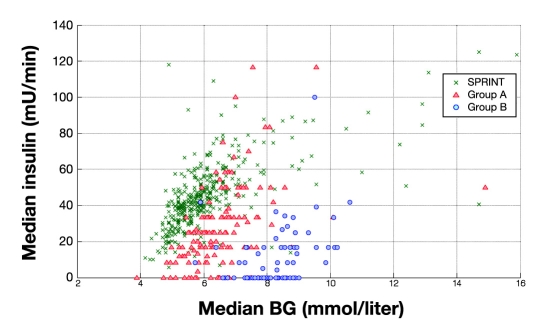
Figure 10 summarizes the control and metabolic balance delivered by the protocols between carbohydrate administration, insulin administration, and resulting glucose levels. It uses three-dimensional plots of median blood glucose, median insulin dose, and median carbohydrate administration rates for every patient in all three cohorts. For clarity, Figures 11–13 show the decomposition of this three-dimensional plot into two of the dimensions for each parameter. It is clear in Figures 11–13 that the SPRINT data and glycemic outcomes are far less variable and/or more tightly controlled. This result is particularly valid with respect to the median nutrition rate and carbohydrate content versus outcome median blood glucose. In Figure 11, both groups had zero feed rates at some portions for very short staying patients. In SPRINT, some patients were not fed, which corresponds to ∼1–2% of hours with no feed rate as shown in Figure 4. Overall, these plots show the metabolic balance achieved for each patient between insulin and carbohydrate inputs and the resulting glycemic outcome. They also clearly show the outlying patients with unbalanced and/or extreme insulin and nutrition inputs resulting in poor(er) glycemic control to the desired target.
Figure 10.
Three-dimensional plot of median insulin rate, median feed rates, and median blood glucose for SPRINT and GluControl (group A and group B). BG, blood glucose.
Figure 11.
Distribution of median feed rates (all sources) versus median blood glucose measured for SPRINT and GluControl (group A and group B). BG, blood glucose.
Figure 13.
Distribution of median insulin against median feed rates (all sources) for SPRINT and GluControl (group A and group B).
Figure 12.
Distribution of median insulin versus median blood glucose measured for SPRINT and GluControl (group A and group B). BG, blood glucose.
While this study does not directly examine mortality outcomes, the range of carbohydrate administration between all of GluControl and SPRINT was examined. Median carbohydrate administration rate (per patient) was not associated with mortality in SPRINT (p = .82). However, there was a strong association with mortality in the overall GluControl cohort (p = .03).
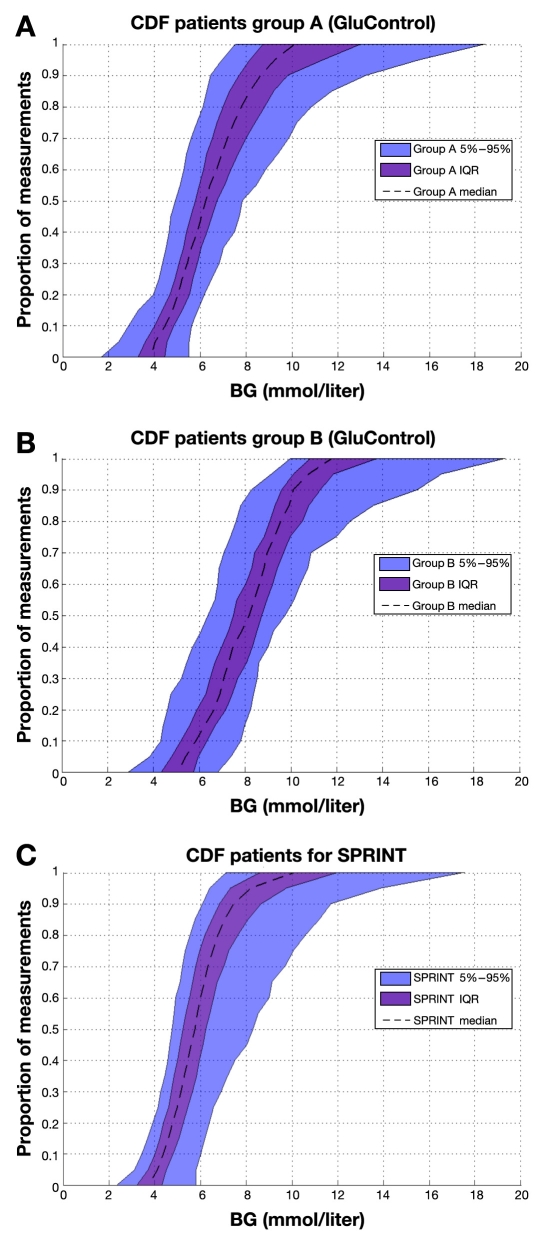
Finally, Figure 14 illustrates the interpatient variability in the resulting glycemic outcome(s). The per-patient CDFs shown reveal a tighter result across patients, particularly over the 25th to 75th percentile IQR patients, for the SPRINT protocol, despite the differences or variability noted in prior results. The same lower variability seen for SPRINT over the cohort (steeper CDF in Figure 2) is also evident for all percentile patients in Figure 14, in comparison to the GluControl cohorts shown in Figure 14.
Figure 14.
Empirical CDFs per patient of measured blood glucose on (A) group A of GluControl, (B) group B of GluControl, and (C) SPRINT. Curves show the 5th, 25th, 50th (median), 75th, and 95th percentile patient responses, and shaded areas show the resulting IQR and 90% CI range. All x and y axes have the same scale. BG, blood glucose.
Discussion
Specialized Relative Insulin Nutrition Titration achieved tighter control than GluControl A or B (for the one center examined) around their respective target glycemic levels, as clearly seen in Figure 5. The steeper CDFs indicate the lower, by cohort, glycemic variability. Importantly, the GluControl CDFs are very similar but (primarily) shifted to their respective target glucose levels, resulting in higher hypoglycemia for the group A cohort with the lower target. This result is reinforced by the steeper and less variable per-patient CDFs for the middle 50% of patients (IQR) in each cohort shown in Figure 14, which thus indicates the ability of each protocol to manage interpatient variability.
The higher incidence of hypoglycemia for lower percentile patients is clearer in Figure 14. In particular, it indicates that the intensive GluControl A protocol could not effectively account for the inter- and intrapatient variability in metabolic behavior seen in Figures 5–8, despite the wider range of (median) insulin and nutrition inputs used, as shown in Figures 10–13. Hence, some GluControl A patients were simply controlled by the protocol to too low of a glycemic level, resulting in increased risk of hypoglycemia, which has been commonly reported in other studies (e.g., References 19, 22, and 46).
This outcome clearly indicates that the group A GluControl protocol was not able to fully account for differences between patients or/and intrapatient variability. This outcome was reinforced by the cohort and per-patient results in Table 3, which show cohort IQR ranges for glycemic outcomes are much wider in this group than in the similarly targeted SPRINT case. As a result, SPRINT also had far less hypoglycemia.
In terms of providing nutrition and insulin, SPRINT has a higher proportion of patients receiving, on average, more insulin than group A and more consistently as well for group B (less zero values on the CDF in Figure 3). In current thinking,22,46–48 this increased insulin usage should have resulted in similar or greater hypoglycemia, which was not the case here. However, SPRINT patients also received a more consistent input of carbohydrate administration from all sources compared to GluControl groups A and B, as seen in the relatively very steep CDFs for SPRINT in Figure 4 with virtually no zero values. Considering the carbohydrate intake, note that all sources of carbohydrate includes enteral and parenteral nutrition and intravenous dextrose. This difference in CDFs is critical given that the median and average values are similar across all three cohorts. However, per-patient results for all three cohorts show that the spread of carbohydrate administration rates was much tighter for SPRINT than for either group A or group B by a factor of almost 4x for median rates across patients, as seen in Table 2.
Importantly, while Figure 11 shows that some SPRINT patients did have median zero feed rates, the work of Krishnan and associates26 shows that 33–66% of the ACCP guidelines are more optimal rates of carbohydrate administration with respect to mortality outcome. The SPRINT data are thus clustered almost entirely in this range in Figure 4. In contrast, the greater spread in GluControl data is due to not controlling this variable and local clinical practice for that patient cohort. Hence, it may not be unexpected that there was no correlation between mortality and median per-patient carbohydrate administration in SPRINT but that it was significant considering all GluControl patients.
These results indicate that the higher insulin usage combined with consistent, tightly managed carbohydrate input was balanced in the SPRINT protocol, resulting in less glycemic variation and, for similar target glucose, less hypoglycemia. More specifically, the SPRINT protocol interventions were both more consistent and, within their tighter range, better able to manage the inter- and intrapatient variation in their cohort. Overall, hypoglycemia and tight control are, as might be expected, explicit functions of the nutrition and insulin dosing, leading to the conclusion that explicit knowledge of carbohydrate intake must be accounted for (if not explicitly controlled) in successful TGC, which is a result reported in independent studies.49 In particular, without this information, it will be far more difficult to strike a safe, long-term, consistently achieved glycemic balance.
Thus variability and/or inconsistency in insulin and nutritional carbohydrate inputs are one source of glycemic variability. A second major source would be the metabolic inter- and intrapatient variability, all else equal, of the cohort, where a more variable cohort would potentially be expected to have a more variable glycemic outcome. Figures 5 and 6 clearly show that the GluControl cohorts span a wider range of insulin sensitivity than the SPRINT cohort with more interpatient variability. However, their hour-to-hour variation can significantly affect the level of glycemic control, especially in cases with less frequent measurement, where small evolutions over several hours can result in large changes in metabolic status and glycemic outcome for a constant infusion of insulin and nutrition. Hourly changes are the same for both GluControl and SPRINT given the similar plots in Figure 9, where one-hour variations may be considered significant with respect to glycemic control and interventions when outside a 15% change from the prior hour.38,50 However, interestingly, Figures 7–9 show very similar results between the cohorts for this intrapatient variability. Note that, while not shown, recreating Figure 9 separating groups A and B yields the same result. Hence, while insulin sensitivity distributions were different between the SPRINT and GluControl cohorts, their hour-to-hour variability is very similar, which is an unexpected result and indicates a more universal behavior may be evident.
Two conclusions may be drawn from this result. First, any protocol must be able to adapt to a given patient's specific level of insulin resistance and its changes over time, thus accounting for inter- and intrapatient variability. It is clear that GluControl was potentially unable to manage one or both of these aspects, as per-patient glycemic outcomes in Figure 14 were similarly shaped (in CDF) across group A and group B, with a simple shift due to the different glycemic targets. Second, to control glycemic levels better, carbohydrate administration must be explicitly accounted for in the protocol design and implementation, which enables assessment or estimation of effective insulin sensitivity in real time in response to interventions. In particular, this data would allow protocols to adapt their inputs to match gradual or acute changes in a patient's metabolic status (insulin resistance or insulin sensitivity, SI), which is what SPRINT effectively does,13,24 and thus to provide potentially tighter control and more consistent care.
This last point may be critical when considering GluControl and other multicenter trials. GluControl,20 NICE-SUGAR,29 and Efficacy of Volume Substitution and Insulin Therapy in Severe Sepsis (VISEP)51 were all multicenter trials that reported increased hypoglycemia with tighter/lower glycemic target groups, as well as failing to show benefit from TGC. In these studies, nutritional inputs were (largely) left to local standards of care, which can be quite variable both between centers and between clinicians in a center. As seen in these results, the level of hypoglycemia for GluControl group A at CHU of Liege was still lower than the ∼12% by patient level that stopped the multicenter VISEP trial. Thus it might be concluded that the variation of nutrition across centers in that trial resulted in even further variation in glycemic outcome for the fixed insulin delivery protocols used (all else equal). Hence, the result for intensively controlled group A would have been even further hypoglycemia and even more variable control around the target level when run over multiple centers, as was indeed the case in the final multicenter report,29 with 8.7% of patients experiencing hypoglycemia for group A versus 7.7% in insulin-treated group A cohort examined here from the single GluControl pilot study center. Certainly, this variability in nutrition input (alone) is evident in Figure 11, where median input rates span a very wide range. In contrast, explicit protocol knowledge of carbohydrate administration has, in both cases it has been used,13,23 resulted in tighter control with minimal hypoglycemia.
One potential limitation of this study is that it uses a model-based metric of insulin sensitivity (SI) to assess inter- and intrapatient variability. Thus, it should be noted that all cohorts studied here have measurable numbers of patients with diagnosed and/or undiagnosed type 2 diabetes mellitus (T2DM). However, the difference in insulin resistance between T2DM individuals and otherwise normal individuals are small in hyperglycemic critical care patients. In particular, noncritically ill T2DM individuals have an insulin sensitivity of SI = 1.0 – 2.0e – 3 (liter/mU/min) in insulin sensitivity tests using this model.44,45 This range of values covers only a very few patients or hours in Figures 5–7 for the least resistant (most sensitive). The typical critically ill patient, with or without T2DM, has a significantly counter-regulated metabolic system that drives effective insulin resistance, as measured by this clinically validated model, to values well below an otherwise healthy T2DM individual. Thus, there is little impact expected on the overall glycemic outcomes and this analysis due to a subset of patients with this diagnosis. In SPRINT in particular, there were no differences in glycemic or mortality outcome for diabetic individuals.
Finally, it should be noted that the GluControl data examined here was only from one center (CHU de Liege, Belgium), where the protocol was piloted. While the glycemic outcomes of the two protocols in this subset are similar to those over the study, it should be noted that these results could potentially differ if the full 21-center study data set were considered. However, the overall goal of this article was to examine differences in glycemic control outcomes and the associated control inputs to define aspects that can result in greater success or difficulty in obtaining TGC. In that context, the study presented is valid, and a further analysis using the full data set, when available, might better define these results as well as characterize where variability across centers, within a given protocol, had positive and negative effects on TGC.
More importantly, from this study, it can be evaluated that clear guidelines for nutrition intake of carbohydrate are essential in TGC protocol regardless of the nutritional standards and practices across different countries. In addition, considering frequent and convenient measurement, future protocols should also consider bedside glucose monitoring systems for reduced clinical effort and better control. For future studies, comparison of protocols that achieve a high level of compliance should be evaluated.
Conclusions
Three main conclusions may be drawn from this analysis:
Successful TGC protocols must be able to account for the significant interpatient and intrapatient variability in insulin resistance (sensitivity) that can be observed in critically ill cohorts.
-
Explicit knowledge of—and potentially control of—carbohydrate administration within reasonable limits reported in literature appears to be a mandatory component in reducing outcome glycemic variability and thus, potentially, in achieving all the benefits of TGC with minimal risk. It is a factor that is missing from many of the published protocols to date.
Limits to nonsaturable ranges of insulin infusion or intervention of 0–8 U/h would also limit the changes seen in glycemia when intrapatient variability is high.
While interpatient variability in insulin sensitivity can be quite different between cohorts that are otherwise similar in severity of illness, the evolution and dynamic change or intrapatient variability of this parameter appears to be very similar across (at least) the cohorts studied here.
All these main conclusions remain to be prospectively tested. However, this analysis highlights key aspects of TGC trials and data that can be used in developing improved protocols, as well as used for retrospective analysis and comparisons that may have been previously overlooked.
Abbreviations
- ACCP
American College of Chest Physicians
- APACHE II
Acute Physiology and Chronic Health Evaluation II
- CDF
cumulative distribution function
- CHU
Centre Hospitale Universitaire
- CI
confidence interval
- VISEP
Efficacy of Volume Substitution and Insulin Therapy in Severe Sepsis
- ICU
intensive care unit
- IQR
interquartile range
- NICE-SUGAR
Normoglycemia in Intensive Care Evaluation—Survival Using Glucose Algorithm Regulation
- SPRINT
Specialized Relative Insulin Nutrition Titration
- T2DM
type 2 diabetes mellitus
- TGC
tight glycemic control
References
- 1.Capes SE, Hunt D, Malmberg K, Gerstein HC. Stress hyper-glycaemia and increased risk of death after myocardial infarction in patients with and without diabetes: a systematic overview. Lancet. 2000;355(9206):773–778. doi: 10.1016/S0140-6736(99)08415-9. [DOI] [PubMed] [Google Scholar]
- 2.Finney SJ, Zekveld C, Elia A, Evans TW. Glucose control and mortality in critically ill patients. JAMA. 2003;290(15):2041–2047. doi: 10.1001/jama.290.15.2041. [DOI] [PubMed] [Google Scholar]
- 3.Krinsley JS. Association between hyperglycemia and increased hospital mortality in a heterogeneous population of critically ill patients. Mayo Clin Proc. 2003;78(12):1471–1478. doi: 10.4065/78.12.1471. [DOI] [PubMed] [Google Scholar]
- 4.McCowen KC, Malhotra A, Bistrian BR. Stress-induced hyper-glycemia. Crit Care Clin. 2001;17(1):107–124. doi: 10.1016/s0749-0704(05)70154-8. [DOI] [PubMed] [Google Scholar]
- 5.Mizock BA. Alterations in fuel metabolism in critical illness: hyperglycaemia. Best Pract Res Clin Endocrinol Metab. 2001;15(4):533–551. doi: 10.1053/beem.2001.0168. [DOI] [PubMed] [Google Scholar]
- 6.Umpierrez GE, Isaacs SD, Bazargan N, You X, Thaler LM, Kitabchi AE. Hyperglycemia: an independent marker of in-hospital mortality in patients with undiagnosed diabetes. J Clin Endocrinol Metab. 2002;87(3):978–982. doi: 10.1210/jcem.87.3.8341. [DOI] [PubMed] [Google Scholar]
- 7.Van den Berghe G, Wouters P, Weekers F, Verwaest C, Bruyninckx F, Schetz M, Vlasselaers D, Ferdinande P, Lauwers P, Bouillon R. Intensive insulin therapy in the critically ill patients. N Engl J Med. 2001;345(19):1359–1367. doi: 10.1056/NEJMoa011300. [DOI] [PubMed] [Google Scholar]
- 8.Bistrian BR. Hyperglycemia and infection: which is the chicken and which is the egg? JPEN J Parenter Enteral Nutr. 2001;25(4):180–181. doi: 10.1177/0148607101025004180. [DOI] [PubMed] [Google Scholar]
- 9.Egi M, Bellomo R, Stachowski E, French CJ, Hart G. Variability of blood glucose concentration and short-term mortality in critically ill patients. Anesthesiology. 2006;105(2):244–252. doi: 10.1097/00000542-200608000-00006. [DOI] [PubMed] [Google Scholar]
- 10.Krinsley JS. Glycemic variability: a strong independent predictor of mortality in critically ill patients. Crit Care Med. 2008;36(11):3008–3013. doi: 10.1097/CCM.0b013e31818b38d2. [DOI] [PubMed] [Google Scholar]
- 11.Van den Berghe G, Wilmer A, Hermans G, Meersseman W, Wouters PJ, Milants I, Van Wijngaerden E, Bobbaers H, Bouillon R. Intensive insulin therapy in the medical ICU. N Engl J Med. 2006;354(5):449–461. doi: 10.1056/NEJMoa052521. [DOI] [PubMed] [Google Scholar]
- 12.Krinsley JS. Effect of an intensive glucose management protocol on the mortality of critically ill adult patients. Mayo Clin Proc. 2004;79(8):992–1000. doi: 10.4065/79.8.992. [DOI] [PubMed] [Google Scholar]
- 13.Chase JG, Shaw G, Le Compte A, Lonergan T, Willacy M, Wong XW, Lin J, Lotz T, Lee D, Hann C. Implementation and evaluation of the SPRINT protocol for tight glycaemic control in critically ill patients: a clinical practice change. Crit Care. 2008;12(2):R49. doi: 10.1186/cc6868. [DOI] [PMC free article] [PubMed] [Google Scholar]
- 14.Mackenzie I, Ingle S, Zaidi S, Buczaski S. Tight glycaemic control: a survey of intensive care practice in large English hospitals. Intensive Care Med. 2005;31(8):1136. doi: 10.1007/s00134-005-2677-2. [DOI] [PubMed] [Google Scholar]
- 15.Schultz MJ, Spronk PE, Moeniralam HS. Tight glycaemic control: a survey of intensive care practice in the Netherlands. Intensive Care Med. 2006;32(4):618–619. doi: 10.1007/s00134-006-0099-4. [DOI] [PubMed] [Google Scholar]
- 16.Gale SC, Gracias VH. Glycemic control needs a standard reference point. Crit Care Med. 2006;34(6):1856–1857. doi: 10.1097/01.CCM.0000220201.72591.43. [DOI] [PubMed] [Google Scholar]
- 17.Diringer MN. Improved outcome with aggressive treatment of hyperglycemia: hype or hope? Neurology. 2005;64(8):1330–1331. doi: 10.1212/01.WNL.0000162348.81440.BD. [DOI] [PubMed] [Google Scholar]
- 18.Bland DK, Fankhanel Y, Langford E, Lee M, Lee SW, Maloney C, Rogers M, Zimmerman G. Intensive versus modified conventional control of blood glucose level in medical intensive care patients: a pilot study. Am J Crit Care. 2005;14(5):370–376. [PubMed] [Google Scholar]
- 19.Meijering S, Corstjens AM, Tulleken JE, Meertens JH, Zijlstra JG, Ligtenberg JJ. Towards a feasible algorithm for tight glycaemic control in critically ill patients: a systematic review of the literature. Crit Care. 2006;10(1):R19. doi: 10.1186/cc3981. [DOI] [PMC free article] [PubMed] [Google Scholar]
- 20.Finfer S, Chittock DR, Su SY, Blair D, Foster D, Dhingra V, Bellomo R, Cook D, Dodek P, Henderson WR, Hébert PC, Heritier S, Heyland DK, McArthur C, McDonald E, Mitchell I, Myburgh JA, Norton R, Potter J, Robinson BG, Ronco JJ NICE-SUGAR Study Investigators. Intensive versus conventional glucose control in critically ill patients. N Engl J Med. 2009;360(13):1283–1297. doi: 10.1056/NEJMoa0810625. [DOI] [PubMed] [Google Scholar]
- 21.Chase J, Shaw GM, Wong XW, Lotz T, Lin J, Hann CE. Model-based glycaemic control in critical care: a review of the state of the possible. Biomed Sig Process Control. 2006;1(1):3–21. [Google Scholar]
- 22.Griesdale DE, de Souza RJ, van Dam RM, Heyland DK, Cook DJ, Malhotra A, Dhaliwal R, Henderson WR, Chittock DR, Finfer S, Talmor D. Intensive insulin therapy and mortality among critically ill patients: a meta-analysis including NICE-SUGAR study data. CMAJ. 2009;180(8):821–827. doi: 10.1503/cmaj.090206. [DOI] [PMC free article] [PubMed] [Google Scholar]
- 23.Plank J, Blaha J, Cordingley J, Wilinska ME, Chassin LJ, Morgan C, Squire S, Haluzik M, Kremen J, Svacina S, Toller W, Plasnik A, Ellmerer M, Hovorka R, Pieber TR. Multicentric, randomized, controlled trial to evaluate blood glucose control by the model predictive control algorithm versus routine glucose management protocols in intensive care unit patients. Diabetes Care. 2006;29(2):271–276. doi: 10.2337/diacare.29.02.06.dc05-1689. [DOI] [PubMed] [Google Scholar]
- 24.Lonergan T, LeCompte A, Willacy M, Chase JG, Shaw GM, Wong XW, Lotz T, Lin J, Hann CE. A simple insulin-nutrition protocol for tight glycemic control in critical illness: development and protocol comparison. Diabetes Technol Ther. 2006;8(2):191–206. doi: 10.1089/dia.2006.8.191. [DOI] [PubMed] [Google Scholar]
- 25.Lonergan T, Compte AL, Willacy M, Chase JG, Shaw GM, Hann CE, Lotz T, Lin J, Wong XW. A pilot study of the SPRINT protocol for tight glycemic control in critically ill patients. Diabetes Technol Ther. 2006;8(4):449–462. doi: 10.1089/dia.2006.8.449. [DOI] [PubMed] [Google Scholar]
- 26.Krishnan JA, Parce PB, Martinez A, Diette GB, Brower RG. Caloric intake in medical ICU patients: consistency of care with guidelines and relationship to clinical outcomes. Chest. 2003;124(1):297–305. doi: 10.1378/chest.124.1.297. [DOI] [PubMed] [Google Scholar]
- 27.Cerra FB, Benitez MR, Blackburn GL, Irwin RS, Jeejeebhoy K, Katz DP, Pingleton SK, Pomposelli J, Rombeau JL, Shronts E, Wolfe RR, Zaloga GP. Applied nutrition in ICU patients. A consensus statement of the American College of Chest Physicians. Chest. 1997;111(3):769–778. doi: 10.1378/chest.111.3.769. [DOI] [PubMed] [Google Scholar]
- 28.Biolo G, Grimble G, Preiser JC, Leverve X, Jolliet P, Planas M, Roth E, Wernerman J, Pichard C European Society of Intensive Care Medicine Working Group on Nutrition Metabolism. Position paper of the ESICM Working Group on Nutrition and Metabolism. Metabolic basis of nutrition in intensive care unit patients: ten critical questions. Intensive Care Med. 2002;28(11):1512–1520. doi: 10.1007/s00134-002-1512-2. [DOI] [PubMed] [Google Scholar]
- 29.Preiser JC, Devos P, Ruiz-Santana S, Mélot C, Annane D, Groeneveld J, Iapichino G, Leverve X, Nitenberg G, Singer P, Wernerman J, Joannidis M, Stecher A, Chioléro R. A prospective randomised multi-centre controlled trial on tight glucose control by intensive insulin therapy in adult intensive care units: the GluControl study. Intensive Care Med. 2009;35(10):1738–1748. doi: 10.1007/s00134-009-1585-2. [DOI] [PubMed] [Google Scholar]
- 30.Wong XW, Singh-Levett I, Hollingsworth LJ, Shaw GM, Hann CE, Lotz T, Lin J, Wong OS, Chase JG. A novel, model-based insulin and nutrition delivery controller for glycemic regulation in critically ill patients. Diabetes Technol Ther. 2006;8(2):174–190. doi: 10.1089/dia.2006.8.174. [DOI] [PubMed] [Google Scholar]
- 31.Chase JG, Shaw GM, Lotz T, LeCompte A, Wong J, Lin J, Lonergan T, Willacy M, Hann CE. Model-based insulin and nutrition administration for tight glycaemic control in critical care. Curr Drug Deliv. 2007;4(4):283–296. doi: 10.2174/156720107782151223. [DOI] [PubMed] [Google Scholar]
- 32.Chase JG, Shaw GM, Lin J, Doran CV, Bloomfield M, Wake GC, Broughton B, Hann C, Lotz T. Impact of insulin-stimulated glucose removal saturation on dynamic modelling and control of hyper-glycaemia. Int J Intel Syst Technol Appl. 2005;1(1-2):79–94. [Google Scholar]
- 33.Chase JG, Shaw GM, Lin J, Doran CV, Hann C, Lotz T, Wake GC, Broughton B. Targeted glycemic reduction in critical care using closed-loop control. Diabetes Technol Ther. 2005;7(2):274–282. doi: 10.1089/dia.2005.7.274. [DOI] [PubMed] [Google Scholar]
- 34.Natali A, Gastaldelli A, Camastra S, Sironi AM, Toschi E, Masoni A, Ferrannini E, Mari A. Dose-response characteristics of insulin action on glucose metabolism: a non-steady-state approach. Am J Physiol Endocrinol Metab. 2000;278(5):E794–801. doi: 10.1152/ajpendo.2000.278.5.E794. [DOI] [PubMed] [Google Scholar]
- 35.Prigeon RL, Røder ME, Porte D, Jr, Kahn SE. The effect of insulin dose on the measurement of insulin sensitivity by the minimal model technique. Evidence for saturable insulin transport in humans. J Clin Invest. 1996;97(2):501–507. doi: 10.1172/JCI118441. [DOI] [PMC free article] [PubMed] [Google Scholar]
- 36.Wong XW, Chase JG, Shaw GM, Hann CE, Lotz T, Lin J, Singh-Levett I, Hollingsworth LJ, Wong OS, Andreassen S. Model predictive glycaemic regulation in critical illness using insulin and nutrition input: a pilot study. Med Eng Phys. 2006;28(7):665–681. doi: 10.1016/j.medengphy.2005.10.015. [DOI] [PubMed] [Google Scholar]
- 37.Lin J, Lee DS, Chase JG, Hann CE, Lotz T, Wong XW. Stochastic modelling of insulin sensitivity variability in critical care. Biomed Signal Processing Control. 2006;1(3):229–242. [Google Scholar]
- 38.Lin J, Lee D, Chase JG, Shaw GM, Le Compte A, Lotz T, Wong J, Lonergan T, Hann CE. Stochastic modelling of insulin sensitivity and adaptive glycemic control for critical care. Comput Methods Programs Biomed. 2008;89(2):141–152. doi: 10.1016/j.cmpb.2007.04.006. [DOI] [PubMed] [Google Scholar]
- 39.Hann CE, Chase JG, Lin J, Lotz T, Doran CV, Shaw GM. Integral-based parameter identification for long-term dynamic verification of a glucose-insulin system model. Comput Methods Programs Biomed. 2005;77(3):259–270. doi: 10.1016/j.cmpb.2004.10.006. [DOI] [PubMed] [Google Scholar]
- 40.Hann CE, Chase JG, Ypma MF, Elfring J, Mohd Nor N, Lawrence P, Shaw GM. The impact of parameter identification methods on drug therapy control in an intensive care unit. Open Med Inform J. 2008;2:92–104. doi: 10.2174/1874431100802010092. [DOI] [PMC free article] [PubMed] [Google Scholar]
- 41.Chase JG, Shaw GM, Lin J, Doran CV, Hann C, Robertson MB, Browne PM, Lotz T, Wake GC, Broughton B. Adaptive bolus-based targeted glucose regulation of hyperglycaemia in critical care. Med Eng Phys. 2005;27(1):1–11. doi: 10.1016/j.medengphy.2004.08.006. [DOI] [PubMed] [Google Scholar]
- 42.LeCompte A, Chase JG, Lynn A, Hann C, Shaw G, Wong XW, Lin J. Blood glucose controller for neonatal intensive care: virtual trials development and first clinical trials. J Diabetes Sci Technol. 2009;3(5):1066–1081. doi: 10.1177/193229680900300510. [DOI] [PMC free article] [PubMed] [Google Scholar]
- 43.Lotz TF, Chase JG, McAuley KA, Lee DS, Lin J, Hann CE, Mann JI. Transient and steady-state euglycemic clamp validation of a model for glycemic control and insulin sensitivity testing. Diabetes Technol Ther. 2006;8(3):338–346. doi: 10.1089/dia.2006.8.338. [DOI] [PubMed] [Google Scholar]
- 44.Lotz T. High resolution clinical model-based assessment of insulin sensitivity. Thesis. Christchurch: University of Canterbury; 2007. [Google Scholar]
- 45.Lotz TF, Chase JG, McAuley KA, Shaw GM, Wong XW, Lin J, Lecompte A, Hann CE, Mann JI. Monte Carlo analysis of a new model-based method for insulin sensitivity testing. Comput Methods Programs Biomed. 2008;89(3):215–225. doi: 10.1016/j.cmpb.2007.03.007. [DOI] [PubMed] [Google Scholar]
- 46.Treggiari MM, Karir V, Yanez ND, Weiss NS, Daniel S, Deem SA. Intensive insulin therapy and mortality in critically ill patients. Crit Care. 2008;12(1):R29. doi: 10.1186/cc6807. [DOI] [PMC free article] [PubMed] [Google Scholar]
- 47.Vriesendorp TM, van Santen S, DeVries JH, de Jonge E, Rosendaal FR, Schultz MJ, Hoekstra JB. Predisposing factors for hypoglycemia in the intensive care unit. Crit Care Med. 2006;34(1):96–101. doi: 10.1097/01.ccm.0000194536.89694.06. [DOI] [PubMed] [Google Scholar]
- 48.Preiser JC, Devos P. Clinical experience with tight glucose control by intensive insulin therapy. Crit Care Med. 2007;35(9 Suppl):S503–507. doi: 10.1097/01.CCM.0000278046.24345.C7. [DOI] [PubMed] [Google Scholar]
- 49.Elia M, De Silva A. Tight glucose control in intensive care units: an update with an emphasis on nutritional issues. Curr Opin Clin Nutr Metab Care. 2008;11(4):465–470. doi: 10.1097/MCO.0b013e3282fcea2a. [DOI] [PubMed] [Google Scholar]
- 50.Chase JG, LeCompte A, Shaw G, Lin J, Pretty C, Razak N, Parente J, Lynn A, Hann C, Suhaimi F. Tight glycemic control: the leading role of insulin sensitivity in determining efficacy and thus outcome. 6th IFAC Symposium on Modeling and Control in Biomedical Systems (MCBMS09), Volume 7, part 1, 6 pages, August 12–14, 2009; Aalborg. www.ifac-papersonline.net/Detailed/39978.html. [Google Scholar]
- 51.Brunkhorst FM, Engel C, Bloos F, Meier-Hellmann A, Ragaller M, Weiler N, Moerer O, Gruendling M, Oppert M, Grond S, Olthoff D, Jaschinski U, John S, Rossaint R, Welte T, Schaefer M, Kern P, Kuhnt E, Kiehntopf M, Hartog C, Natanson C, Loeffler M, Reinhart K German Competence Network Sepsis (SepNet) Intensive insulin therapy and pentastarch resuscitation in severe sepsis. N Engl J Med. 2008;358(2):125–139. doi: 10.1056/NEJMoa070716. [DOI] [PubMed] [Google Scholar]


