

Abstract
Background
Continuous glucose monitors (CGMs) present a problem of lack of accuracy, especially in the lower range, sometimes leading to missed or false hypoglycemia. A new algorithm is presented here aimed at improving the measurement accuracy and hypoglycemia detection. Its core is the estimation of blood glucose (BG) in real time (RT) from CGM intensity readings using autoregressive (AR) models.
Methods
Eighteen patients with type 1 diabetes were monitored for three days (one at the hospital and two at home) using the CGMS® Gold. For these patients, BG samples were taken every 15 min for 2 h after meals and every half hour otherwise during the first day. The relationship between the current measured by the CGMS Gold and BG was learned by an AR model, allowing its RT estimation. New capillary glucose measurements were used to correct the model BG estimations.
Results
A total of 563 paired points were obtained from BG and monitor readings to validate the new algorithm. 98.5% of paired points fell in zones A+B of the Clarke error grid analysis with the proposed algorithm. The overall mean and median relative absolute differences (RADs) were 9.6% and 6.7%. Measurements meeting International Organization for Standardization (ISO) criteria were 88.7%. In the hypoglycemic range, the mean and median RADs were 8.1% and 6.0%, and measurements meeting ISO criteria were 86.7%. The sensitivity and specificity with respect to hypoglycemia detection were 91.5% and 95.0%.
Conclusions
The performance measured with both clinical and numerical accuracy metrics illustrates the improved accuracy of the proposed algorithm compared with values presented in the literature. A significant improvement in hypoglycemia detection was also observed.
Keywords: autoregressive model, continuous glucose monitoring, hypoglycemia, type 1 diabetes
Introduction
Continuous glucose monitors (CGMs) can improve glycemic control of patients.1 These devices have helped the management of type 1 diabetes by providing detailed information about glucose variability: direction, magnitude, duration, and frequency of hypo- or hyperglycemia.2 Additionally, the use of CGMs in patients with type 1 diabetes has shown positive effects in the reduction of the hemoglobin A1c3,4 and glucose variability.5 However, preliminary studies have concluded that there are open challenges in the research field of CGM technology: sensitivity, stability, noise, physiological time lag between blood glucose (BG) and interstitial glucose (IG), and quality of calibration.6 Conventional calibration methods in CGM devices recommend calibrating when BG is not changing very rapidly, in search of an “equilibrium” between BG and IG, but do not take into account the dynamic relationship between them (other than time lag considered as a pure delay).7–10
Previous clinical studies have concluded that the accuracy problems presented by CGMs are highly influenced by the quality of the calibration algorithms, which have several shortcomings, especially in hypoglycemia.11–13 Continuous glucose monitor recalibration techniques have been presented in CGM literature.6,9,14,15 These changes in the calibration methods have shown improvements in the accuracy of the estimated glucose by CGM. A recalibration method was applied to the CGMS® Gold using a calibration function whose input has certain variance.6 The same recalibration method was applied to the NavigatorTM (Abbott, Diabetes Care, Alameda, CA).14 A scalar recalibration parameter was estimated using linear least squares. The plasma glucose profiles were reconstructed using deconvolution techniques. In another study, a conversion algorithm that incorporates glucose and time-dependent factors has been proposed. Logarithmic transformations and multiple regression techniques were used to quantify these factors.15 In healthy persons, the mean relative absolute difference (RAD) compared to CGMS Gold algorithm was significantly reduced (20.6 ± 5.9% versus 11.6 ± 6.5%). In one study, a posteriori calibration was performed to the Navigator readings using a simple linear regression to isolate the errors due to calibration and to obtain a description of the sensor error.9
In diabetes management, autoregressive (AR) models are used as tools for short-term glucose prediction from CGM data. Several authors used AR models for the development of subject-specific glucose prediction models from CGM data.16,17 A first-order AR model, with time-varying parameters, was considered by Sparacino and colleagues.18 In a parallel work, a tenth-order AR model without parameter adjustments was developed.19 However, this model showed relatively large time lags that reduce its clinical benefits. Gani and associates used thirty-order AR models.20 They have shown that stable and accurate models for short-term glucose prediction with acceptable time lags are attained only when the raw glucose measurements are smoothed and the model coefficients are regularized.
In this study, AR models were used to estimate BG in real time (RT) from CGM intensity readings. Eighteen type 1 diabetes patients were monitored, and after some preprocessing, these data were used to train a population AR model. This model was then incorporated into a calibration algorithm to estimate BG concentrations in RT, given the sensor intensity measurements. The BG estimations of the algorithm were corrected whenever a new calibration point was entered. The capillary glucose measurements were thus used as calibration points for the proposed algorithm. In this article, profiles of the CGMS Gold, the proposed glucose estimation algorithm, and BG were compared. Results were evaluated from a numerical and clinical point accuracy,21–23 showing more accurate BG concentrations when compared with CGMS Gold and results reported in literature.
Materials and Methods
Subjects and Study Design
The study included 18 patients with type 1 diabetes according to American Diabetes Association criteria (see Table 1). This study followed the protocol approved by the Dr. Josep Trueta University Hospital of Girona's Ethics Committee. Patients were monitored for three days (one day at the hospital and two days at home) using the CGMS Gold (MiniMed CGMS MMT-7102). The CGMS Gold was applied to the subcutaneous abdominal region of each patient and was used continuously for a period of 72 h. After the third day, the monitor data were downloaded to a computer using the CGMS Gold algorithm (Solutions Software 3.0). The CGMS Gold was calibrated with capillary glucose measurements using conventional self-measurement of BG. These calibrations were taken according to the CGMS Gold manufacturer's instructions24 (at least three calibration readings each day for optimal accuracy determination purposes) and the standard hospital procedure. Blood glucose data were determined through blood tests by means of a Glucose Analyzer II (Beckman Instruments, Brea, CA) on the first day at the hospital and taken every 15 min for 2 h after each meal and every 30 min otherwise. Only data obtained during the first day were used in the analysis, since no gold standard measurements were available for the rest of data. The CGMS Gold uses a retrospective calibration algorithm. The CGMS Gold algorithm does not give RT values; it estimates each glucose value incorporating both future and previous data points. This algorithm considered that IG lagged BG by 10 min.
Table 1.
Clinical Characteristics of All Subjects Included in the Study
| Number | 18 |
| Gender (F/M) | 8/10 |
| Age (years) | 28 ± 5.6 |
| Weight (kg) | 71.8 ± 12.9 |
| Body mass index (kg/m 2) | 24.3 ± 2.9 |
| Systolic blood pressure (mmHg) | 123.4 ± 12.7 |
| Diastolic blood pressure (mmHg) | 69.4 ± 9.6 |
| Total cholesterol (mg/dl) | 189.5 ± 35.3 |
| Triglycerides (mg/dl) | 114.8 ± 82.1 |
| High-density lipoprotein cholesterol (mg/dl) | 65.4 ± 15.9 |
| Low-density lipoprotein cholesterol (mg/dl) | 100.1 ± 30.4 |
| Duration of diabetes (years) | 14.6 ± 5.7 |
| Hemoglobin A1c (%) | 8.8 ± 2.1 |
A total of 563 BG readings were obtained from all patients who finished the experiment, but 14 out of the original 563 samples were excluded because they are extreme outliers caused by errors in measurement. Identification of outliers was based on the box plot criteria25 and corresponded to points above the third quartile plus three times the interquartile range. All extreme outliers were caused by errors in the measurement of BG; however, in some cases, these values were below 30 mg/dl (not clinically acceptable), and in other cases, they were due to human error. Finally, a total of 549 samples were obtained (83 below 71 mg/dl, 281 between 71 and 180 mg/dl, and 185 above 180 mg/dl). Blood glucose measurements were interpolated using a cubic method26,27 every 5 min (sampled period of CGMS Gold readings). A total of 2206 paired points were obtained (365 below 71 mg/dl, 1092 between 71 and 180 mg/dl, and 749 above 180 mg/dl). Because BG and CGMS Gold readings were obtained at different times, CGMS Gold readings were matched to the reference BG within ±2.5 min.28
Model Training: Identification of Model Parameters
Autoregressive models29 were developed using the patient's first-day CGMS Gold data. CGMS Gold intensity (I) measured in nanoampere was considered as an independent process variable (input), whereas BG measured in mg/dl was considered as a dependent process variable (output). Blood glucose and I were normalized dividing by 400 mg/dl and 100 nA, respectively, and these values were named BGN and IN, respectively. These values were chosen based on the maximum range of values of the available signals.24
Time-domain parameter estimation methods were used for the identification. The platform used was the MATLAB (Natick, MA) System Identification Toolbox.30 A leave-two-out cross-validation strategy was used. Patients' data were partitioned into two sets: training set (consists of 16 patients) and validation set (consists of the 2 patients excluded) and a population model derived. The procedure was repeated for different data partitions (iteration). Four parametric model structures were tested at each iteration. The model structures29 used were AR exogenous input, AR moving average exogenous input, Box–Jenkins (BJ), and output error. These structures were tested considering all possible model order combinations (denoted as na, nb, nc, nd, and nf) from 1 to 8. All models obtained from these structures were validated using their corresponding validation set. The metric used to quantify the models' estimations accuracy was the best fit value in Equation (1):
| (1) |
The best fit corresponds to the percentage of the output that the model reproduces, where BGN is the vector of measured BG values, GE is the vector of the corresponding BG estimations, and is the mean of BGN.
The results of the best fit indicate that the structure of lowest order that best describes the dynamics of the system is a third-order BJ model (nb = nc= nd = nf = 3) with a sampling rate of 5 min. The BJ model in Equation (2) is a structure in which an output signal y(t), in this case the glucose estimation at discrete time t, is described as a linear combination of previously observed signals, where the deterministic component [input u(t)], denoted by B(q–1) and F(q–1), and stochastic component [input e(t)], denoted by C(q–1) and D(q–1), do not share coefficients:
| (2) |
| (3) |
| (4) |
| (5) |
| (6) |
B(q–1), F(q–1), C(q–1), and D(q–1) denote AR polynomials of third-order in Equations (3) through (6). Parameters bi, fi, ci, and di are unknown and are identified by using the patients' data. q–1 is the backward shift operator that transforms a current observation to a previous one [q–ky(t) = y(t–k)], where y(t–k) is the measurement k time units before the current time t.
All the 153 possible partitions of the leave-two-out cross-validation strategy were tested, but using only the third-order BJ model, and coefficients of 153 models were obtained. Coefficients of the proposed final model were computed as the average. Five of the models were discarded in this computation because they were unstable, and the rest were used to estimate the final model parameters.
The proposed model thus has fixed population parameters (see Table 2) and is defined by Equation (7). G(t) represents the model BG estimations, IN(t) is the normalized CGMS Gold intensity, and e(t) represents a white Gaussian noise source with zero mean and with an arbitrarily small variance λ = 3.37 × 10⁻¹¹mg/dl.20
Table 2.
Box–Jenkins Model Parameters
| Model polynomials | Polynomials parameters | ||
|---|---|---|---|
| B | b0 | b1 | b2 |
| 1.465452 | −1.786699 | 0.334811 | |
| F | f1 | f2 | f3 |
| −1.204988 | 0.188096 | 0.024471 | |
| C | c1 | c2 | c3 |
| −0.137914 | −0.010064 | 0.008919 | |
| D | d1 | d2 | d3 |
| −1.605645 | 0.700240 | −0.083482 | |
| (7) |
Proposed Real-Time Glucose Estimation Algorithm
The population AR model obtained was used to develop an algorithm to estimate glucose in RT, defined as G(t) (mg/dl), from CGM intensity readings.
The input of the RT glucose estimation algorithm is IN(t). The same capillary glucose measurements used to calibrate the CGMS Gold were used as calibration points for the proposed algorithm. These calibration points were also normalized dividing by 400 mg/dl and defined as GC(t). Initially (t = 0), G(t) is the value of the first calibration point and is computed considering G(t) = G(t – 1) = G(t – 2) = GC(t) and IN(t) = IN(t – 1) = IN(t – 2). For the next sample, G(t + 1) is estimated using the proposed model in Equation (7). Because it is a third-order model, the RT glucose estimation algorithm requires the three previous samples of G(t + 1) and the two previous samples of IN (t + 1).
Whenever a new capillary measure is entered, the RT glucose estimation algorithm replaces G(t) by GC(t). Additionally, the two previous instances G(t – 1) and G (t – 2) are also set to this new value. This consideration is used to avoid drastic differences between the calibration point and the model estimation. Finally, G(t) is returned to its original range by multiplying it by 400.
Results
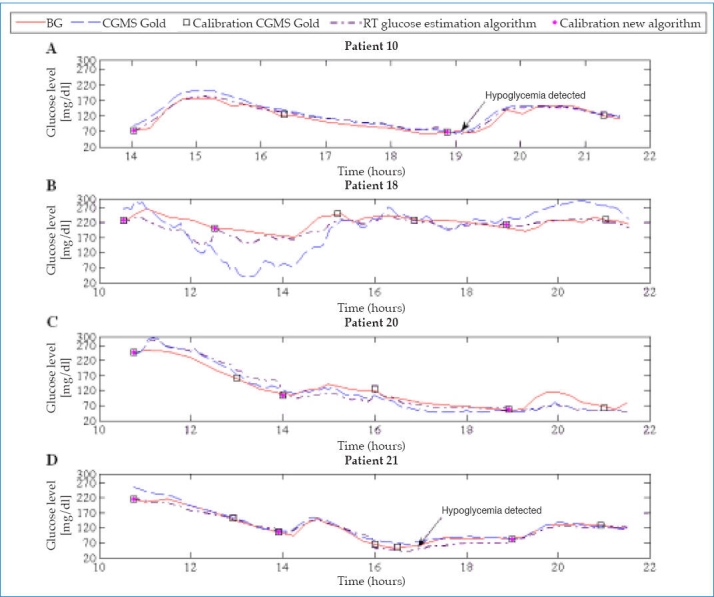
Figure 1 shows the results for four representative patients.
Figure 1.
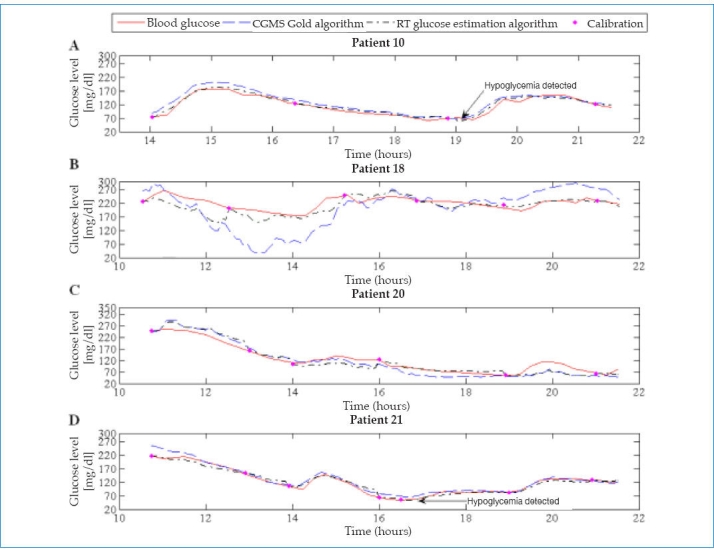
Representation of glucose profiles.
The original 549 BG readings obtained during the first day were used in the validation since no gold standard measurement was available for the rest of the data. Blood glucose readings were used as reference values and were paired with the glucose readings estimated by both algorithms (CGMS Gold and RT glucose estimation algorithm).
Assessment Considering Numerical Point Accuracy
The U.S. Food and Drug Administration currently accepted accuracy criteria for CGM statistics are the Pearson correlation coefficient (r), the mean and median RADs, and the International Organization for Standardization (ISO) criteria. These criteria were thus used to evaluate the numerical point accuracy for each patient.
The r obtained with the RT glucose estimation algorithm was 0.96. Paired points in agreement within ±20% or 30% were assessed for readings over 70 mg/dl. Glucose readings lower or equal than 70 mg/dl were assessed within 20 mg/dl (see Table 3).
Table 3.
Numerical Point Accuracy of the Real-Time Glucose Estimation Algorithm and the CGMS Gold Algorithm at Different Glucose Ranges
| Reference glucose (mg/dl) | Total reference readings | Mean RAD (standard deviation) (%) | Median RAD (%) | ISO Criteria (%) | within ± 20 mg/dl (%) | within ± 20% (%) | within ± 30% (%) | ||||||
|---|---|---|---|---|---|---|---|---|---|---|---|---|---|
| RT glucose estimation algorithm | CGMS Gold algorithm | RT glucose estimation algorithm | CGMS Gold algorithm | RT glucose estimation algorithm | CGMS Gold algorithm | RT glucose estimation algorithm | CGMS Gold algorithm | RT glucose estimation algorithm | CGMS Gold algorithm | RT glucose estimation algorithm | CGMS Gold algorithm | ||
| Overall | 549 | 9.6 ± (9.6) | 17.6 ±(18.6) | 6.7 | 11.3 | 88.7 | 73.0 | 86.7 | 70.3 | 96.0 | 81.8 | ||
| ≤ 70a | 83 | 8.1 ± (7 6) | 18.0 ±(12.6) | 6.0 | 15.0 | 86.7 | 55.4 | 95.2 | 66.3 | ||||
| 71–140 | 197 | 10.2 ± (10.3) | 16.1 ± (14.1) | 6.9 | 11.1 | 83.2 | 69.0 | 83.2 | 69.0 | 95.4 | 82.7 | ||
| 141–180 | 84 | 7.9 ± (7 9) | 12.7 ±(12.2) | 5.5 | 9.0 | 90.5 | 82.1 | 90.5 | 82.1 | 96.4 | 88.1 | ||
| 181–240 | 104 | 7.4 ± (6 5) | 15.6 ±(15 5) | 5.3 | 11.1 | 94.2 | 74.0 | 94.2 | 74.0 | 99.0 | 83.7 | ||
| >240 | 81 | 7.5 ± (6 0) | 10.5 ± (8.2) | 6.6 | 8.7 | 95.1 | 90.1 | 95.1 | 90.1 | 100.0 | 93.8 | ||
Mean and median RADs in the ≤ 70 mg/dl range, reported as mg/dl error.38
Table 3 shows the overall mean and median RADs for all patients. Comparing the CGMS Gold results and those obtained with the proposed algorithm (mean RAD = 17.6% versus 9.6%, p <.05, and median RAD = 11.3% versus 6.7%), reductions of 45% and 41% in the overall mean and median RADs, respectively, were achieved. Compared to other accuracy studies previously reported in the literature, results presented in this work show lower numerical accuracy metrics. Weinstein and coworkers31 reported mean and median RADs of 12.6% and 9.4%, respectively, for the Navigator. Mazze and colleagues32 reported mean and median RADs of 19.9% and 16.9%, respectively, for the Guardian REAL-Time (Minimed, Northridge, CA) and 16.7% and 14.2%, respectively, for the DexCom STS (DexCom, San Diego, CA). The RT glucose estimation algorithm also was assessed using ISO criteria, the measurements meeting ISO criteria were increased by 21.5% with respect to CGMS Gold.
The numerical point accuracy was also calculated by glucose ranges. Table 3 shows that the numerical point accuracy of the proposed algorithm was lowest during euglycemic range (71–140 mg/dl).
In the hypoglycemic range (see Table 3), when comparing the CGMS Gold and the proposed methodology results, reductions of 55% and 60% in the overall mean and median RADs were achieved, respectively. Moreover, lower numerical accuracy metrics with respect to previous accuracy studies were obtained. Weinstein et al.31 reported mean and median RADs of 19.8% and 15.4%, respectively, for the Navigator. Kovatchev and associates33 reported mean and median RADs of 16.1% and 13.8%, respectively, for the Guardian REAL-Time; 21.5% and 22.5%, respectively, for the DexCom STS; and 10.3% and 7.4%, respectively, for the Navigator. The ISO criteria for the Guardian REAL-Time, DexCom, and Navigator were 76.5%, 52.9%, and 79.4%, respectively.
Assessment Considering Clinical Point Accuracy: Clarke Error Grid Analysis and Consensus Error Grid Analysis
The Clarke error grid analysis (EGA) and the consensus EGA have been used to assess the clinical point accuracy of the RT glucose estimation algorithm using BG as a reference (see Table 4). Continuous glucose error grid analysis34 was not used here due to the insufficient sampling time of the data used in this work. Results showed that 98.5% of paired points in the overall patient population fell in zones A+B of the Clarke EGA, while 99.0% of paired points fell in these zones for the consensus EGA. Figure 2 shows the classification of data using the Clarke EGA and the consensus EGA. Compared with the CGMS Gold, the methodology presented higher clinical accuracy metrics (see Table 4). With respect to studies of clinical accuracy previously reported in the literature, the methodology reported here achieves similar clinical accuracy metrics. Mazze et al.32 reported that 93.0% of paired points fell in zones A+B of the Clarke EGA for the Guardian REAL-Time and 98.0% for the DexCom STS. Weinstein and coworkers31 reported 98.9% for the Navigator.
Table 4.
Clinical Point Accuracy of the Real-Time Glucose Estimation Algorithm and the CGMS Gold Algorithm at Different Glucose Rangesa
| Reference glucose (mg/dl) | Total reference readings | A+B (%) | A (%) | B (%) | C (%) | D (%) | E (%) | ||||||
|---|---|---|---|---|---|---|---|---|---|---|---|---|---|
| RT glucose estimation algorithm | CGMS Gold algorithm | RT glucose estimation algorithm | CGMS Gold algorithm | RT glucose estimation algorithm | CGMS Gold algorithm | RT glucose estimation algorithm | CGMS Gold algorithm | RT glucose estimation algorithm | CGMS Gold algorithm | RT glucose estimation algorithm | CGMS Gold algorithm | ||
| Clarke EGA | |||||||||||||
| Overall | 549 | 98.50 | 93.30 | 90.90 | 76.90 | 7.60 | 16.40 | 0.00 | 0.00 | 1.50 | 6.30 | 0.00 | 0.40 |
| ≤70 | 83 | 90.40 | 59.00 | 89.20 | 57.80 | 1.20 | 1.20 | 0.00 | 0.00 | 9.60 | 41.00 | 0.00 | 0.00 |
| 71–140 | 197 | 100.00 | 100.00 | 84.80 | 73.10 | 15.20 | 26.90 | 0.00 | 0.00 | 0.00 | 0.00 | 0.00 | 0.00 |
| 141–180 | 84 | 100.00 | 100.00 | 94.00 | 88.10 | 6.00 | 11.90 | 0.00 | 0.00 | 0.00 | 0.00 | 0.00 | 0.00 |
| 181–240 | 104 | 100.00 | 98.10 | 96.20 | 79.80 | 3.80 | 18.30 | 0.00 | 0.00 | 0.00 | 0.00 | 0.00 | 1.90 |
| >240 | 81 | 100.00 | 98.70 | 97.50 | 90.10 | 2.50 | 8.60 | 0.00 | 0.00 | 0.00 | 1.30 | 0.00 | 0.00 |
| Consensus EGA | |||||||||||||
| Overall | 549 | 99.00 | 96.70 | 92.90 | 79.00 | 6.1 | 17.70 | 1.00 | 3.30 | 0.00 | 0.00 | 0.00 | 0.00 |
| ≤70 | 83 | 97.00 | 83.10 | 94.60 | 68.60 | 2.40 | 14.50 | 3.00 | 16.90 | 0.00 | 0.00 | 0.00 | 0.00 |
| 71–140 | 197 | 99.50 | 99.30 | 87.80 | 76.50 | 11.70 | 22.80 | 0.50 | 0.70 | 0.00 | 0.00 | 0.00 | 0.00 |
| 141–180 | 84 | 100.00 | 100.00 | 91.70 | 83.30 | 8.30 | 16.70 | 0.00 | 0.00 | 0.00 | 0.00 | 0.00 | 0.00 |
| 181–240 | 104 | 100.00 | 97.10 | 95.20 | 79.80 | 4.80 | 17.30 | 0.00 | 2.90 | 0.00 | 0.00 | 0.00 | 0.00 |
| >240 | 81 | 100.00 | 100.00 | 100.00 | 90.10 | 0.00 | 9.90 | 0.00 | 0.00 | 0.00 | 0.00 | 0.00 | 0.00 |
Clinical point accuracy is presented according to the percentage of items in each risk zone (A–E).
Figure 2.
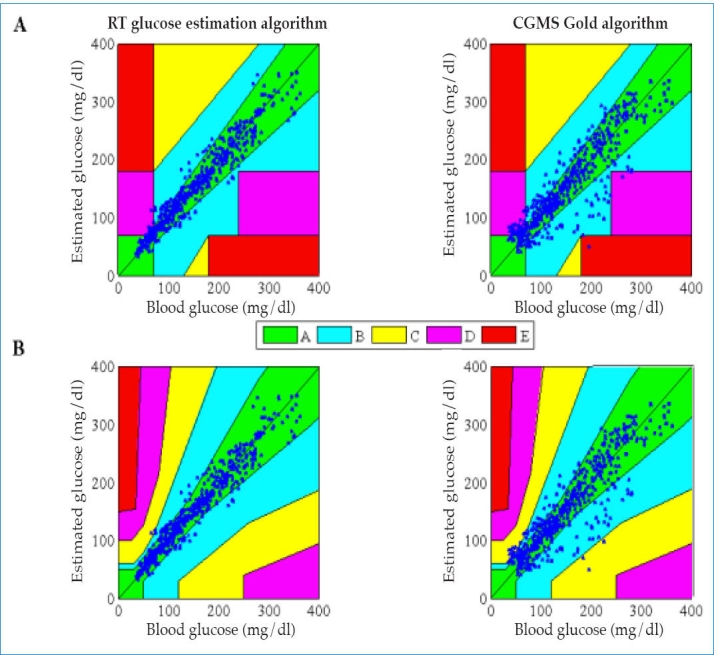
Assessment of RT glucose estimation algorithm and the CGMS Gold algorithm using clinical point accuracy. A, Clarke EGA; B, consensus EGA.
The reliability and performance of the RT glucose estimation algorithm in different glucose ranges were also assessed considering clinical point accuracy (see Table 4). The Clarke EGA and consensus EGA results show that the clinical point accuracy of the proposed algorithm was lowest during hypoglycemic range. Paired points were analyzed during hypoglycemic episodes. Clarke EGA indicated that 90.4% of paired points fell in zones A+B. Consensus EGA indicated that 97.0% of paired points fell in zones A+B. Similar analysis was performed with paired points during euglycemic and hyperglycemic episodes.
Hypoglycemia Detection
To illustrate the ability of the RT glucose estimation algorithm to detect hypoglycemic events (BG ≤70 mg/dl), profiles of the 18 patients were plotted. The profiles in Figures 1A and 1D give an example of the results obtained with the new algorithm.
Its analysis shows that the RT glucose estimation algorithm is very sensitive in the hypoglycemic range, correctly detecting 76 out of 83 cases of hypoglycemia (91.6%). The sensitivity and specificity obtained with the proposed algorithm were 91.6% and 95.0%, respectively.
Comparing the results obtained with the proposed algorithm with those obtained in other previous studies of accuracy reported in the literature, our results show higher values of sensitivity and specificity. Bode et al.35 reported hypoglycemia detection (BG ≤ 70 mg/dl) sensitivity of 67% and specificity of 90.0% for the Guardian REAL-Time. Garg and Jovanovič36 reported a sensitivity of 88% and specificity of 91.4% for the DexCom STS. Garg and coworkers37 reported (BG ≤80 mg/dl) a sensitivity of 61% and specificity of 91% for the DexCom STS using it for 10 days.
Discussion
Continuous glucose monitors are not accurate enough, especially in detecting hypoglycemias. To reduce these errors, a new RT algorithm is proposed for glucose estimation. This study shows that it is feasible to use AR models to estimate BG in RT from CGM intensity readings.
The best overall AR model was a third-order BJ structure with fixed parameters. This model showed good generalization ability. Structures of order less than third order are not able to reproduce the relationship between CGMS Gold intensity and BG. Fourth-order structures capture better the correlations in the data. However, differences are not significant with respect to third-order structures, and the complexity of the model is increased. Structures higher than fourth order were found to be unstable.
Accuracy of the model BG long-term estimations is not entirely satisfactory. It is necessary to incorporate calibration points, as in current algorithms, to correct the estimated glucose levels. Here, the two previous instances are made equal to the calibration point in order to correct the dynamics of the model estimations. In fact, if this measure was not taken, glucose concentration after the calibration points may be not accurate and present drastic differences with respect to the gold standard. This is illustrated in Figure 3, where the two previous instances were left unchanged, only updating the current measurement. As a result, the overall mean and median RADs for all patients were increased (mean RAD = 18.2% versus 9.6%, p <.05, and median RAD = 15.3% versus 9.6%).
Figure 3.
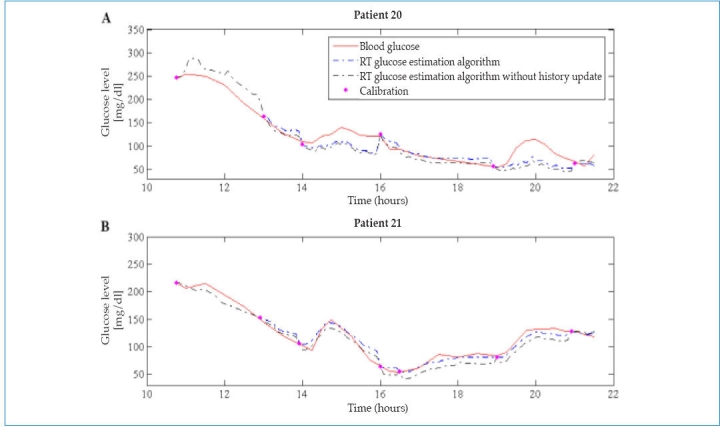
Example of RT glucose estimation algorithm with and without history update in two illustrative patients. The numerical point accuracy metrics were increased in the latter. (A) In patient 20, mean RAD = 18.1% ± 15.1% versus 16.1% ± 12.5%, p <. 05, and median RAD = 14.2% versus 11.9%. (B) In patient 21, mean RAD = 9.2% ± 7.0% versus 6.1% ± 5.9%, p <. 05, and median RAD = 8.0% versus 5.0%.
The results in Figure 1 may suggest the need of frequent calibration points for a good performance of the new algorithm. Tests introducing only calibration points before each intake were performed to assess this (see Figures 4 and 5). Results did not show significant changes in the accuracy of glucose estimations (mean RAD = 11.5% ± 11.0% versus 9.6% ± 9.6%, p <.05 and median RAD = 8.1% versus 6.7%). However, further research is needed to confirm how frequently the calibration process needs to be carried out in general for this new technique.
Figure 4.
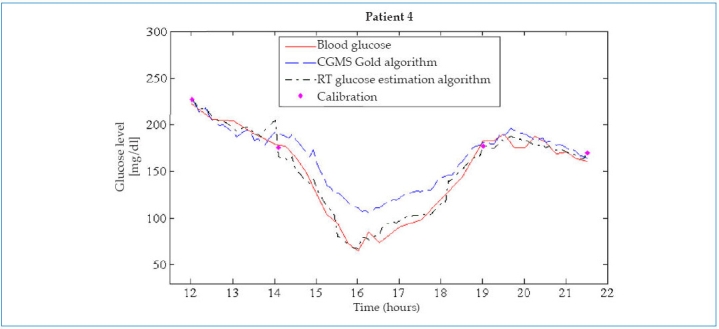
Example of a patient with only four calibration points taken before each intake. The profile of the proposed algorithm shows glucose measurements in RT very close to BG (mean RAD = 5.6% ± 4.5%, p <. 05 and median RAD = 5.1%). Additionally, the profile illustrates the ability of the proposed algorithm to detect hypoglycemic events.
Figure 5.
Tests introducing only calibration points before each intake were performed to assess the new algorithm. Black boxes indicate calibration points in the CGMS Gold. Magenta dots are calibration points used by the proposed algorithm. The profiles of the proposed algorithm show glucose measurements in RT very close to BG, despite using fewer calibration points than the CGMS Gold.
In conclusion, the AR models can be considered good tools to develop glucose estimation algorithms for patients with type 1 diabetes. In this study, the profiles obtained with the new algorithm allowed us to observe glucose measurements in RT that have a good correspondence level with the “gold-standard” blood analyses. The performance is measured with clinical and numerical accuracy metrics and illustrates the improved accuracy of the proposed algorithm. From the therapeutic point of view, when compared with CGMS Gold and previous results presented in the literature for other RT CGMs, an improvement in hypoglycemia detection was achieved.
Acknowledgment
Yenny Leal acknowledges the BR Grants of the University of Girona.
Abbreviations
- AR
autoregressive
- BG
blood glucose
- BJ
Box–Jenkins
- CGM
continuous glucose monitor
- EGA
error grid analysis
- IG
interstitial glucose
- ISO
International Organization for Standardization
- RAD
relative absolute difference
- RT
real time
References
- 1.Kovatchev B, Clarke WL. Continuous glucose monitoring (CGM) reduces risks for hypo- and hyperglycemia and glucose variability in diabetes. Diabetes. 2007;56(Suppl 1):A23. [Google Scholar]
- 2.Klonoff DC. Continuous glucose monitoring: roadmap for 21st century diabetes therapy. Diabetes Care. 2005;28(5):1231–1239. doi: 10.2337/diacare.28.5.1231. [DOI] [PubMed] [Google Scholar]
- 3.Deiss D, Bolinder J, Riveline JP, Battelino T, Bosi E, Tubiana-Rufi N, Kerr D, Phillip M. Improved glycemic control in poorly controlled patients with type 1 diabetes using real-time continuous glucose monitoring. Diabetes Care. 2006;29(12):2730–2732. doi: 10.2337/dc06-1134. [DOI] [PubMed] [Google Scholar]
- 4.Tamborlane WV, Beck RW, Bode BW, Buckingham B, Chase HP, Clemons R, Fiallo-Scharer R, Fox LA, Gilliam LK, Hirsch IB, Huang ES, Kollman C, Kowalski AJ, Laffel L, Lawrence JM, Lee J, Mauras N, O'Grady M, Ruedy KJ, Tansey M, Tsalikian E, Weinzimer S, Wilson DM, Wolpert H, Wysocki T, Xing D Juvenile Diabetes Research Foundation Continuous Glucose Monitoring Study Group. Continuous glucose monitoring and intensive treatment of type 1 diabetes. N Engl J Med. 2008;359(14):1464–1476. doi: 10.1056/NEJMoa0805017. [DOI] [PubMed] [Google Scholar]
- 5.Ellis SL, Bookout T, Garg SK, Izuora KE. Use of continuous glucose monitoring to improve diabetes mellitus management. Endocrinol Metab Clin North Am. 2007;36(Suppl 2):46–68. doi: 10.1016/s0889-8529(07)80011-9. [DOI] [PubMed] [Google Scholar]
- 6.King C, Anderson SM, Breton M, Clarke WL, Kovatchev BP. Modeling of calibration effectiveness and blood-to-interstitial glucose dynamics as potential confounders of the accuracy of continuous glucose sensors during hyperinsulinemic clamp. J Diabetes Sci Technol. 2007;1(3):317–322. doi: 10.1901/jaba.2007.1-317. [DOI] [PMC free article] [PubMed] [Google Scholar]
- 7.Rebrin K, Steil GM, van Antwerp WP, Mastrototaro JJ. Subcutaneous glucose predicts plasma glucose independent of insulimplications for continuous monitoring. Am J Physiol. 1999;277(3 Pt 1) doi: 10.1152/ajpendo.1999.277.3.E561. [DOI] [PubMed] [Google Scholar]
- 8.Steil GM, Rebrin K, Hariri F, Jinagonda S, Tadros S, Darwin C, Saad MF. Interstitial fluid glucose dynamics during insulin-induced hypoglycaemia. Diabetologia. 2005;48(9):1833–1840. doi: 10.1007/s00125-005-1852-x. [DOI] [PubMed] [Google Scholar]
- 9.Breton M, Kovatchev BP. Analysis, modeling, and simulation of the accuracy of continuous glucose sensors. J Diabetes Sci Technol. 2008;2(5):853–862. doi: 10.1901/jaba.2008.2-853. [DOI] [PMC free article] [PubMed] [Google Scholar]
- 10.Cengiz E, Tamborlane WV. A tale of two compartments: interstitial versus blood glucose monitoring. Diabetes Technol Ther. 2009;11(Suppl 1):S11–S16. doi: 10.1089/dia.2009.0002. [DOI] [PMC free article] [PubMed] [Google Scholar]
- 11.Weinzimer SA, DeLucia MC, Boland EA, Steffen A, Tamborlane WV. Analysis of continuous glucose monitoring data from non-diabetic and diabetic children: a tale of two algorithms. Diabetes Technol Ther. 2003;5(3):375–380. doi: 10.1089/152091503765691866. [DOI] [PubMed] [Google Scholar]
- 12.Buckingham B. Analysis: dawn of real-time continuous glucose sensing. Diabetes Technol Ther. 2003;5(3):381–383. doi: 10.1089/152091503765691875. [DOI] [PubMed] [Google Scholar]
- 13.Diabetes Research In Children Network (Direcnet) Study Group. Buckingham BA, Kollman C, Beck R, Kalajian A, Fiallo-Scharer R, Tansey MJ, Fox LA, Wilson DM, Weinzimer SA, Ruedy KJ, Tamborlane WV. Evaluation of factors affecting CGMS calibration. Diabetes Technol Ther. 2006;8(3):318–325. doi: 10.1089/dia.2006.8.318. [DOI] [PMC free article] [PubMed] [Google Scholar]
- 14.Facchinetti A, Sparacino G, Cobelli C. Reconstruction of glucose in plasma from interstitial fluid continuous glucose monitoring data: role of sensor calibration. J Diabetes Sci Technol. 2007;1(5):617–623. doi: 10.1177/193229680700100504. [DOI] [PMC free article] [PubMed] [Google Scholar]
- 15.Lesperance LM, Spektor A, McLeod KJ. Calibration of the continuous glucose monitoring system for transient glucose monitoring. Diabetes Technol Ther. 2007;9(2):183–190. doi: 10.1089/dia.2006.0008. [DOI] [PubMed] [Google Scholar]
- 16.Eren-Oruklu M, Cinar A, Quinn L, Smith D. Estimation of future glucose concentrations with subject-specific recursive linear models. Diabetes Technol Ther. 2009;11(4):243–253. doi: 10.1089/dia.2008.0065. [DOI] [PMC free article] [PubMed] [Google Scholar]
- 17.Finan DA, Zisser H, Jovanovic L, Bevier WC, Seborg DE. Practical issues in the identification of empirical models from simulated type 1 diabetes data. Diabetes Technol Ther. 2007;9(5):438–450. doi: 10.1089/dia.2007.0202. [DOI] [PubMed] [Google Scholar]
- 18.Sparacino G, Zanderigo F, Corazza S, Maran A, Facchinetti A, Cobelli C. Glucose concentration can be predicted ahead in time from continuous glucose monitoring sensor time-series. IEEE Trans Biomed Eng. 2007;54(5):931–937. doi: 10.1109/TBME.2006.889774. [DOI] [PubMed] [Google Scholar]
- 19.Reifman J, Rajaraman S, Gribok A, Ward WK. Predictive monitoring for improved management of glucose levels. J Diabetes Sci Technol. 2007;1(4):478–486. doi: 10.1177/193229680700100405. [DOI] [PMC free article] [PubMed] [Google Scholar]
- 20.Gani A, Gribok AV, Rajaraman S, Ward WK, Reifman J. Predicting subcutaneous glucose concentration in humans: data-driven glucose modeling. IEEE Trans Biomed Eng. 2009;56(2):246–254. doi: 10.1109/TBME.2008.2005937. [DOI] [PubMed] [Google Scholar]
- 21.Clarke WL, Kovatchev B. Continuous glucose sensors: continuing questions about clinical accuracy. J Diabetes Sci Technol. 2007;1(5):669–675. doi: 10.1177/193229680700100510. [DOI] [PMC free article] [PubMed] [Google Scholar]
- 22.Clarke WL, Cox D, Gonder-Frederick LA, Carter W, Pohl SL. Evaluating clinical accuracy of systems for self-monitoring of blood glucose. Diabetes Care. 1987;10(5):622–628. doi: 10.2337/diacare.10.5.622. [DOI] [PubMed] [Google Scholar]
- 23.Parkes JL, Slatin SL, Pardo S, Ginsberg BH. A new consensus error grid to evaluate the clinical significance of inaccuracies in the measurement of blood glucose. Diabetes Care. 2000;23(8):1143–1148. doi: 10.2337/diacare.23.8.1143. [DOI] [PubMed] [Google Scholar]
- 24.2003. Medtronic Minimed. The Medtronic Minimed CGMS® System SolutionsTM Software: User Guide MMT-7310, Version 3.0C.
- 25.Velleman PF, Hoaglin DC. Applications, basics, and computing of exploratory data analysis. Boston: Duxbury Press; 1981. [Google Scholar]
- 26.Bondia J, Tarín C, García-Gabin W, Esteve E, Fernández-Real JM, Ricart W, Vehí J. Using support vector machines to detect therapeutically incorrect measurements by the MiniMed CGMS. J Diabetes Sci Technol. 2008;2(4):622–629. doi: 10.1177/193229680800200413. [DOI] [PMC free article] [PubMed] [Google Scholar]
- 27.Wentholt IM, Vollebregt MA, Hart AA, Hoekstra JB, DeVries JH. Comparison of a needle-type and a microdialysis continuous glucose monitor in type 1 diabetic patients. Diabetes Care. 2005;28(12):2871–2876. doi: 10.2337/diacare.28.12.2871. [DOI] [PubMed] [Google Scholar]
- 28.Garg SK, Smith J, Beatson C, Lopez-Baca B, Voelmle M, Gottlieb PA. Comparison of accuracy and safety of the SEVEN and the Navigator continuous glucose monitoring systems. Diabetes Technol Ther. 2009;11(2):65–72. doi: 10.1089/dia.2008.0109. [DOI] [PubMed] [Google Scholar]
- 29.Ljung L. System identification: theory for the user. Englewood Cliffs: Prentice Hall; 1999. [Google Scholar]
- 30.MATLAB. Natick: The MathWorks, Inc; 2007. System Identification Toolbox. [Google Scholar]
- 31.Weinstein RL, Schwartz SL, Brazg RL, Bugler JR, Peyser TA, McGarraugh GV. Accuracy of the 5-day FreeStyle Navigator continuous glucose monitoring system: comparison with frequent laboratory reference measurements. Diabetes Care. 2007;30(5):1125–1130. doi: 10.2337/dc06-1602. [DOI] [PubMed] [Google Scholar]
- 32.Mazze RS, Strock E, Borgman S, Wesley D, Stout P, Racchini J. Evaluating the accuracy, reliability, and clinical applicability of continuous glucose monitoring (CGM): is CGM ready for real time? Diabetes Technol Ther. 2009;11(1):11–18. doi: 10.1089/dia.2008.0041. [DOI] [PubMed] [Google Scholar]
- 33.Kovatchev B, Anderson S, Heinemann L, Clarke W. Comparison of the numerical and clinical accuracy of four continuous glucose monitors. Diabetes Care. 2008;31(6):1160–1164. doi: 10.2337/dc07-2401. [DOI] [PMC free article] [PubMed] [Google Scholar]
- 34.Kovatchev BP, Gonder-Frederick LA, Cox DJ, Clarke WL. Evaluating the accuracy of continuous glucose-monitoring sensors: continuous glucose-error grid analysis illustrated by TheraSense Freestyle Navigator data. Diabetes Care. 2004;27(8):1922–1928. doi: 10.2337/diacare.27.8.1922. [DOI] [PubMed] [Google Scholar]
- 35.Bode B, Gross K, Rikalo N, Schwartz S, Wahl T, Page C, Gross T, Mastrototaro J. Alarms based on real-time sensor glucose values alert patients to hypo- and hyperglycemia: the guardian continuous monitoring system. Diabetes Technol Ther. 2004;6(2):105–113. doi: 10.1089/152091504773731285. [DOI] [PubMed] [Google Scholar]
- 36.Garg S, Jovanovič L. Relationship of fasting and hourly blood glucose levels to HbA1c values: safety, accuracy, and improvements in glucose profiles obtained using a 7-day continuous glucose sensor. Diabetes Care. 2006;29(12):2644–2649. doi: 10.2337/dc06-1361. [DOI] [PubMed] [Google Scholar]
- 37.Garg SK, Voelmle MK, Gottlieb P. Feasibility of 10-day use of a continuous glucose-monitoring system in adults with type 1 diabetes. Diabetes Care. 2009;32(3):436–438. doi: 10.2337/dc08-1745. [DOI] [PMC free article] [PubMed] [Google Scholar]
- 38.International Organization for Standardization. In vitro diagnostic test systems—requirements for blood-glucose monitoring systems for self-testing in managing diabetes mellitus. Geneva: International Organization for Standardization; 2003. ISO 15197:2003. [Google Scholar]