

Abstract
Underlying the seemingly uniform cellular composition of the adult mammalian cerebellum (Cb) are striking parasagittal stripes of gene expression along the medial-lateral (ML) axis that are organized with respect to the lobules that divide the Cb along the anterior–posterior (AP) axis. Although there is a clear correlation between the organization of gene expression stripes and Cb activity patterns, little is known about the genetic pathways that determine the intrinsic stripe molecular code. Here we establish that ML molecular code patterning is highly dependent on two homeobox transcription factors, Engrailed1 (En1) and En2, both of which are also required for patterning the lobules. Gene expression analysis of an allelic series of En1/2 mutant mice that have an intact Purkinje cell layer revealed severe patterning defects using three known components of the ML molecular code and a new marker of Hsp25 negative stripes (Neurofilament heavy chain, Nfh). Importantly, the complementary expression of ZebrinII/PhospholipaseCβ4 and Hsp25/Nfh changes in unison in each mutant. Furthermore, each En gene has unique as well as overlapping functions in patterning the ML molecular code and each En protein has dominant functions in different AP domains (subsets of lobules). Remarkably, in En1/2 mutants with almost normal foliation, ML molecular code patterning is severely disrupted. Thus, independent mechanisms that use En1/2 must pattern foliation and spatial gene expression separately. Our studies reveal that En1/2 are fundamental components of the genetic pathways that pattern the two intersecting coordinate systems of the Cb, morphological divisions and the molecular code.
Keywords: En1, ZebrinII, molecular code, foliation, coordinate systems, patterning
Introduction
Despite the homogenous cytoarchitecture of the cerebellum (Cb), there exists an intricate array of parasagittal stripes of cells defined by their unique molecular and physiological characteristics. Over 40 years ago, Scott (1963) identified the first parasagittal stripes of enzyme activity in the Cb cortex, and Voogd (1964) highlighted that the axons within the white matter are organized into bands. Neurophysiological recordings in the Cb have since correlated patterned sensory activity to stripes of gene expression (Chockkan and Hawkes, 1994; Chen et al., 1996; Hallem et al., 1999; Schonewille et al., 2006). Furthermore, fMRI and optical imaging have revealed a medial-lateral (ML) distribution of activity after vibrissae stimulation (Peeters et al., 1999; Ebner et al., 2005), and an eye-blink learning paradigm can be altered by infusion of an AMPA/kainate receptor blocker into a specific ML molecular domain (Attwell et al., 1999). Thus, in addition to the sheer number of genes expressed in ML stripes and their inclusion of PhospholipaseCβ4 (Plcβ4) and the glutamate transporter EAAT4 (Sarna et al., 2006; Gincel et al., 2007), these data argue strongly that functionally significant information is encoded in a ML stripe organization that correlates with intrinsic gene expression. It is therefore imperative to identify genetic pathways that determine the patterns of ML stripe gene expression.
Although the Engrailed (En) homeobox genes are best known for their role in regulating Cb foliation, a morphological indication of anterior–posterior (AP) subdivisions of the Cb, in the embryonic Cb En1 and En2 are among several genes expressed in ML domains including Purkinje cells (PCs) (Millen et al., 1995; Sillitoe and Joyner, 2007). In adults, most genes expressed in ML stripes are restricted to PCs and in only a subset of lobules (AP domains). Significantly, at least one such gene, AldolaseC referred to as ZebrinII (Ahn et al., 1994), has a conserved expression pattern from rodents through primates (Sillitoe et al., 2005). Although temporally embryonic striped gene expression patterns do not overlap with adult, Plcβ4 expression appears to bridge between the two stages and mark the same PC stripes throughout (Marzban et al., 2007). Furthermore, En2 seems to influence adult ML stripe gene expression because En2 mutants have a mild alteration in ZebrinII expression without a disruption of cytoarchitecture (Kuemerle et al., 1997). Thus, gene expression divides the developing and adult Cb into a complex map of ML stripes of gene expression, which we refer to as the Cb ML molecular code (Sillitoe and Joyner, 2007).
Given that En2 might regulate ML molecular code patterning, and because the En transcription factors are known to have extensive functional overlap in regulating foliation, we analyzed an allelic series of viable En1/2 mutants to test whether the two genes together play a broad role in regulating ML molecular coding throughout the vermis. We found that foliation and molecular coding are patterned through independent processes, and that both are indeed controlled by En functions. In addition, each En protein has a dominant function in complementary domains along the AP axis. We propose that lobules in the AP axis and molecular coding in the ML axis together constitute a final “read out” of cues laid down by En1/2 and used to pattern the Cb in three-dimensions.
Materials and Methods
Mice.
All animal studies were performed under an approved IACUC animal protocol according to the institutional guidelines at New York University School of Medicine and Memorial-Sloan Kettering Cancer Center. Two En2 null alleles (hd, Joyner et al., 1991 and ntd, Millen et al., 1994), three En1 null alleles (hd, Wurst et al., 1994; cre, Kimmel et al., 2000; creERT1, Sgaier et al., 2005), an En1 conditional allele (flox, Sgaier et al., 2007) and a knock-in allele expressing En2 (2ki, Hanks et al., 1995) were interbred to generate En1flox/cre, En2hd/hd or En2ntd/ntd (referred to as En2−/−), and En1hd/+;En2ntd/ntd (referred to as En1+/−;En2−/−), En12ki/creER;En2ntd/ntd, En12ki/2ki;En2ntd/ntd mice and genotyped as described (Joyner et al., 1991; Sgaier et al., 2007). The mutants were kept on an outbred background except for En2hd mutants that have been bred to C57BL/6.
Histology and immunohistochemistry.
Mice were perfused with 4% paraformaldehyde (PFA), and serial 40-μm-thick coronal sections were cut on a cryostat and collected as free-floating sections. For histological analyses of free-floating sections we used a standard cresyl violet staining procedure (Sillitoe et al., 2003). For histological analysis of paraffin sections (cut at 8 μm), we used a standard hematoxylin/eosin staining procedure (Sgaier et al., 2007). Immunohistochemistry was performed as described previously (Sillitoe et al., 2003). Monoclonal anti-ZebrinII (Brochu et al., 1990) was used directly from spent hybridoma culture medium at a concentration of 1:250 (gift from Dr. Richard Hawkes, University of Calgary). Rabbit polyclonal anti-Hsp25 (1:500) was purchased from StressGen. Anti-Nfh (also called anti-SMI-32; 1:1500) was purchased from Covance and anti-Plcβ4 (1:250) was purchased from Santa Cruz Biotechnology. Visualization using diaminobenzidine (DAB, 0.5 mg/ml) was achieved using horseradish peroxidase (HRP) conjugated goat anti-rabbit or HRP-conjugated goat anti-mouse antibodies (all diluted 1:200 in PBS; DAKO). Staining for fluorescent immunohistochemistry was achieved using Alexa 488- and 555-conjugated immunoglobulins (Molecular Probes), both diluted 1:1500.
Microscopy and data analysis.
Photomicrographs were captured using a Retiga SRV camera mounted on a Leica DM6000 microscope. Images were acquired and analyzed using Volocity software (version 4.1.0) and thereafter imported into Adobe Photoshop CS2 and Adobe Illustrator CS2.
Statistical analysis.
The width of the P1+ and P3+ stripes in lobule III of wild-type, En1+/−, and En2+/− mice were computed based on equally spaced 40 μm free-floating sections that were stained for ZebrinII. A total of 6 tissue sections per animal and 3 animals per genotype were used. The number of clearly labeled ZebrinII stained PCs were counted for each stripe in both the anterior and posterior aspects of lobule III. The sum of the number of PCs for each stripe was computed and the means for each stripe within each genotype was used to calculate the SEM. The p values (< 0.05, see results) were acquired using a one-way ANOVA test (Microsoft Excel) to compare the difference in stripe widths across the genotypes.
Results
The mammalian Cb is divided morphologically into 10 major lobules in the AP axis (numbered I–X; Larsell, 1952; Larsell, 1970) and into four broad regions in the ML axis (vermis, paravermis, hemispheres, flocculus/paraflocculus). The lobules thus can be thought of as representing one coordinate system of the Cb (Sillitoe and Joyner, 2007). The intrinsic stripe gene expression would likewise represent a second Cb coordinate system. The ML molecular code not only provides a finer degree of subdivisions in the ML axis, but also the regional differences in the patterns of ML stripe gene expression have been used as evidence that the 10 lobules in the vermis are further organized into four broad transverse zones (Ozol et al., 1999) referred to from anterior to posterior as: the anterior zone (AZ: lobules I–V), the central zone (CZ: lobules VI, VII), the posterior zone [PZ: lobules VIII, anterior (a) IX], and the nodular zone [NZ: lobules posterior (p) IX, X] (Figs. 1E, 2P). Suggesting that these zones having functional significance, the foliation phenotypes of mouse En1/2 mutants reveal a similar subdivision of the vermis into four zones (Sgaier et al. 2007) and most of the major Cb afferent systems project only to particular zones (Sillitoe and Joyner, 2007). ZebrinII is expressed in stripes only in the AZ and PZ (Brochu et al., 1990), whereas Heat shock protein 25 (Hsp25) is expressed in stripes in the CZ and NZ of mice (Armstrong et al., 2000). We have used these two expression patterns to assay for possible ML molecular coding changes throughout the vermis of mouse En mutants. We have focused on the vermis because the two coordinate systems can be most effectively translated from mouse to human in this region.
Figure 1.
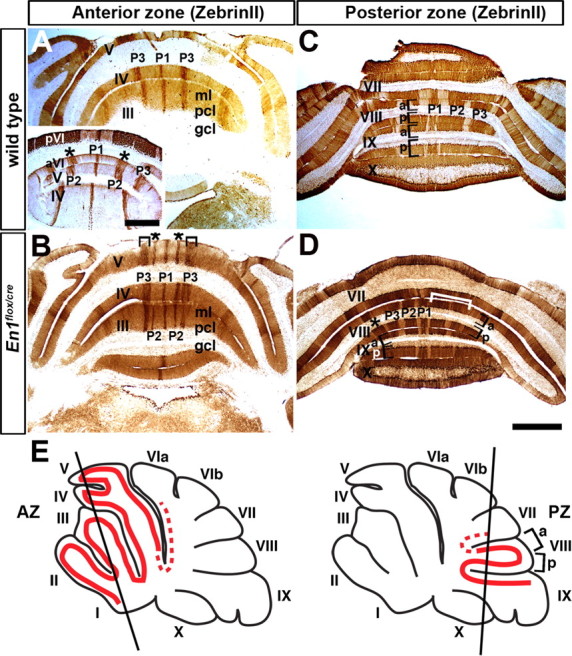
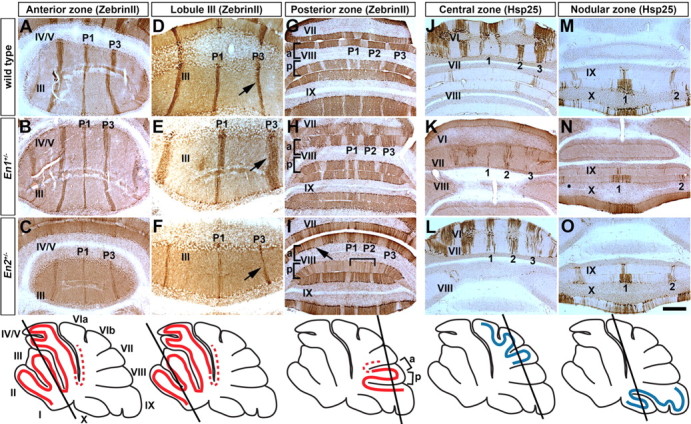
Molecular coding is altered in En1flox/cre mutant mice that have normal foliation. A, ZebrinII expression reveals three distinct ML stripes in the AZ of wild-type mice as seen on coronal cut tissue sections. Only the P1+ and P3+ stripes are seen in lobules I–IV. In lobule V, P2+ is also seen (inset). B, In En1flox/cre mutants, P2+ ZebrinII stripes extend forward past the primary fissure into lobule III. The P3+ stripes are thicker in En1flox/cre mutants compared with wild-type mice. The asterisks in A and B indicate the position of P2+, and the inverted brackets in B highlight the increased thickness of P3+ in En1flox/cre mutants. C, In the vermis of lobule VIII (PZ), two stripes flank the midline stripe and each one has a different width. D, In En1flox/cre mutants, the stripes in aVIII are poorly defined and often fused (white bracket) on one side of the Cb. In pVIII, three stripes flank the midline stripe instead of only two as in wild-type mice. E, The schematics illustrate the locations of ZebrinII stripes (solid red lines) in the AZ and PZ, and the slanted black lines indicate the levels of where the tissue sections were taken. The dotted red lines indicate the “transition zones” in which the pattern of ZebrinII stripes can vary from animal to animal (also applies to Figs. 5 and 7). In all figures, the lobules are indicated by Roman numerals. a, Anterior; p, posterior; ml, molecular layer; pcl, Purkinje cell layer; gcl, granule cell layer (in this and all figures). Scale bars (in A), 500 μm; (in D), 1 mm (applies to all other panels).
Figure 2.
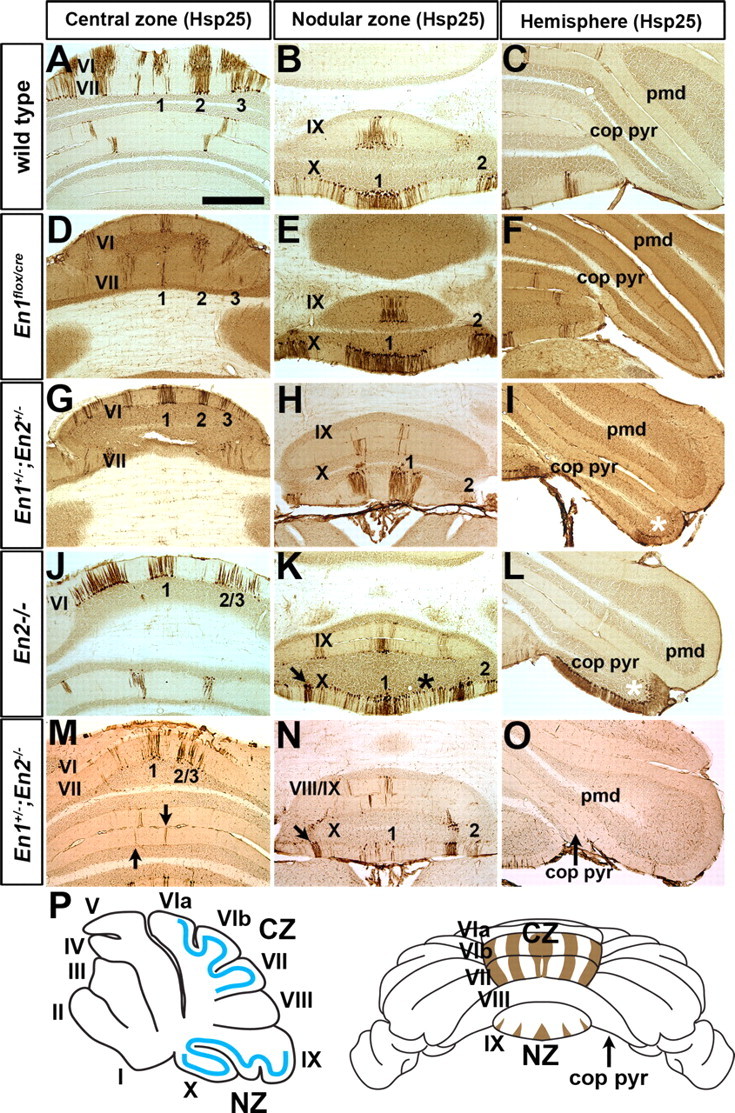
Hsp25 molecular coding is sensitive to mutations in En1 and En2. A, D, G, J, M, The pattern of Hsp25 molecular coding in the CZ is altered in En1 and En2 mutants. Arrows in M point to ectopic stripes at the midline of lobule VII and VIII/IX of En1+/−;En2−/− mutants. B, E, H, K, N, The pattern of Hsp25 molecular coding in the NZ is altered in En1 and En2 mutants. Arrows in K and N point to ectopic stripes found only in the NZ of En2−/− and En1+/−;En2−/− mutants. The asterisk in K indicates the location of ectopic Hsp25 expression in the NZ of En2−/− mutants. C, F, I, L, O, Removal of En2 but not En1 results in ectopic expression of Hsp25 in the copula pyramidis. Asterisks in I and L indicate ectopic Hsp25 expression in the copula pyramidis, and the arrow in O points to the copula pyramidis in En1+/−;En2−/− mutants which is severely reduced in size compared with wild-type mice. P, The schematic on the left illustrates the locations of Hsp25 stripes (solid blue lines) in the CZ and NZ, and the schematic on the right illustrates the ML pattern of Hsp25 expression in the CZ and NZ. Scale bar, 1 mm (applies to all panels).
En1 is required for patterning the ML molecular code
The ML molecular code has not been examined in En1 mutants, in part because most En1 null mutants die at birth and lack a Cb (Wurst et al., 1994). As a first step to examine whether En1 is required for ML molecular code patterning we chose a viable conditional mutant (En1flox/cre) to analyze that lacks En1 function after ∼E9 (24 h after expression is initiated). Of note, we previously reported that 2/7 (∼30%) En1flox/cre mutants showed no obvious morphological defects in the Cb, whereas the remainder had a mild fusion of lobules I–III of the AZ (Sgaier et al., 2007) (supplemental Fig. 1C, available at www.jneurosci.org as supplemental material). The variability in the subtle defects in foliation likely reflects slight temporal variations of recombination of the En1flox allele with normal foliation arising when En1 is deleted slightly later (Sgaier et al., 2007). In addition, the layered cytoarchitecture and the density of cells, including PCs, are comparable to wild type in En1flox/cre mutants (supplemental Fig. 2, available at www.jneurosci.org as supplemental material). Strikingly, we found that ZebrinII stripe gene expression is markedly and consistently altered in the AZ (Fig. 1A,B) and PZ (Fig. 1C,D) of En1flox/cre mutants (n = 12) compared with wild-type littermates regardless of the foliation phenotype (compare ZebrinII expression in the AZ of En1flox/cre mutants with mild or severe fusion of lobules I–III) (Figs. 1B, 3D, respectively). In the AZ (lobules I–V) of wild-type mice there are three prominent stripes: one at the midline (P1+) and two on either side approximately half way along the ML axis (P3+). Additional pairs of ZebrinII stripes that lie between P1+ and P3+ (P2+) (for nomenclature, see Sillitoe et al., 2005) normally only extend from the base of anterior (a) VI into aV (Fig. 1A, inset) (Ozol et al., 1999). Compared with wild-type mice (Fig. 1A), the P3+ ZebrinII positive stripe in En1flox/cre mutants was broader (Fig. 1B, inverted bracket) and often split into two or three stripes (Fig. 1B; supplemental Fig. 3, available at www.jneurosci.org as supplemental material). The splitting of P3+ into additional stripes was more pronounced on one side of the Cb in ∼60% of the animals analyzed (n = 7/12). Also, the “new” stripes were found at a ML location similar to the wild-type P2+ stripes as if the P2+ stripes were extended anteriorly into lobule II. Although we found that whether the “P2+” stripe was a solid stripe in all the anterior lobules or variable but on both sides of the midline, the basic patterning change was present in all animals analyzed. Even in cases in which “P2+” was robust on only one side of the Cb, the contralateral side did indeed have the same basic phenotype but “P2+” was present in only some lobules (supplemental Fig. 3, available at www.jneurosci.org as supplemental material). It is interesting to note that in the “transition zone” between the AZ and CZ (Fig. 1E, dotted red line) of wild-type mice P3+ becomes fragmented unevenly between the two sides of the Cb and P2+ extends unevenly (both its width and length) into lobule V (Ozol et al., 1999). Thus, the variability seen in En1flox/cre mutants is likely inherent to the process that establishes the striped gene expression rather than specific to the En1 mutant phenotype.
Figure 3.
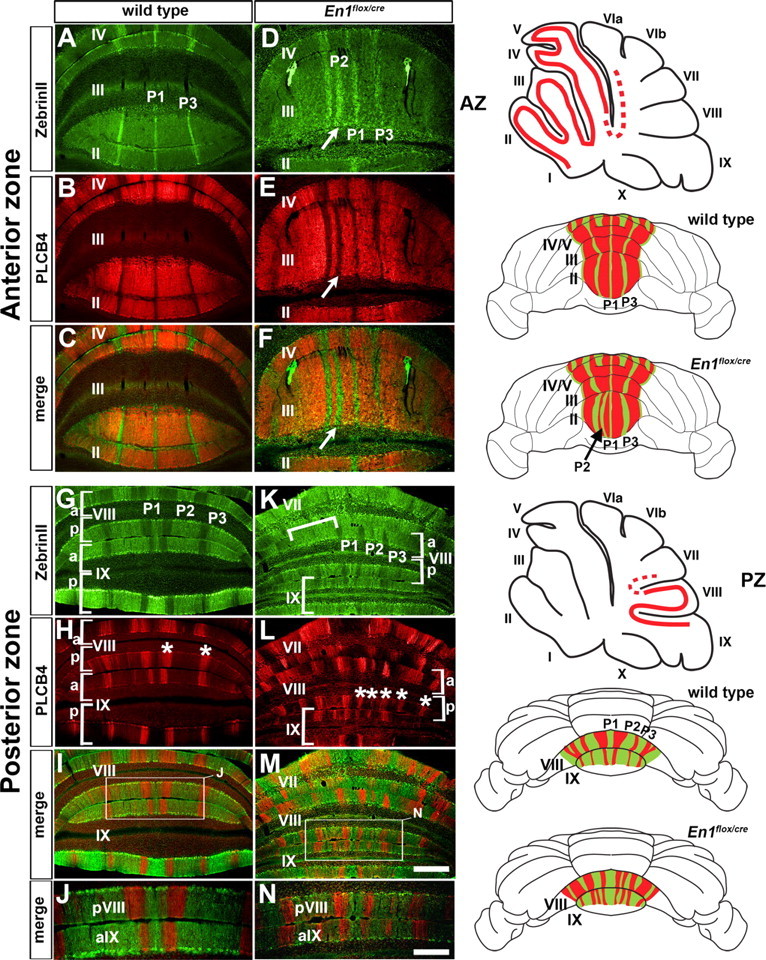
ZebrinII and Plcβ4 molecular coding are altered in unison in En1flox/cre mutant mice. A–C, G–J, ZebrinII and Plcβ4 are expressed in complementary ML stripes in the anterior (A–C) and posterior (G–J) lobules of wild-type mice. The asterisks in H indicate two Plcβ4 immunoreactive stripes in pVIII. D–F, K–N, ZebrinII and Plcβ4 expression patterns are disrupted in the anterior (D–F) and posterior (K–N) lobules of En1flox/cre mutants, but their complementary relationship is preserved. The arrows in D–F point to the extended P2+ stripe in lobule III of En1flox/cre mutants. The inverted white bracket (K) indicates a region of uniform ZebrinII expression, and the asterisks (L) indicate additional Plcβ4 positive stripes in En1flox/cre mutants (compare with the number of stripes in wild type as indicated by asterisks in H). The regions outlined by the white boxes in I and M are shown at higher power in J and N. The sagittal schematics illustrate the locations of ZebrinII ML stripes in the AZ and PZ (dotted red lines indicate “transition zones”), and the whole-mount schematics illustrate the complementary patterns of ZebrinII and Plcβ4 expression in the AZ and PZ of wild-type and En1flox/cre mice. Note that for clarity, we have drawn clear boundaries between each stripe in the PZ of this example of an En1flox/cre mutant (see Results for details). Scale bars (in M), 500 μm (applies to A–I and K–M); (in N), 250 μm (also applies to J).
In lobule aVIII of the PZ in wild-type mice there are four sharp stripes numbered P1+ to P4+, and each one has a different relative size in width (Fig. 1C, aVIII). There are only three stripes in pVIII (Fig. 1C) and each one has a different width compared with the equivalent stripe in aVIII. In lobule IX, a reproducible pattern is only seen in aIX and the pattern is similar to pVIII (Fig. 1C). In contrast, in the En1flox/cre mutants the limits of the boundaries of each stripe in aVIII were poorly delineated and each ZebrinII positive stripe was more equal in width than normal (Fig. 1D, P1–P3). In ∼50% of the mutants (n = 6/12) a clear stripe pattern was not seen on one side of lobule aVIII (Fig. 1D, bracket). In pVIII of En1flox/cre mutants, three wide ZebrinII positive stripes were found on each side of the midline stripe (Fig. 1D, asterisk) whereas in wild-type mice only two are found. Finally, in most En1flox/cre mutants (n = 10/12) three ZebrinII negative stripes were clearly defined on either side of the midline in aIX, whereas in wild-type mice only two thin stripes are found (Fig. 3). In a minority of the animals analyzed (n = 2/12), the distribution of ZebrinII stripes in aIX of En1flox/cre mutants was similar to wild type (Fig. 1C,D).
In wild-type mice, Hsp25 is expressed in five distinct ML stripes in the CZ (lobules VI and VII), five stripes in lobule IX of the NZ, and three stripes in lobule X of the NZ (Figs. 2A–C, 4) (Armstrong et al., 2000). Although the number of Hsp25 immunoreactive stripes was preserved in En1flox/cre mice, each stripe in the CZ appeared narrower with poorly delineated boundaries, and the stripes in the NZ were wider and more robustly stained than normal (Fig. 2D–F). These studies reveal that the pattern of ML molecular coding, but not foliation, is highly dependent on continued En1 expression after E9, especially in the AZ and PZ.
Figure 4.
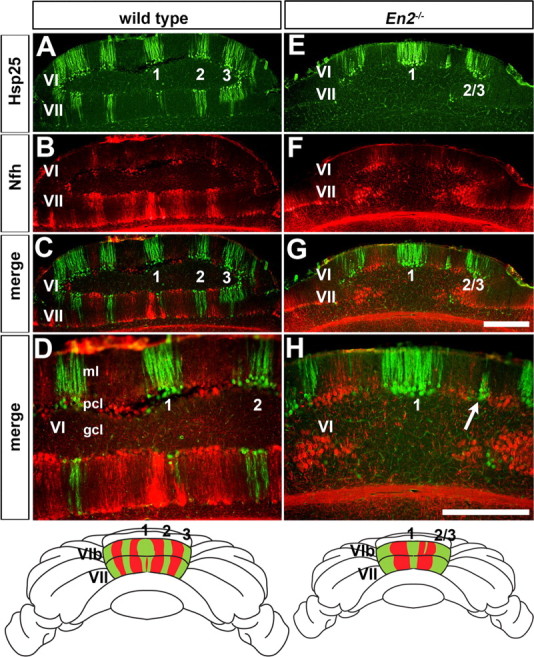
Hsp25 and Nfh molecular coding are altered in unison in the cerebellum of En2−/− mutant mice. A, Hsp25 expression reveals five ML stripes in lobules VI/VII of wild-type mice as seen on coronal cut tissue sections (#1 is the midline stripe and #2 and #3 flank both sides of the vermis midline). B–D, Hsp25 and Nfh are expressed in complementary ML stripes in lobules VI/VII of wild-type mice. E, The number of Hsp25 stripes is reduced from five to only three in lobules VI/VII of En2−/− mutants (#2/3 indicates the fused lateral stripes). F–H, Hsp25 and Nfh expression patterns are disrupted in lobules VI/VII of En2−/− mutants, but their complementary relationship is preserved. D and H are higher power images of the midline stripes shown in C and G. The arrow in H points to a patch of Purkinje cells that ectopically expresses Hsp25. The whole-mount schematics illustrate the complementary patterns of Hsp25 and Nfh in the CZ of wild-type and En2−/− mice. Scale bars: (in G), 500 μm (applies to A–C and E–G); (in H) 500 μm (applies to D).
Molecular coding is globally altered in En2 mutants
Expression of En2 begins ∼12 h after En1 (Davis et al., 1988; Sgaier et al., 2007). Previous experiments showed that ZebrinII expression is mildly altered in mutants that either lack En2 or over-express it in PCs (Kuemerle et al., 1997; Baader et al., 1999). It should be noted that although both mutants have ∼40% less PCs than wild type, the loss of PCs in En2−/− mutants is likely because of an early effect on the generation of PCs (Millen et al., 1994; Kuemerle et al., 1997; Sgaier et al., 2007) whereas in the over-expressing mice the loss is because of postmitotic cell death (Baader et al., 1999). In addition, the En2−/− Cb is ∼1/3 smaller than wild type (supplemental Fig. 1A,B, available at www.jneurosci.org as supplemental material), and in the vermis lobule VIII is proportionally smaller than the other lobules and shifted caudally (supplemental Fig. 1B, available at www.jneurosci.org as supplemental material) (Joyner et al., 1991; Millen et al., 1994). Despite these gross morphological defects the layered cytoarchitecture and importantly, the PC density and monolayer, are unchanged compared with wild-type mice (supplemental Fig. 2, available at www.jneurosci.org as supplemental material) and there is a general decrease in PC and granule cell number proportional to the reduced size of the Cb (Kuemerle et al., 1997). In the AZ of En2−/− mutant mice (n = 8), the level of ZebrinII expression in the P3+ stripes is weaker than normal and in the PZ the boundaries of each stripe are poorly delineated (Kuemerle et al., 1997) (see Fig. 5). However, because the mild alteration in ZebrinII patterning in the PZ of En2−/− mice is found in a lobule with a morphological defect (VIII), it was not known whether this mild change is because of the foliation defect or a fundamental role for En2 in regulating the pattern of the ML molecular code.
Figure 5.

ZebrinII molecular coding is sensitive to the dosage of En1/2. A–E, U–Y, Schematics illustrating the ZebrinII pattern in the anterior (A–E) and posterior (U–Y) lobules. The schematics show the general trends in morphological and molecular coding defects. F–T, ZebrinII molecular coding is altered in a dose dependent manner as seen on coronal cut tissue sections. In the AZ (F–J), the phenotypes range from weak lateral stripes (En2−/−), to all weak stripes (En1+/−;En2+/−), to extra stripes (En1flox/cre), and finally to a complete disorganization of stripes (En1+/−;En2−/−). The arrow in J points to a stripe with possible homology to the wild-type P1+ stripe (indicated as P1? due to its obscure identity in mutants with severe phenotypes). Similarly, in the PZ (K–T) of the mutants, the pattern of ZebrinII is progressively altered by En mutations. Tissue sections in K–O were taken from more caudal regions than those in P–T. The sagittal schematics on the right indicate the level of the coronal tissue sections. Solid red lines indicate ZebrinII stripe expression, whereas dotted red lines indicate “transition zones.” Scale bar (in F), 500 μm (applies to F–T).
Given our results in En1flox/cre mice, we used the ML stripe marker Hsp25 to examine whether molecular coding in the CZ and NZ of En2−/− mutant mice is altered. Strikingly, in En2−/− mutant mice only three Hsp25 immunoreactive stripes were detected in lobules VI/VII compared with the five that are normally seen (n = 8) (Fig. 2J). Furthermore, each stripe was wider than normal in En2−/− mutants (compare stripe #1 in Fig. 2A,J). Hsp25 molecular coding was also altered in the NZ of En2−/− mutant mice in which a substantial number of Hsp25 immunoreactive PCs were found in regions of lobule X that are normally Hsp25 negative (Fig. 2K). Moreover, in En2−/− mutants a large number of PCs ectopically expressed Hsp25 in the copula pyramidis (the lateral extension of lobule VIII) (Fig. 2L). These data have uncovered that proper patterning of the ML molecular code in the CZ and NZ is highly dependent on En2. Moreover, because the CZ and NZ in En2−/− mice have a relatively normal foliation pattern, the presence of obvious ML molecular coding defects provides additional evidence that patterning of the two coordinate systems are not interdependent. In addition, although both En1 and En2 mutant mice have global defects in ML molecular code patterning, mice lacking En1 have distinct defects from those that lack En2 and primarily in complementary zones to En2 defects.
Molecular coding defects in En mutants reflect synchronous changes in complementary Purkinje cell stripes
To examine whether the ZebrinII molecular coding changes in En1flox/cre mice are accompanied by complementary changes in the molecular code of the ZebrinII negative stripes, we examined the pattern of Plcβ4 (Sarna et al., 2006), which marks the ZebrinII negative PCs in the wild-type Cb (Fig. 3A–C,G–J). Strikingly, Plcβ4 remained complementary to ZebrinII in all lobules of En1flox/cre mice (Fig. 3D–F,K–N), and no PC somata or dendrites doubly expressing Plcβ4 and ZebrinII were observed when examined at high magnification (supplemental Fig. 4, available at www.jneurosci.org as supplemental material). Although the dendrites of rare Plcβ4 expressing PCs were present in the ZebrinII stripes, they did not express ZebrinII (supplemental Fig. 4, arrows, available at www.jneurosci.org as supplemental material). As expected by the more subtle ML changes in ZebrinII expression in En2−/− mutants, we only observed subtle changes in the pattern of Plcβ4 (data not shown) correlating with the ZebrinII changes in these mutants. These results suggested that in the AZ and PZ all components of the molecular code are altered in unison in En1flox/cre mutants.
To test whether the molecular identity of Hsp25 negative stripes in the CZ of En2−/− mutants also are altered in unison with Hsp25 positive stripes, we searched the Allen Brain Atlas (Lein et al., 2007) for a marker that selectively labels the Hsp25 negative stripes. Based on the data provided, Neurofilament heavy chain (Nfh) mRNA appeared to be expressed in stripes throughout the Cb, and in the CZ and NZ complementary to Hsp25. Indeed, direct comparison of Hsp25 and Nfh in the wild-type Cb demonstrated that the two genes have complementary expression patterns in the CZ and NZ (Fig. 4A–D) (data not shown). Interestingly, we found stronger expression of Nfh protein in the PC somata compared with the dendrites (compare expression in the Purkinje cell layer versus molecular layer in Fig. 4D). As with ZebrinII/Plcβ4 in En1flox/cre mutant mice, we found in En2−/− mutants that the changes in expression of Hsp25 were accompanied by complementary changes in the Nfh pattern, and thus, their relationship was preserved (Fig. 4E–H). This phenotype is unlike in Ebf2−/− mutant mice in which ZebrinII stripe organization is disrupted and the changes are in part due to some PCs taking on mixed ZebrinII+/Plcβ4+ phenotypes (Croci et al., 2006; Chung et al., 2008). Our data thus show that in En1flox/cre and En2−/− mutants the altered ML molecular coding involves PCs taking on distinct phenotypes as ZebrinII+/Plcβ4− or ZebrinII−/Plcβ4+ and Hsp25+/Nfh− or Hsp25−/Nfh+. Therefore, despite the clear changes in the overall pattern of stripes, based on our four ML stripe markers each PC maintains a specific molecular identity.
Molecular coding is exquisitely sensitive to the dosage of En1 and En2
Given that En1 and En2 mutants have distinct changes in the ML molecular code, we analyzed ML stripe gene expression in viable double mutants by creating an allelic series of En1/2 mutants. We first analyzed En1+/−;En2+/− mutants (n = 3) (Fig. 5H,M,R) which like En1flox/cre and En2−/− mice lack two En alleles but lack one copy of each gene. Compared with each single heterozygote that consistently has normal foliation, we have previously found that ∼85% of double heterozygotes have a mild foliation defect with a partial fusion of lobules I–III (Sgaier et al., 2007). Defects in ZebrinII expression in En1+/−;En2+/− mutants were more severe than those in En2−/− mutants but milder than those found in En1flox/cre mice. In the AZ of En1+/−;En2+/− mutants ZebrinII expression in each of the stripes was considerably weaker than in wild-type (Fig. 5F) or En2−/− mice (Fig. 5H), and in the PZ the normal pattern of ZebrinII was difficult to discern because there was ectopic ZebrinII expression in PC stripes that normally do not express the protein (Fig. 5M,R).
In the CZ of En1+/−;En2+/− mutants the medial three Hsp25 immunoreactive stripes were narrower than normal and the lateral stripe of the vermis was fragmented (Fig. 2G). Although a clear stripe pattern of Hsp25 was present in the NZ of En1+/−;En2+/− mutants, the single wide stripe in wild-type mice that traverses the midline was replaced by two narrow stripes located adjacent to the midline (Fig. 2H). Furthermore, because in En2−/− mutants, Hsp25 was ectopically expressed in the copula pyramidis, although less so (Fig. 2I).
We next analyzed En1+/−;En2−/− mutant mice to determine whether molecular coding is more severely affected when three En alleles are missing than in mutants lacking two alleles (Fig. 5J,O,T). As for En1flox/cre and En2−/− mutants the general cytoarchitecture and PC monolayer organization and density are normal in En1+/−;En2−/− mutants when compared with wild-type mice (supplemental Fig. 2, available at www.jneurosci.org as supplemental material). In the vermis of En1+/−;En2−/− mutants lobules I–V (AZ) are fused into one tiny lobule, lobules VI/VII are larger than normal for the overall size of the Cb, and only a shallow fissure separates lobules VIII and IX (PZ) (supplemental Fig. 1D) (Sgaier et al., 2007). The typical ZebrinII triplet found in the AZ of wild-type mice was not obvious in any of the serial sections examined from En1+/−;En2−/− mutant mice. Thus, the phenotype is more extreme than in En1flox/cre mutants. Instead, discontinuous, scanty stripes were observed and the pattern poorly resembled the pattern in wild type (n = 6) (Fig. 5A,F, E,J). Furthermore, whereas the PZ in wild-type mice has four alternating stripes of ZebrinII positive and negative expression on either side of the midline, En1+/−;En2−/− mutants had almost uniform expression of ZebrinII in the PZ. However, a variable number of thin, broken ZebrinII negative stripes were detected in the lateral vermis (Fig. 5K,P, O,T). As seen in En1flox/cre mutants, the pattern of Plcβ4 was altered in unison with ZebrinII in En1+/−;En2−/− mutants (Fig. 6), although the phenotype was more extreme. Plcβ4 positive cells were separated by fragmented ZebrinII stripes in the AZ (Fig. 6A,B). Although only a few Plcβ4 positive PCs complemented the almost uniform ZebrinII domain at the midline of the PZ (Fig. 6C,D, arrow), more laterally in the vermis narrow Plcβ4 stripes complemented the wider than normal ZebrinII stripes (Fig. 6D, inset). Because ML molecular coding defects in En1+/−;En2−/− mutants were more severe than those in En1flox/cre mutants or En2−/− mutants these data suggest some overlap in function of the two genes.
Figure 6.
ZebrinII and Plcβ4 molecular coding are altered in unison in En mutants with severe molecular coding defects. A, C, ZebrinII and Plcβ4 are expressed in complementary stripes in the AZ and PZ of wild-type mice. B, Although ML molecular coding is disrupted in En1+/−;En2−/− mutants, ZebrinII and Plcβ4 stripes remain complementary in the AZ and PZ. D, At the midline of lobule VIII, only a few Plcβ4 positive Purkinje cells were observed (arrow). The complementary relationship between ZebrinII and Plcβ4 in the PZ of En1+/−;En2−/− mutants can be appreciated in the more lateral regions of the vermis (inset). Scale bars, 250 μm (applies to all panels).
In En1+/−;En2−/− mutants the number of Hsp25 stripes in the CZ was reduced from five stripes to only three, as in En2−/− mutants (Fig. 2J), but the stripes were more fragmented (Fig. 2M) in all mutants. Furthermore, in the NZ the midline stripe was severely fragmented and there were ectopic Hsp25 stripes in the rostral region of the PZ (Fig. 2N, arrows, M). Surprisingly, compared with En2−/− mutants only few ectopic Hsp25 positive PCs were seen in the copula pyramidis (data not shown) of En1+/−;En2−/− mutants, perhaps because it is reduced in size (Fig. 2O, arrow). In summary, our analysis of En1/2 double mutants demonstrates that ML molecular coding in each of the four transverse zones is sensitive to the overall dosage of En1/2. Furthermore, the more severe defects that we observed in the double mutants compared with the single mutants reveals where the functions of the two En genes overlap.
The sensitivity of ML molecular coding to the dosages of En1 and En2 prompted us to determine whether a very modest decrease in their levels would be enough to cause detectable patterning alterations. To this end, we analyzed ZebrinII and Hsp25 expression in En1+/− and En2+/− mice. Indeed mild defects were seen in the AZ of En1+/− mutants (n = 4). Although the general organization of the AZ stripes was normal (Fig. 7A,B), similar to En1flox/cre mutants in lobules I–III the P1+ and P3+ ZebrinII positive stripes were broader (Fig. 7D,E; supplemental Fig. 5, available at www.jneurosci.org as supplemental material). In addition, in the PZ each ZebrinII stripe was more equal in width in En1+/− mutants and this phenotype was most pronounced in aVIII (Fig. 7G,H). Although five Hsp25 stripes were seen to occupy the CZ, immunonegative PCs were intermingled between them (Fig. 7J,K). In the NZ the Hsp25 pattern was more refined than normal with distinct boundaries between adjacent stripes (Fig. 7M,N). ZebrinII ML molecular coding appeared normal in only 1/5 En2+/− mice analyzed. In the other 4/5 animals each of the three ZebrinII positive stripes in the AZ was thinner than normal (Fig. 7C,F; supplemental Fig. 5, available at www.jneurosci.org as supplemental material). In the PZ the stripe boundaries were poorly delineated (Fig. 7I, arrow) and fewer ZebrinII positive PCs were detected in lobule pVIII (Fig. 7I, bracket). In contrast, the pattern of Hsp25 ML molecular coding in the NZ and CZ appeared normal in En2+/− mice (Fig. 7L,O). We quantified the difference in the number of ZebrinII immunoreactive PCs in the P1+ and P3+ stripes in lobule III for wild-type, En1+/−, and En2+/− mutants and found that indeed the observed qualitative alterations in stripe width were accompanied by a significant change in PC number (P1+ = 33 PCs ± 0.88 in wild type, 42 PCs ± 1.45 in En1+/−, and 25 PCs ± 0.66 in En2+/−, p < 6.81 × 10−05; P3+ = 46 PCs ± 1.53 in wild type, 52 PCs ± 2.60 in En1+/−, and 31 PCs ± 1.76 in En2+/−, p < 8.65 × 10−04). Because En1+/− and En2+/− mutants have normal foliation (supplemental Fig. 1, available at www.jneurosci.org as supplemental material) and normal cytoarchitecture (supplemental Fig. 2, available at www.jneurosci.org as supplemental material), an increase in the number of ZebrinII immunoreactive PCs represents broader stripes (En1+/−) and a decrease represents narrower stripes (En2+/−). In summary deleting a single copy of En1 or En2 results in subtle stripe defects that are mild versions of the complete loss-of-function mutations in each gene. These experiments thus demonstrate that ML molecular coding is exquisitely sensitive to the dose of both En1 and En2.
Figure 7.
Molecular coding is sensitive to heterozygous deletions of En1 and En2. A, D, G, ZebrinII expression in the AZ (A, D) and PZ (G) of a wild-type mouse. B, E, H, ZebrinII expression in the AZ (B, E) and PZ (H) of an En1+/− mutant. C, F, I, ZebrinII expression in the AZ (C, F) and PZ (I) of an En2+/− mutant. J, M, Hsp25 expression in the CZ (J) and NZ (M) of a wild-type mouse. K, N, Hsp25 expression in the CZ (K) and NZ (N) of an En1+/− mutant. L, O, Hsp25 expression in the CZ (L) and NZ (O) of an En2+/− mutant. The arrows in D, E, and F point to the increased thickness of P3+ in En1+/− mutants and decreased thickness of P3+ in En2+/− mutants compared with wild-type mice. The arrow in I points to a poorly delineated border of a ZebrinII positive stripe in the PZ of an En2+/− mutant and the inverted bracket indicates the sparse P2+ stripe in pVIII. The slanted black lines in the schematics illustrate the level of where the coronal cut tissue sections were taken. The red outline indicates lobules with ZebrinII stripe expression and the blue outline indicates lobules with Hsp25 stripe expression. The dotted red lines indicate “transition zones.” Scale bar, 500 μm (applies to all panels).
En1/2 are required for restricting molecular code patterns to distinct anterior–posterior transverse zones
In the CZ of wild-type mice ZebrinII is expressed in most PCs of lobules VII and pVI, whereas in aVI two immunonegative stripes are found adjacent to the midline (Fig. 8A) (Ozol et al., 1999; Sillitoe and Hawkes, 2002). Plcβ4 is expressed in a complementary manner in the CZ (Fig. 8B,C). Interestingly, many ZebrinII negative and Plcβ4 positive stripes were observed throughout lobule VI of En1+/−;En2−/− mice without an obvious conserved pattern between mutants (Fig. 8D,E, arrows, F). Thus, in addition to severe patterning alterations in the ML axis, we found that En1+/−;En2−/− mice have obvious molecular coding defects that cross transverse zone boundaries in the AP axis.
Figure 8.
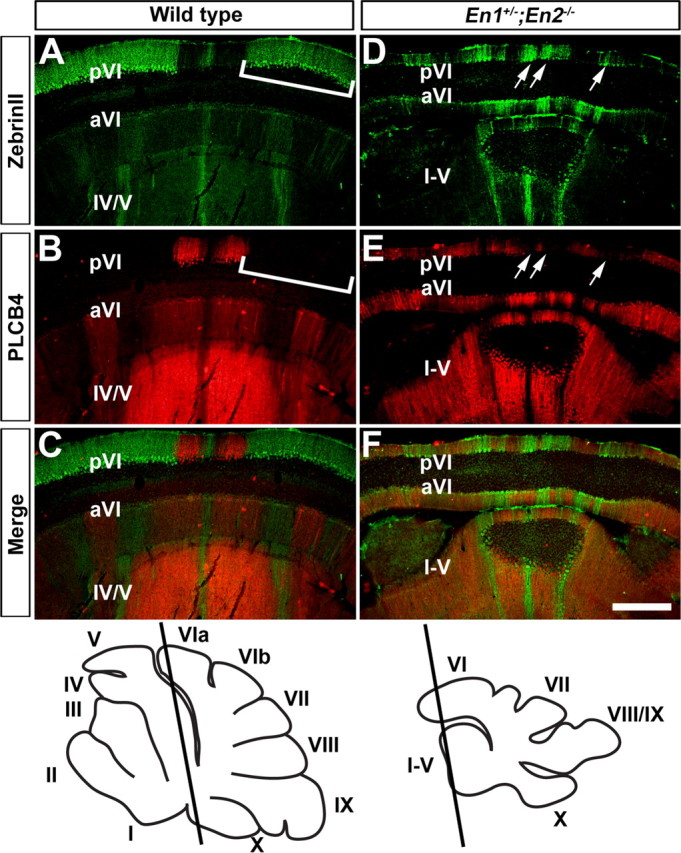
En1/2 are critical for restricting ZebrinII stripes to the AZ and PZ. A, ZebrinII is expressed in most Purkinje cells in lobule pVI of the CZ (inverted bracket). B, C, The lack of Plcβ4 expression (inverted bracket in B) reflects its complementary pattern to ZebrinII. D–F, In En1+/−;En2−/− mutants, both ZebrinII and Plcβ4 are expressed in ML stripes in lobule pVI (arrows in D and E), and despite this alteration in the ML patterns, their complementary relationship is preserved (F). The slanted black lines in the schematics illustrate the level of where the coronal cut tissue sections were taken. Scale bar, 500 μm (applies to all panels).
En1 and En2 proteins are not functionally equivalent
The difference in phenotypes in mice with loss-of-function mutations in either En1 or En2 could be because the genes have nonoverlapping gene expression domains or because the two proteins are not functionally equivalent. To distinguish between these possibilities we directly compared the functions of En1 and En2 proteins during patterning of the ML molecular code by analyzing mice in which En2 is expressed in place of En1 and En2 is not expressed from the endogenous locus (Fig. 9). Using this sensitive genetic assay that combines knock-in alleles with null alleles we recently demonstrated that in mice expressing En2 from only one En1 allele (En12ki/−;En2−/−) most of the foliation defects seen in En1+/−;En2−/− mutants are rescued (Sgaier et al., 2007) (see Fig. 10B). The rescue of foliation by En2 indicates En2 is dominant over En1 in foliation. If the two En proteins are equivalent during patterning of the ML molecular code then replacement of En1 with En2 in En1+/−;En2−/− mutants (En12ki/−;En2−/− mice) should result in the same defects in both mutants. Analysis of the ML molecular code revealed that in contrast to the rescue of foliation by En2 (Sgaier et al., 2007; data not shown), ML molecular coding continued to be severely disrupted in En12ki/−;En2−/− mutants (n = 3), and some defects were more extreme than in En1+/−;En2−/− mutants. In the AZ all stripes were thin, fragmented, and distributed asymmetrically about the midline of the Cb (Fig. 9A,B,D,E). In addition, compared with wild-type mice in which ZebrinII positive PCs are stained with equal intensity (compare P1 and P3 in Fig. 9A), in En12ki/−;En2−/− mutants there was variation in the intensity of ZebrinII PC staining (compare P1 and P3 in Fig. 9B) and in general the intensity was lower than in En1+/−;En2−/− mutants. Strikingly, ZebrinII was expressed in ML stripes in lobule VII in addition to lobule VI of the CZ (Fig. 9E, inset). In the PZ the stripe pattern was replaced by a uniform domain of ZebrinII positive PCs spanning across the midline of the vermis, and like in the AZ, some PCs were weakly stained (Fig. 9G,H). In the CZ, Hsp25 was expressed in three poorly resolved stripes (Fig. 9J,K), and in the NZ the width of each stripe was modestly reduced (Fig. 9M,N). Cumulatively, the disruption in the global pattern of ML molecular coding in En12ki/−;En2−/− mutants is a more extreme version of the patterning defects in En1+/−;En2−/− mutants. These data further indicate that although there is some overlap in the functions of En1 and En2, En1 and En2 proteins are not equivalent.
Figure 9.

En1 and En2 proteins are not functionally equivalent during patterning of the ML molecular code. A, D, G, ZebrinII expression in the AZ (A, D) and PZ (G) of a wild-type mouse. B, E, H, ZebrinII expression in the AZ (B, E) and PZ (H) of an En12ki/−;En2−/− mutant. C, F, I, ZebrinII expression in the AZ (C, F) and PZ (I) of an En12ki/2ki;En2−/− mutant. J, M, Hsp25 expression in the CZ (J) and NZ (M) of a wild-type mouse. K, N, Hsp25 expression in the CZ (K) and NZ (N) of an En12ki/−;En2−/− mutant. L, O, Hsp25 expression in the CZ (L) and NZ (O) of an En12ki/2ki;En2−/− mutant. The arrows in B, C, and F point to ectopic ZebrinII stripes in the AZ, and the asterisks in E and F point to ectopic ZebrinII stripes in the CZ of the mutants. The fragmented ZebrinII P1+ stripe in the AZ, the poorly resolved P1+ stripe in the PZ, and the ambiguous midline Hsp25 stripe in the CZ are difficult to discern in En12ki/−;En2−/− mutants (labeled as P1? and 1?). See Figure 10B for sagittal schematics and Sgaier et al. (2007) for histological staining of En12ki/2ki;En2−/− and En12ki/−;En2−/− mutants. See the schematics in Figure 7 for the transverse zone distribution of ZebrinII and Hsp25 expression in wild-type mice. Scale bar, 500 μm (applies to all panels).
Figure 10.

En1 and En2 have different functions during patterning of the two coordinate systems. A, Schematics representing coronal cut tissue sections taken through the vermis of wild-type and En1/2 mutant cerebella and arranged in increasing order of severity in ML molecular coding defects. The top row represents the vermis pattern of ZebrinII in lobule III of the AZ, and the bottom row represents the vermis pattern of Hsp25 in lobules VI/VII of the CZ. B, Sagittal schematics representing the En1/2 allelic series of mutants arranged in increasing order of severity in foliation defects.
To further examine the degree to which En1 and En2 proteins have similar functions in ML molecular code patterning in all zones we analyzed En12ki/2ki;En2−/− mutants in which the vermis foliation pattern is indistinguishable from wild-type mice (Sgaier et al., 2007). As predicted, in En12ki/2ki;En2−/− mutants (n = 3) ZebrinII, Plcβ4, and Hsp25 expression patterns were in part distinct from those in En1+/+;En2−/− mice. Although three distinct ZebrinII stripes were detected in lobules I–V of the AZ (Fig. 9C), there were ectopic “P2+” stripes that were similar to those in En1flox/cre mutants (although less prominent) (Fig. 9C,F, arrows). Furthermore, like En1+/−;En2−/− mutants the CZ contained an array of ZebrinII stripes in lobule VI (Fig. 9F, asterisks). In contrast, in the PZ the ZebrinII stripe pattern had aspects of both the En2−/− and En1flox/cre phenotypes (e.g., P3+) (Fig. 9I). Like En1flox/cre, on one side of aVIII the ZebrinII stripes were broad whereas on the other side of the midline the stripe boundaries were poorly delineated and reminiscent to those in En2−/− mice. In the CZ the defects in En12ki/2ki;En2−/− mutants were similar to in En1+/+;En2−/− mutants with only three stripes present and with the lateral ones being wider than normal, and the midline stripe being reduced in width (Fig. 9L). Although the NZ was only mildly affected, compared with En2−/− mutants which have excess staining in lobule X each stripe was reduced in width as in En1+/−;En2−/− mutants, and there was no Hsp25 immunoreactive PCs in the copula pyramidis (Fig. 9O; data not shown).
Finally, similar to our other En mutants, the pattern of Plcβ4 in the knock-in mutants remained complementary to ZebrinII (data not shown). Compared with En1+/+;En2−/− mutants, the global pattern of ML molecular coding is more severely affected in En12ki/2ki;En2−/− mutants with aspects of the En2−/−, En1flox/cre, and En1+/−;En2−/− phenotypes. En2 cannot fully replace En1 in the AZ or CZ in regulating ZebrinII expression, but can partially replace En1 in the PZ. En2 cannot restore normal expression of Hsp25 in the CZ of En2−/− mutants when expressed from the En1 locus, suggesting En1 is not expressed in the cells in which En2 is necessary for molecular coding. En2 can however partially restore Hsp25 expression in the NZ when expressed from the En1 locus in En2−/− mutants.
Discussion
By systematically decreasing or altering the expression of the En genes in the mouse Cb we have discovered that the En transcription factors encode positional information that is required for proper organization of the molecular properties of the Cb (ML molecular coding) in addition to specific anatomical divisions of the Cb (lobules), and moreover that the two are patterned independently. We also established that En1 is required after ∼E9 (and therefore, after the Cb primordium is specified) for proper patterning of the ML molecular code but not foliation. Furthermore, our studies demonstrate that ML molecular coding is exquisitely sensitive to the overall levels of En1/2, and that each En gene has predominant functions in two of the four AP zones. One possibility is that En1/2 pattern the two coordinate systems by setting up common positional cues that are independently used by each system. En1/2 could then regulate patterning of foliation and the ML molecular code in different cell types, with embryonic stripes of En expression being necessary for patterning the ML molecular code. Thus, we propose that the adult lobules and the global ML molecular code represent a “read out” of Cb transcription factor patterning.
En1 and En2 function in independent pathways that pattern each coordinate system in the cerebellum
A number of studies have demonstrated a critical role for En1 and En2 in producing a normal pattern of Cb lobules in the AP axis (Joyner et al., 1991; Millen et al., 1994; Bilovocky et al., 2003; Sgaier et al., 2007). In the current investigation we have uncovered a second critical function for En1 and En2 in Cb patterning, that of the ML molecular code in the vermis. Unlike the foliation phenotypes, each En single mutant has severe changes in the patterns of ZebrinII/Plcβ4 or Hsp25/Nfh. As with foliation, in double En1/2 mutants the changes are enhanced and extreme in all zones of the vermis. Three results argue that patterning of the lobules and molecular coding are regulated by independent mechanisms: (1) Although lobules are patterned properly in the vermis of many En1flox/cre mutants and all En12ki/2ki;En2−/− mutants, severe defects in ML molecular coding are consistently found along the entire AP axis, (2) In En2−/− mice lobules with subtle morphological defects have dramatically altered ML molecular coding, (3) the severity of changes in lobule patterning and ML molecular coding to alterations in En1/2 dosage do not correlate (see below). Thus, we have uncovered dual functions for En1 and En2 in setting up the two primary axes of the Cb by coordinating the proper positioning of the lobules and molecular codes.
En1 and En2 represent a specialized class of genes required for patterning the ML molecular code
In several spontaneous mutant mouse strains that have a small Cb, including Lurcher (Tano et al., 1992; Armstrong et al., 2005), Cerebellar deficient folia (Beierbach et al., 2001), Weaver (Eisenman et al., 1998), and Reeler (Edwards et al., 1994), changes in the pattern of ZebrinII have been reported. However the changes are due to alterations in PC cytoarchitecture and not changes in PC gene expression. In contrast, we found that patterning of the ML molecular code is globally affected in all En mutants analyzed although cytoarchitecture is not disrupted including a monolayer of PCs with normal density (supplemental Fig. 2, available at www.jneurosci.org as supplemental material). Indeed it was previously shown that the lower number of PCs in En2−/− mutants is uniform across all lobules (Kuemerle et al., 1997) and likely results from a decrease in the size of the Cb primordium before PCs are generated (Sgaier et al., 2007). Thus, En1/2 mutant mice have bonafide, global changes in the ML molecular code independent of their earlier role in generating the Cb progenitor pool. If a specific subsets(s) of PCs progenitors were affected by reduced En function early, we would expect to see a specific reduction in particular adult ML molecular domains in our En mutants and thus an overall decrease in the number of stripes because PCs born on a specific day occupy distinct stripes in the adult (Hashimoto and Mikoshiba, 2003). However, we found the exact opposite in that the number of ZebrinII ML molecular domains is increased in En1flox/cre, En12ki/2ki;En2−/− and En12ki/−;En2−/− mutants. Our engineered En1/2 mutants thus represent a new class of Cb mutants that show molecular changes in the absence of obvious cellular pathology. Furthermore, our finding that the En genes are expressed in the Cb and not the neurons of the afferent sources is consistent with a previous in vitro experiment showing that ML gene expression can initiate with a fairly normal pattern (albeit delayed) in organ cultures of E14 mouse Cb in the absence of extrinsic signals (Oberdick et al., 1993). We therefore conclude that genetic cues intrinsic to the Cb are sufficient to pattern the ML molecular code, and that En1/2 are fundamental to patterning the ML molecular code. Intriguingly, this function of En transcription factors seems to be conserved across species, as engrailed, a “selector gene,” is critical for establishing segmental gene expression in the fly (Biggin and McGinnis, 1997).
ML molecular code patterning is more sensitive that foliation to the dosage of En1 and En2
Our studies have defined yet another critical function in brain development that is sensitive to the total dose of the two En genes. However, unlike specification of the Cb and production of dopaminergic neurons that rely primarily on En1 or foliation that is dominated by En2 (Hanks et al., 1995; Simon et al., 2001; Sgaier et al., 2007), we found molecular coding is very sensitive to the does of both genes. We observed the following increase in the severity of ML molecular coding defects in lobules of the AZ and PZ: wild type < En2+/− < En1+/− < En2−/− < En1+/−;En2+/− < En12ki/2ki;En2−/− < En1flox/cre < En1+/−;En2−/− ∼ En12ki/−;En2−/− mutant mice (Fig. 10A). In contrast, in the CZ En2 is dominant over En1 (Fig. 10A) and in the NZ the two genes are more equal. These results show both that the En genes regulate molecular coding in a sensitive dose dependent manner, and also highlights different requirements for each gene in the four transverse zones. Although foliation is also dose dependent, it is in a manner distinct from ML molecular code patterning with En2 playing a more prominent role in all lobules (wild type = En2+/− = En1+/− = En12ki/2ki;En2−/− < En1flox/cre ∼En1+/−;En2+/− < En12ki/−;En2−/− ∼En2−/− < En1+/−;En2−/− (Sgaier et al., 2007) (Fig. 10B). Finally, our observation that in En mutants with normal foliation (e.g., En12ki/2ki;En2−/−) ML molecular coding is drastically altered shows that patterning of the ML molecular code is more sensitive than foliation to En gene dosage.
En1/2 are required for restricting molecular code patterns to distinct anterior–posterior transverse zones
Using a mouse genetics approach we have shown that En1 and En2 regulate the pattern of ML molecular coding within each of the four transverse zones. In addition, the presence of ZebrinII stripes in the CZ of En1+/−;En2−/−, En12ki/−;En2−/−, and En12ki/2ki;En2−/− mutants provides evidence that the En genes are also required to restrict ZebrinII/Plcβ4 stripe expression to only two specific AP zones. Because each zone seems to be preferentially sensitive to En1 versus En2 mutations, our data suggest that inherent, fundamental differences exist within the molecular makeup of each transverse zone. If this is true, En1 and En2 might regulate different molecular cues within each zone. Because the zones develop at different rates (Sudarov and Joyner, 2007), these cues could be spatially and temporally unique and would set in motion distinct developmental timetables within each zone.
En1 and En2 proteins have distinct functions during ML molecular code patterning
We exploited an En1 knock-in allele to address whether the different requirements for En1 and En2 in ML molecular code patterning in each transverse zone are because of differences in proteins function or gene expression. Although En1+/−;En2−/− mutant mice have severe foliation defects that are prominent in the AZ and PZ, the foliation defects are largely rescued when En1 is replaced with En2 in such mutants (En12ki/−;En2−/−) (Sgaier et al., 2007) (Fig. 10B). In contrast to foliation, we found the ZebrinII, Plcβ4, and Hsp25 molecular coding defects seen in En12ki/−;En2−/− mutants were similar to En1+/−;En2−/− mutants, although even worse in the CZ but less extreme in the NZ. Unlike any other mutant reported in the literature, we detected ZebrinII stripes throughout lobules VI and VII of En12ki/−;En2−/− mutants. Furthermore, even when both copies of En1 are replaced by En2 (En12ki/2ki;En2−/−) the ML molecular coding defects are only partially rescued and not as normal as those seen in En1+/+;En2−/− mice in all but the CZ. Our results suggest that the distinct phenotypes of En1 and En2 single mutants are because of differences in both gene expression and protein function because En2 can compensate for En1 in some but not all aspect of ML molecular code patterning. Moreover, our analysis of En1flox/cre and En2−/− mutant mice suggests that in general, En1 is required in the AZ and PZ for restricting ZebrinII expression to specific stripes whereas En2 is required for promoting ZebrinII expression in the stripes. In the CZ En2 promotes formation of five rather than three Hsp25 stripes, but is also required for homogeneous, rather than striped expression of ZebrinII in this zone. The global number of stripes and the width and intensity of each stripe in the ML molecular code are thus dependent on a balance between the functions of both En proteins.
Footnotes
This work was supported by a grant from Autism Speaks. R.V.S. received support from the Alberta Heritage Foundation For Medical Research. We thank Richard Hawkes, Sandra Blaess, Anamaria Sudarov, Praveen Raju, Grant Orvis, and Stewart Anderson for critical reading of this manuscript.
References
- Ahn AH, Dziennis S, Hawkes R, Herrup K. The cloning of zebrin II reveals its identity with aldolase C. Development. 1994;120:2081–2090. doi: 10.1242/dev.120.8.2081. [DOI] [PubMed] [Google Scholar]
- Armstrong CL, Krueger AM, Currie RW, Hawkes R. Constitutive expression of the 25 kDa heat shock protein Hsp25 reveals novel parasagittal bands of Purkinje cells in the adult mouse cerebellar cortex. J Comp Neurol. 2000;416:383–397. doi: 10.1002/(sici)1096-9861(20000117)416:3<383::aid-cne9>3.0.co;2-m. [DOI] [PubMed] [Google Scholar]
- Armstrong CL, Vogel MW, Hawkes R. Development of Hsp25 expression compartments is not constrained by Purkinje cell defects in the Lurcher mouse mutant. J Comp Neurol. 2005;491:69–78. doi: 10.1002/cne.20703. [DOI] [PubMed] [Google Scholar]
- Attwell PJ, Rahman S, Ivarsson M, Yeo CH. Cerebellar cortical AMPA-kainate receptor blockade prevents performance of classically conditioned nictitating membrane responses. J Neurosci. 1999;19:RC45. doi: 10.1523/JNEUROSCI.19-24-j0003.1999. [DOI] [PMC free article] [PubMed] [Google Scholar]
- Baader SL, Vogel MW, Sanlioglu S, Zhang X, Oberdick J. Selective disruption of “late onset” sagittal banding patterns by ectopic expression of engrailed-2 in cerebellar Purkinje cells. J Neurosci. 1999;19:5370–5379. doi: 10.1523/JNEUROSCI.19-13-05370.1999. [DOI] [PMC free article] [PubMed] [Google Scholar]
- Beierbach E, Park C, Ackerman SL, Goldowitz D, Hawkes R. Abnormal dispersion of a Purkinje cell subset in the mouse mutant cerebellar deficient folia (cdf) J Comp Neurol. 2001;436:42–51. [PubMed] [Google Scholar]
- Biggin MD, McGinnis W. Regulation of segmentation and segmental identity by Drosophila homeoproteins: the role of DNA binding in functional activity and specificity. Development. 1997;124:4425–4433. doi: 10.1242/dev.124.22.4425. [DOI] [PubMed] [Google Scholar]
- Bilovocky NA, Romito-DiGiacomo RR, Murcia CL, Maricich SM, Herrup K. Factors in the genetic background suppress the engrailed-1 cerebellar phenotype. J Neurosci. 2003;23:5105–5112. doi: 10.1523/JNEUROSCI.23-12-05105.2003. [DOI] [PMC free article] [PubMed] [Google Scholar]
- Brochu G, Maler L, Hawkes R. Zebrin II: a polypeptide antigen expressed selectively by Purkinje cells reveals compartments in rat and fish cerebellum. J Comp Neurol. 1990;291:538–552. doi: 10.1002/cne.902910405. [DOI] [PubMed] [Google Scholar]
- Chen G, Hanson CL, Ebner TJ. Functional parasagittal compartments in the rat cerebellar cortex: an in vivo optical imaging study using neutral red. J Neurophysiol. 1996;76:4169–4174. doi: 10.1152/jn.1996.76.6.4169. [DOI] [PubMed] [Google Scholar]
- Chockkan V, Hawkes R. Functional and antigenic maps in the rat cerebellum: zebrin compartmentation and vibrissal receptive fields in lobule IXa. J Comp Neurol. 1994;345:33–45. doi: 10.1002/cne.903450103. [DOI] [PubMed] [Google Scholar]
- Chung SH, Marzban H, Croci L, Consalez GG, Hawkes R. Purkinje cell subtype specification in the cerebellar cortex: early B-cell factor 2 acts to repress the zebrin II-positive Purkinje cell phenotype. Neuroscience. 2008;153:721–732. doi: 10.1016/j.neuroscience.2008.01.090. [DOI] [PubMed] [Google Scholar]
- Croci L, Chung SH, Masserdotti G, Gianola S, Bizzoca A, Gennarini G, Corradi A, Rossi F, Hawkes R, Consalez GG. A key role for the HLH transcription factor EBF2COE2, O/E-3 in Purkinje neuron migration and cerebellar cortical topography. Development. 2006;133:2719–2729. doi: 10.1242/dev.02437. [DOI] [PubMed] [Google Scholar]
- Davis CA, Noble-Topham SE, Rossant J, Joyner AL. Expression of the homeo box-containing gene En-2 delineates a specific region of the developing mouse brain. Genes Dev. 1988;2:361–371. doi: 10.1101/gad.2.3.361. [DOI] [PubMed] [Google Scholar]
- Ebner TJ, Chen G, Gao W, Reinert K. Optical imaging of cerebellar functional architectures: parallel fiber beams, parasagittal bands and spreading acidification. Prog Brain Res. 2005;148:125–138. doi: 10.1016/S0079-6123(04)48011-X. [DOI] [PubMed] [Google Scholar]
- Edwards MA, Leclerc M, Crandall JE, Yamamoto M. Purkinje cell compartments in the reeler mutant mouse as revealed by Zebrin II and 90-acetylated glycolipid antigen expression. Anat Embryol (Berl) 1994;190:417–428. doi: 10.1007/BF00235488. [DOI] [PubMed] [Google Scholar]
- Eisenman LM, Gallagher E, Hawkes R. Regionalization defects in the weaver mouse cerebellum. J Comp Neurol. 1998;394:431–444. [PubMed] [Google Scholar]
- Gincel D, Regan MR, Jin L, Watkins AM, Bergles DE, Rothstein JD. Analysis of cerebellar Purkinje cells using EAAT4 glutamate transporter promoter reporter in mice generated via bacterial artificial chromosome-mediated transgenesis. Exp Neurol. 2007;203:205–212. doi: 10.1016/j.expneurol.2006.08.016. [DOI] [PubMed] [Google Scholar]
- Hallem JS, Thompson JH, Gundappa-Sulur G, Hawkes R, Bjaillie JG, Bower JM. Spatial correspondence between tactile projection patterns and the distribution of the antigenic Purkinje cell markers anti-zebrin I and anti-zebrin II in the cerebellar folium crus IIa of the rat. Neuroscience. 1999;93:1083–1094. doi: 10.1016/s0306-4522(99)00144-x. [DOI] [PubMed] [Google Scholar]
- Hanks M, Wurst W, Anson-Cartwright L, Auerbach AB, Joyner AL. Rescue of the En-1 mutant phenotype by replacement of En-1 with En-2. Science. 1995;269:679–682. doi: 10.1126/science.7624797. [DOI] [PubMed] [Google Scholar]
- Hashimoto M, Mikoshiba K. Mediolateral compartmentalization of the cerebellum is determined on the “birth date” of Purkinje cells. J Neurosci. 2003;23:11342–11351. doi: 10.1523/JNEUROSCI.23-36-11342.2003. [DOI] [PMC free article] [PubMed] [Google Scholar]
- Joyner AL, Herrup K, Auerbach BA, Davis CA, Rossant J. Subtle cerebellar phenotype in mice homozygous for a targeted deletion of the En-2 homeobox. Science. 1991;251:1239–1243. doi: 10.1126/science.1672471. [DOI] [PubMed] [Google Scholar]
- Kimmel RA, Turnbull DH, Blanquet V, Wurst W, Loomis CA, Joyner AL. Two lineage boundaries coordinate vertebrate apical ectodermal ridge formation. Genes Dev. 2000;14:1377–1389. [PMC free article] [PubMed] [Google Scholar]
- Kuemerle B, Zanjani H, Joyner A, Herrup K. Pattern deformities and cell loss in Engrailed-2 mutant mice suggest two separate patterning events during cerebellar development. J Neurosci. 1997;17:7881–7889. doi: 10.1523/JNEUROSCI.17-20-07881.1997. [DOI] [PMC free article] [PubMed] [Google Scholar]
- Larsell O. The morphogenesis and adult pattern of the lobules and fissures of the cerebellum of the white rat. J Comp Neurol. 1952;97:281–356. doi: 10.1002/cne.900970204. [DOI] [PubMed] [Google Scholar]
- Larsell O. Minneapolis: University of Minnesota; 1970. The comparative anatomy and histology of the cerebellum from monotremes through apes. [Google Scholar]
- Lein ES, Hawrylycz MJ, Ao N, Ayres M, Bensinger A, Bernard A, Boe AF, Boguski MS, Brockway KS, Byrnes EJ, Chen L, Chen L, Chen TM, Chin MC, Chong J, Crook BE, Czaplinska A, Dang CN, Datta S, Dee NR, et al. Genome-wide atlas of gene expression in the adult mouse brain. Nature. 2007;445:168–176. doi: 10.1038/nature05453. [DOI] [PubMed] [Google Scholar]
- Marzban H, Chung S, Watanabe M, Hawkes R. Phospholipase Cβ4 expression reveals the continuity of cerebellar topography through development. J Comp Neurol. 2007;502:857–871. doi: 10.1002/cne.21352. [DOI] [PubMed] [Google Scholar]
- Millen KJ, Wurst W, Herrup K, Joyner AL. Abnormal embryonic cerebellar development and patterning of postnatal foliation in two mouse Engrailed-2 mutants. Development. 1994;120:695–706. doi: 10.1242/dev.120.3.695. [DOI] [PubMed] [Google Scholar]
- Millen KJ, Hui CC, Joyner AL. A role for En-2 and other murine homologues of Drosophila segment polarity genes in regulating positional information in the developing cerebellum. Development. 1995;121:3935–3945. doi: 10.1242/dev.121.12.3935. [DOI] [PubMed] [Google Scholar]
- Oberdick J, Schilling K, Smeyne RJ, Corbin JG, Bocchiaro C, Morgan JI. Control of segment-like patterns of gene expression in the mouse cerebellum. Neuron. 1993;10:1007–1018. doi: 10.1016/0896-6273(93)90050-2. [DOI] [PubMed] [Google Scholar]
- Ozol K, Hayden JM, Oberdick J, Hawkes R. Transverse zones in the vermis of the mouse cerebellum. J Comp Neurol. 1999;412:95–111. [PubMed] [Google Scholar]
- Peeters RR, Verhoye M, Vos BP, Van Dyck D, Van Der Linden A, De Schutter E. A patchy horizontal organization of the somatosensory activation of the rat cerebellum demonstrated by functional MRI. Eur J Neurosci. 1999;11:2720–2730. doi: 10.1046/j.1460-9568.1999.00687.x. [DOI] [PubMed] [Google Scholar]
- Sarna JR, Marzban H, Watanabe M, Hawkes R. Complementary stripes of phospholipase Cβ3 and Cβ4 expression by Purkinje cell subsets in the mouse cerebellum. J Comp Neurol. 2006;496:303–313. doi: 10.1002/cne.20912. [DOI] [PubMed] [Google Scholar]
- Schonewille M, Luo C, Ruigrok TJ, Voogd J, Schmolesky MT, Rutteman M, Hoebeek FE, De Jeu MT, De Zeeuw CI. Zonal organization of the mouse flocculus: physiology, input, and output. J Comp Neurol. 2006;497:670–682. doi: 10.1002/cne.21036. [DOI] [PubMed] [Google Scholar]
- Scott TG. A unique pattern of localization within the cerebellum. Nature. 1963;200:793. doi: 10.1038/200793a0. [DOI] [PubMed] [Google Scholar]
- Sgaier SK, Millet S, Villanueva MP, Berenshteyn F, Song C, Joyner AL. Morphogenetic and cellular movements that shape the mouse cerebellum; insights from genetic fate mapping. Neuron. 2005;45:27–40. doi: 10.1016/j.neuron.2004.12.021. [DOI] [PubMed] [Google Scholar]
- Sgaier SK, Lao Z, Villanueva MP, Berenshteyn F, Stephen D, Turnbull RK, Joyner AL. Genetic subdivision of the tectum and cerebellum into functionally related regions based on differential sensitivity to Engrailed proteins. Development. 2007;134:2325–2335. doi: 10.1242/dev.000620. [DOI] [PMC free article] [PubMed] [Google Scholar]
- Sillitoe RV, Hawkes R. Whole-mount immunohistochemistry: a high-throughput screen for patterning defects in the mouse cerebellum. J Histochem Cytochem. 2002;50:235–244. doi: 10.1177/002215540205000211. [DOI] [PubMed] [Google Scholar]
- Sillitoe RV, Joyner AL. Morphology, molecular codes, and circuitry produce the three-dimensional complexity of the cerebellum. Annu Rev Cell Dev Biol. 2007;23:549–577. doi: 10.1146/annurev.cellbio.23.090506.123237. [DOI] [PubMed] [Google Scholar]
- Sillitoe RV, Benson MA, Blake DJ, Hawkes R. Abnormal dysbindin expression in cerebellar mossy fiber synapses in the mdx mouse model of Duchenne muscular dystrophy. J Neurosci. 2003;23:6576–6585. doi: 10.1523/JNEUROSCI.23-16-06576.2003. [DOI] [PMC free article] [PubMed] [Google Scholar]
- Sillitoe RV, Marzban H, Larouche M, Zahedi S, Affanni J, Hawkes R. Conservation of the architecture of the anterior lobe vermis of the cerebellum across mammalian species. Prog Brain Res. 2005;148:283–297. doi: 10.1016/S0079-6123(04)48022-4. [DOI] [PubMed] [Google Scholar]
- Simon HH, Saueressig H, Wurst W, Goulding MD, O'Leary DD. Fate of midbrain dopaminergic neurons controlled by the engrailed genes. J Neurosci. 2001;21:3126–3134. doi: 10.1523/JNEUROSCI.21-09-03126.2001. [DOI] [PMC free article] [PubMed] [Google Scholar]
- Sudarov A, Joyner AL. Cerebellum morphogenesis: the foliation pattern is orchestrated by multi-cellular anchoring centers. Neural Develop. 2007;2:26. doi: 10.1186/1749-8104-2-26. [DOI] [PMC free article] [PubMed] [Google Scholar]
- Tano D, Napieralski JA, Eisenman LM, Messer A, Plummer J, Hawkes R. Novel developmental boundary in the cerebellum revealed by zebrin expression in the lurcher (Lc/+) mutant mouse. J Comp Neurol. 1992;323:128–136. doi: 10.1002/cne.903230111. [DOI] [PubMed] [Google Scholar]
- Voogd J. Assen: Van Gorcum; 1964. The cerebellum of the cat. Structure and fiber connections. [Google Scholar]
- Wurst W, Auerbach AB, Joyner AL. Multiple developmental defects in Engrailed-1 mutant mice: an early mid-hindbrain deletion and patterning defects in forelimbs and sternum. Development. 1994;120:2065–2075. doi: 10.1242/dev.120.7.2065. [DOI] [PubMed] [Google Scholar]