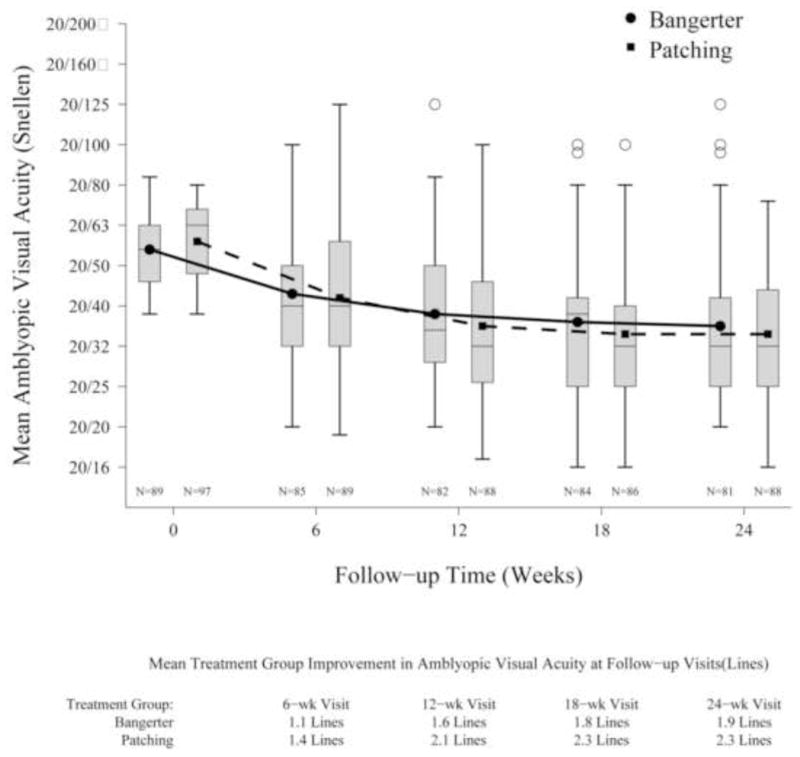
Figure 3. Mean Visual Acuity in Amblyopic Eyes from Baseline to 24 Weeks.

At each time point, the box on the left is the distribution of amblyopic eye visual acuity scores for the Bangerter group and the one on the right represents the patching group. The top and bottom of each box represents the 25th and 75th percentiles of the data and the line in the box is the median. The treatment group means are represented by a dot (Bangerter) or a square (patching) and are connected across the visits with lines. The bars extending above and below each box represent 1.5 times the interquartile range (difference between the 25th and 75th percentiles), and the open circles are outlier values.
