

Abstract
Background
Cells respond to stress stimuli through a number of response pathways, of which one of the most important and well characterized is the unfolded protein response. Despite a large body of work which suggests that stress in erythroblasts may play a pivotal role in the pathogenesis of β-thalassemia/Hb E disease, this pathway remains uninvestigated.
Design and Methods
Day 10 erythroblasts from normal controls and β-thalassemia/Hb E patients were subjected to internal (treatment with tunicamycin) and external (serum and growth factor withdrawal) stress stimuli and the activation of the unfolded protein response pathway was investigated.
Results
Normal erythroblasts responded to both internal and external stress by activating the unfolded protein response (UPR) pathway while in contrast, erythroblasts from β-thalassemia/Hb E patients only showed activation of the unfolded protein response pathway in response to internal stress. This was reflected by a markedly increased induction of apoptosis in serum and growth factor deprived β-thalassemia/Hb E erythroblasts as compared to control cells. Modulation of the levels of intracellular Ca2+ in thalassemic erythroblasts restored UPR activation during serum deprivation and significantly reduced the level of serum deprivation induced apoptosis to control levels.
Conclusions
These results suggest the failure of thalassemic erythroblasts to cope with cellular stress caused by an impaired UPR function as a result of high Ca2+ levels may exacerbate thalassemic cell death during erythropoiesis.
Keywords: apoptosis, calcium, CD34+ erythroid progenitor cells, erythroblasts, stress, thalassemia, unfolded protein response, XBP-1
Introduction
The thalassemias are worldwide genetic disorders that result in defective globin-chain production as a consequence of a large number of different genetic lesions.1 The compound β-thalassemia/Hb E hemoglobinopathy is common in Southeast Asia and carriers present with a wide range of disease severity from essentially asymptomatic to a severe transfusion dependent state.2 The underlying pathophysiology of the β-thalassemic patient is associated with the deposition of unpaired α-globin chains which is believed to lead to ineffective erythropoiesis through the induction of apoptosis at the polychromatic normoblast stage of erythroid development.3 The ineffective erythropoiesis in β-thalassemia is often coupled with a dramatic expansion of the hematopoietic marrow presumably as a result of feedback of the anemic state, which can lead to extensive bone deformity due to the increased pressure of the bone marrow mass in severe cases. The mechanism by which apoptosis is induced remains unclear although it has been proposed that both the precipitation of unmatched globin chains as well as the accumulation of unbound iron could lead to oxidative stress and subsequent hemolysis.4
Erythroid cells arise from hematopoietic progenitor cells (HPCs) which are normally resident in the bone marrow, although circulating peripheral blood contains a small number of these cells that can be isolated and differentiated in vitro. Both bone marrow HPCs and peripheral blood HPCs express the cell surface marker CD34, allowing the purification of relatively pure populations of these cells. In vivo, the maturation of HPCs is a highly regulated process requiring responsiveness to the external micro-environment including the action of cytokines, and in particular the lineage specific cytokine erythropoietin (EPO).5
One of the main sensors of the external microenvironment is the unfolded protein response (UPR) pathway, and the primary function of this pathway is to adapt to changes in the environment and to re-impose normal endoplasmic reticulum (ER) function.6 This is achieved through the upregulation of a number of molecular chaperones, global attenuation of protein translation and increased degradation of unfolded proteins. In the case of a failure to re-impose normal ER function, or where the stress cannot be relieved, the UPR will activate cellular apoptosis6 and studies have shown that ER stress and the UPR are critical mediators of a number of disease processes.7 No study has yet examined the major stress adaptive pathway, the UPR, in either normal or thalassemic erythroblasts, which is particularly surprising given that oxidative stress, and/or the deposition of unpaired globin chains are both possible inducers of the UPR pathway in thalassemic erythroblasts. To investigate this pathway, day 10 erythroblasts were selected for study as at this point globin chain synthesis and subsequent globin chain imbalance should be prominent.8
Design and Methods
Patients and controls
Following Ethics Committee approval from the Mahidol University Institutional Review Board and individual informed consent, 50 mL (controls) and 20 ml (patients) of peripheral blood from 10 β-thalassemia/Hb E patients (5 mild and 5 severe cases) and 10 normal volunteers were collected in heparin-treated tubes. The diagnosis and grading of β-thalassemia/Hb E severity was as described elsewhere9 and all subjects (control and patient) were screened to be free of any α-thalassemic hemoglobinopathy by RBC indices, hemoglobin typing,10 multiplex Gap-PCR and allele specific PCR.11,12 Clinical parameters of these patients are shown in the Online Supplementary Table S1. No patient had received a blood transfusion or been on any experimental treatment regime for at least one month prior to blood collection.
Details concerning study methods and analyses are to be found in the Online Supplementary Appendix.
Results
Maturation of isolated CD34+ peripheral blood hematopoietic progenitor cells in culture
To generate erythroblasts from normal and β-thalassemia/Hb E patients, CD34+ hematopoietic progenitor cells from peripheral blood were isolated using a magnetic bead isolation protocol which, as described previously, selects a population of cells with at least 85% CD34+ cells.13 These cells were cultured for ten days under a protocol driving erythroid cell development.14 Morphological observation of day 10 erythroblasts from 3 normal controls and 4 thalassemic subjects by differential counting after Wright-Giemsa’s staining showed greater than 60% polychromatic normoblasts under both normal growth conditions as well as after 12 h serum and growth factor deprivation for both control and thalassemic samples (Online Supplementary Figure S1A and B). To quantitatively analyze the distribution of erythroblasts at each stage of maturation on day 10 (with or without serum deprivation in both groups), a flow cytometry analysis using glycophorin A (CD235a) and CD71 as surface markers to monitor erythroid differentiation was performed. The areas (R1–R4) were gated according to the pattern of erythroid surface marker expression from erythroid progenitors to mature erythrocytes.15 Results (Online Supplementary Figure S1C) showed the majority of erythroblasts were in the R3 quadrant in which the CD71 and glycophorin A expression levels are medium and high, respectively indicating these cells are polychromatic normoblasts which is consistent with the data from the differential counting. Interestingly, we also observed a significantly higher percentage of polychromatic normoblasts in thalassemic erythroblasts (77.42%) than in normal erythroblasts (57.45%) (P=0.0091) (Online Supplementary Figure S1D) and in serum and cytokine deprived thalassemic erythroblasts (79.97%) as compared to normal serum and cytokine deprived erythroblasts (66.33%) (P=0.0009). The higher maturation stage in thalassemic compared to normal erythroblasts is consistent with a previous study3 and may result from the increased activation of EPO mediated signal transduction pathway we have reported previously.13
Serum and cytokine withdrawal induces activation of the UPR of erythroblasts
To determine the stress response of day 10 erythroblasts, normal control day 10 erythroblasts were treated with an internal stress inducer, tunicamycin which blocks the synthesis of all N-linked glycoproteins and activates the UPR,16 as well as being subjected separately to serum and cytokine withdrawal for four, eight and 12 h in parallel with control, non-treated cells. Activation of the UPR was initially assessed by examining the stress induced alternative splicing of the XBP-1 transcript by IRE-16 using primers able to detect simultaneously the presence of both spliced (stress induced; 416bp PCR product) and un-spliced (unstressed; 442 bp PCR product) forms of the XBP-1 transcript. Examination of day 10 erythroblasts from 10 normal controls showed a clear induction of the stress specific XBP-1 alternative splicing in response to both serum/cytokine withdrawal and tunicamycin treatment in all samples examined (Figure 1A). All normal samples additionally showed the presence of a larger PCR product that is believed to be a heteroduplex product formed by annealing between the spliced and un-spliced transcripts.17
Figure 1.

UPR response of erythroblasts from normal controls and β-thalassemia/Hb E patients. (A) RT-PCR analysis of induction of IRE-1 mediated alternative splicing of XBP-1 in day 10 erythroblasts in response to tunicamycin treatment (+ve) or serum and cytokine deprivation (4, 8 and 12h) or normal growth condition (−ve) from 3 normal controls and 3 β-thalassemia/Hb E patients. S: alternatively spliced transcript; Un: normal transcript; H: heteroduplex transcript. (B) Characterization of the induction of XBP-1 alternative splicing in erythroblasts in response to serum and/or cytokine withdrawal in day 10 erythroblasts from 3 normal controls. (C) Representative semi-quantitative transcription profiling of day 10 erythroblasts from one normal control and one β-thalassemia/Hb E patient for expression of GRP78, EDEM1, ERdj4 and CHOP and actin after tunicamycin treatment (+ve) or serum and cytokine deprivation (4, 8 and 12 h) or normal growth condition (−ve). (D) Quantitative real time RT-PCR of transcriptional profiling of day 10 erythroblasts from 8 normal controls (open bars) and 10 β-thalassemia/Hb E patients (solid bars) for GRP78, EDEM1, ERdj4 and CHOP after tunicamycin treatment (+ve) or serum and cytokine deprivation (4, 8 and 12 h) or normal growth conditions (−ve). Data is normalized against actin expression levels. Error bars represent SEM (*, P<0.05).
A similar analysis on day 10 erythroblasts from 10 β-thalassemia/Hb E patients (5 patients with mild presentation and 5 with severe presentation) showed a starkly contrasting result. While the appropriate stress induced alternative splicing of XBP-1 was seen in tunicamycin treated thalassemic erythroblasts, no induction of splicing was seen in any thalassemic sample in response to serum and cytokine withdrawal (Figure 1A).
To further characterize the factor or factors mediating the induction of the stress mediated splicing of XBP-1 transcript, day 10 erythroblasts from 3 normal controls were subjected to withdrawal of cytokines and/or serum in combination for 12 hours. Results (Figure 1B) showed that withdrawal of serum, even in the presence of both EPO and SCF, activates the stress specific splicing of XBP-1. This indicates that serum deprivation alone is the key factor triggering UPR induction in normal erythroblasts.
To examine the response of other stress inducible genes, the level of gene transcription of four other stress inducible genes (ERdj4, GRP78, EDEM-1 and CHOP) was examined using semi-quantitative RT-PCR and quantitative real time RT-PCR. Eight samples from normal controls and 10 β-thalassemic patients (5 mild and 5 severe β-thalassemic patients) were examined. Figure 1C shows an example of serum deprivation inducible mRNA transcriptional profiling from one normal control and one β-thalassemia/Hb E patient together with actin as a control, while Figure 1D shows a graphical analysis of data from all patients and controls after quantitation by quantitative real time RT-PCR (qRT-PCR) and normalization against actin.
In both normal controls and β-thalassemia/Hb E patients, tunicamycin was seen to be a potent activator of the UPR pathway as compared to non-serum deprived erythroblasts in both normal and thalassemic erythroblasts for all transcripts examined (Figure 1C and D). In response to serum deprivation GRP78 expression was shown to be up-regulated in normal erythroblasts as compared to non-serum deprived control cells (4 fold increase, P<0.05), but showed a significant decrease in erythroblasts from β-thalassemic patients under similar conditions (3.51 fold decrease, P<0.05). While both ERdj4 and CHOP showed an increase in transcripts in response to serum deprivation in normal controls (6.11 and 2.98 fold increase with significance P<0.05, respectively), no significant alteration of levels were seen in erythroblasts from β-thalassemia/Hb E patients under the same conditions. Interestingly, EDEM-1, which is present at higher levels in thalassemic erythroblasts as compared to normal erythroblasts (Figure 1C) showed a significant decrease in the level of expression over the period of serum deprivation as compared to normal erythroblasts which showed an increase (Figure 1D).
When comparing between normal and thalassemic erythroblasts after 12 h of serum deprivation, all transcripts examined showed significant differences between thalassemic erythroblasts and normal control erythroblasts (GRP78: P=0.0001, ERdj4: P=0.0157, CHOP: P=0.0017 and EDEM-1: P=0.0092 P<0.05; Figure 1D). No difference was noted in the levels or pattern of expression of stress related genes between mild and severe β-thalassemia/Hb E cases.
Protein profiling of the UPR response
The results seen at the level of messenger RNA suggest that there is a significant deficit in the activation of the UPR in response to serum deprivation in thalassemic erythroblasts. In particular the reduction of expression of GRP78 seen in serum deprived erythroblasts from β-thalassemia/Hb E patients is of particular importance, as upregulation of GRP78 expression is considered a hall-mark of UPR activation.6 To validate the reduction of GRP78 in erythroblasts from β-thalassemia/Hb E patients in response to serum deprivation at the level of the protein, day 10 cultured erythroblasts from 3 normal and 3 thalassemic patients were used to determine the level of GRP78 protein, as well as the phosphorylation status of eIF2α by Western blot analysis. Consistent with the data obtained for the GRP78 messenger RNA, normal erythroblasts serum deprived for 12 h showed a significant increase in the level of GRP78 protein as well as in response to tunicamycin treatment (Figure 2A and C). Again confirming the data from transcriptional studies, thalassemic erythroblasts showed a significant downregulation of GRP78 in response to 12-hour serum deprivation, but increased protein levels in response to tunicamycin treatment (Figure 2B and C).
Figure 2.
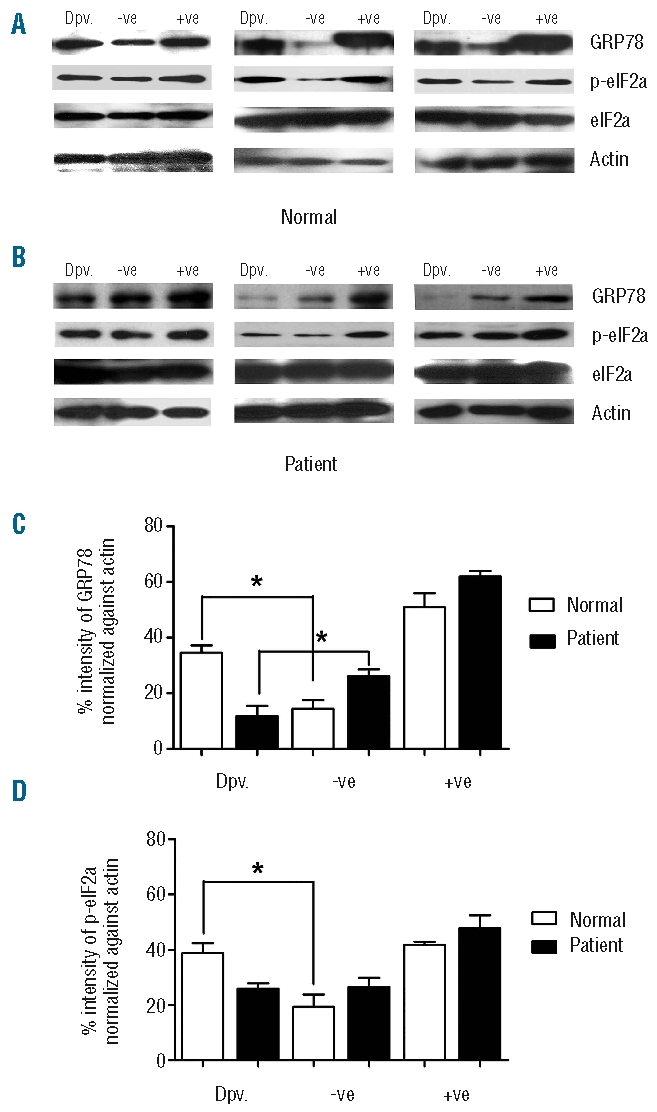
Analysis of UPR responsive proteins in erythroblast cells from normal controls and β-thalassemia/Hb E patients. Western blot analysis of GRP78, p-eIF2α and total protein of eIF2α and actin from day 10 erythroblasts from 3 normal (A) and 3 β-thalassemia/Hb E patients (B) under conditions of normal growth (−ve), after tunicamycin treatment (+ve) or after 12 h serum and growth factor withdrawal (Dpv). (C and D) Quantitative analysis of band intensities of Western analysis as in A and B for 3 normal controls (C) and 3 β-thalassemia/Hb E patients. Error bars represent SEM (*, P<0.05).
Similarly, levels of phosphorylated eIF2α (peIF2α) showed a significant increase in normal erythroblasts in response to both serum deprivation and tunicamycin treatment (Figure 2A and D) while thalassemic erythroblasts showed an increase in phospho-eIF2α (peIF2α) in response to tunicamycin, but not serum deprivation (Figure 2B and D).
Colocalization analysis of UPR proteins in erythroblasts
The UPR response in cells is primarily mediated by the interaction between GRP78 and three ER resident trans-membrane proteins, IRE-1, ATF6, and PERK and upon release from GRP78 these three proteins become activated by various mechanisms.6 Using confocal microscopy, the colocalization of GRP78 and ATF6 and between GRP78 and PERK was investigated in normal and thalassemic day 10 erythroblasts under normal growth conditions, under conditions of serum withdrawal and after treatment with tunicamycin. The degree of colocalization was assessed using the average Pearson’s correlation coefficient (aPcc) with 95% confidence intervals (CIs). Full aPcc values with CIs are shown in the Online Supplementary Table S2. In erythroblasts from normal controls under normal growth conditions a high level of colocalization between GRP78 and ATF6 was readily apparent (Figure 3A; aPcc: 0.925), as was colocalization between GRP78 and PERK (Figure 3B; aPcc: 0.87) as would be expected given the sequestration of ATF6 and PERK by GRP78 in non-serum deprived cells.18 Upon serum withdrawal and the induction of stress, colocalization between GRP78 and ATF6 was significantly reduced (Figure 3A; aPcc: 0.11, P<0.001) as was the colocalization between GRP78 and PERK (aPcc 0.49, P<0.001).
Figure 3.

Localization of stress response proteins in serum deprived and non-deprived erythroblasts from normal controls and β-thalassemia/Hb E patients. (A) Day 10 erythroblasts from normal controls and β-thalassemia/Hb E patients were examined for the colocalization of (A) GRP78 (Red) and ATF6 (Green) or (B) GRP78 (Green) and PERK (Red) grown under standard conditions or serum and growth factor deprived for 12 h or tunicamycin treated for 12 h. Fluorescent signals were observed using an Olympus FluoView 1000 confocal microscope. At least 20 fields were examined from 2 normal and 2 β-thalassemia/Hb E patients. Representative merged images from one individual are shown.
In contrast, while a high degree of colocalization was observed between GRP78 and ATF6 (Figure 3A, aPcc: 0.89) and between GRP78 and PERK (Figure 3B, aPcc: 0.92) in erythroblasts from β-thalassemia/Hb E patients under normal growth conditions, no reduction in colocalization was observed between either GRP78 and ATF6 (aPcc: 0.90, P=NS) or between GRP78 and PERK (aPcc: 0.92, P=NS) in serum deprived cells from β-thalassemia patients (Figure 3A and B).
Treatment with tunicamycin reduced colocalization between GRP78 and ATF6 (Figure 3A) in both normal (aPcc: 0.12, P<0.001) and β-thalassemia/Hb E erythroblasts (aPcc: 0.13, P<0.001), and similarly reduced the colocalization between GRP78 and PERK (Figure 3B) in normal (aPcc: 0.46, P<0.001) and β-thalassemia/Hb E (aPcc: 0.51, P<0.001) erythroblasts.
Dysregulation of Ca2+ in β-thalassemia/Hb E erythroblasts
The cellular second messenger, Ca2+ is critically important in regulating cellular functions including cell survival and cell death and the UPR pathway is one of the survival mechanisms mediated through Ca2+ levels.19 Studies have shown increased levels of Ca2+ in both thalassemic mature erythrocytes20 and proerythroblasts13 as compared to normal proerythroblasts/erythrocytes. To determine intracellular Ca2+ level in day 10 erythroblasts, erythroblasts from 10 normal controls and 10 thalassemic patients were independently measured using the Ca2+ sensitive fluorescent dye, Calcium green-1-AM. Results (Figure 4A) showed that intracellular Ca2+ level in day 10 thalassemic erythroblasts (48.34±5.939 nM) were significantly higher than in normal control erythroblasts (25.35±2.771 nM; P=0.0025). Serum deprived normal control erythroblasts exhibited a significant increase in intracellular Ca2+ levels (88.76±12.47 nM; P<0.0001) as compared to non-deprived cells (Figure 4A), which is consistent with the UPR activation during serum deprivation in normal erythroblasts. Serum deprived thalassemic erythroblasts, by contrast, showed a significant reduction in intracellular Ca2+ levels (Figure 4A) as compared to non-serum deprived thalassemic erythroid cells (14.38±4.45 nM; P=0.0125). This result further suggests that Ca2+ dysregulation in thalassemic erythroblasts disrupts the normal physiological function to respond appropriately to stress as observed by UPR inactivation, although the effect of the bioavailability of calcium in different intracellular pools remains unclear.
Figure 4.
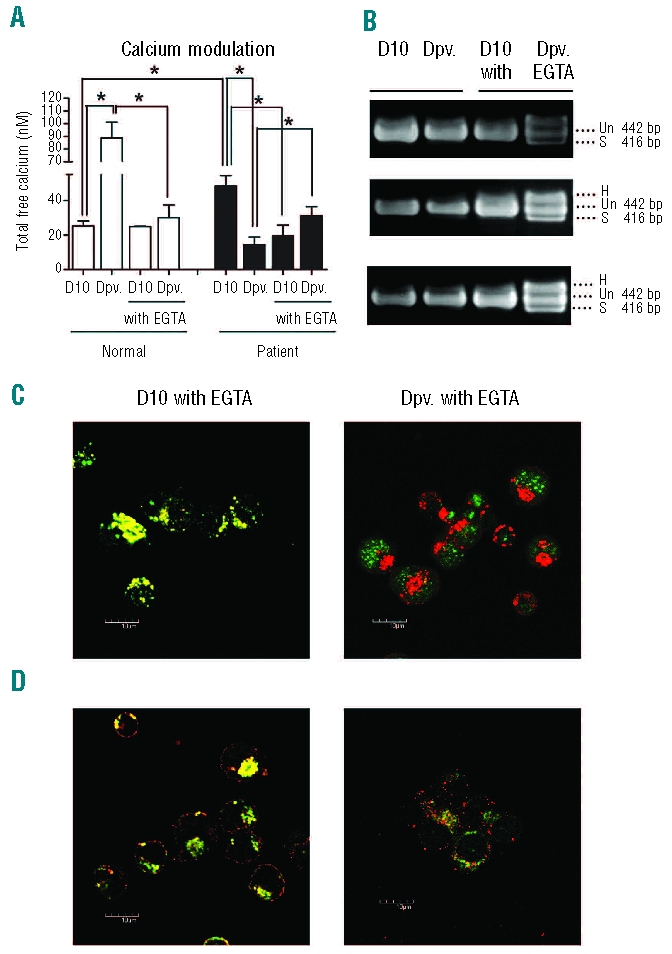
Modulation of intracellular calcium level restores UPR activation in β-thalassemia/Hb E erythroblasts upon serum deprivation. (A) Intracellular calcium levels of day 10 erythroblasts from normal controls and β-thalassemia/Hb E patients cultured under standard growth conditions (D10) or serum deprived for 12 h (Dpv) in the presence or absence of 1 mM EGTA from days 7 to 10. Mean (± SEM) values of 10 normal controls and 10 β-thalassemia/Hb E patients are shown for D10 and 3 normal and 3 β-thalassemia/Hb E patients for all other conditions. An asterisk (*) indicates P<0.05. (B) Analysis of XBP-1 mRNA splicing in β-thalassemia/Hb E erythroblasts from 3 patients under conditions as above. Spliced transcript (S); normal transcript (Un); and heteroduplex transcript (H). (C) The colocalization of GRP78 (Red) and ATF6 (Green) or (D) GRP78 (Green) and PERK (Red) in day 10 erythroblasts of β-thalassemia/Hb E patients under conditions of serum withdrawal. At least 20 fields were examined from 2 β-thalassemia/Hb E patients. Representative merged images from one individual are shown.
Modulation of Ca2+ in β-thalassemia/Hb E erythroblasts by EGTA restores UPR activation upon serum deprivation
We have previously shown that EPO mediated signal transduction in thalassemic day 7 erythroblasts is abnormal, and that correct signal transduction can be reimposed by modulation of intracellular Ca2+ levels.13 To determine whether an appropriate UPR response to serum deprivation could be reimposed similarly by modulation of Ca2+, thalassemic erythroblasts were incubated with 1 mM EGTA (a calcium chelator) from day 7 of culture to day 10 of culture. Calcium levels were determined in EGTA treated thalassemic erythroblasts and serum deprived, EGTA treated thalassemic erythroblasts using the same patients as in the previous analysis. Results (Figure 4A) show that calcium levels were significantly reduced by EGTA treatment to approximately normal levels (21.53±2.192 nM) and that serum deprivation in the presence of EGTA increased Ca2+ levels (32.79±3.614 nM) although this level is somewhat below that seen in serum deprived normal erythroblasts. Notably however, there is an increase in calcium levels in thalassemic erythroblasts in response to serum starvation as with normal control cells as opposed to the reduction in levels seen in non-treated thalassemic erythroblasts. EGTA treatment of normal control erythroblasts did not significantly affect intracellular free calcium levels (EGTA treated: 24.82+0.42 nM compared to 25.35+2.771 nM; P=NS), but did significantly reduce the increase in free calcium levels seen in response to serum starvation (Figure 4A).
More importantly, treatment of thalassemic erythroblasts with EGTA restored UPR activation in response to serum deprivation, as evidenced by the activation of IRE-1 mediated splicing of XBP1 (Figure 4B). This was confirmed by a significant reduction in colocalization between GRP78 and ATF6 in serum deprived, EGTA treated thalassemic erythroblasts (Figure 4C; aPcc: 0.16) as compared to serum deprived, non-EGTA treated thalassemic erythroblasts (Figure 3A; aPCC: 0.90, P<0.001). Similarly, the colocalization between GRP78 and PERK was significantly reduced in serum deprived, EGTA treated thalassemic erythroblasts as compared to non-EGTA, serum deprived thalassemic erythroblasts (Figure 4D, aPcc: 0.41, P<0.001) as compared to serum deprived, non-EGTA treated thalassemic erythroblasts (Figure 3B; aPcc: 0.92, P<0.001). Colocalization between GRP78 and ATF6 and GRP78 and PERK in EGTA treated, but non-serum deprived cells (Figure 4C and D) were not significantly different from treated, non-serum deprived cells (Figure 3A and B).
The cytoprotective role of UPR activation upon serum deprivation
Prolonged UPR activation induces cell death.6 To study the effect of serum deprivation on induced apoptotic cell death, AnnexinV and PI staining were used to assess apoptosis by flow cytometry. The percentage of annexinV-positive cells was calculated by combining solely AnnexinV+ cells (lower right quadrant) and AnnexinV+/PI+ cells (upper right quadrant). Results, averaged for erythroblasts from 6 normal controls and 6 β-thalassemia/Hb E patients show that serum deprivation significantly induced apoptosis in both normal (13.47±3.41%) and thalassemic (28.28±3.415%) erythroblasts compared to non-serum deprived cells (5.92±1.16%, 10.01±1.45%, P<0.05, respectively) with a significantly higher percentage of apoptotic cell death in serum deprived thalassemic erythroblasts than in serum deprived normal erythroblasts (P=0.0029) (Online Supplementary Figure S2A and B). We also observed a slightly higher rate of apoptotic cell death in non-serum deprived thalassemic erythroblasts (10.01±1.45%) as compared to non-serum deprived normal erythroblasts (5.92±1.16%) which is a common feature observed in thalassemic cells during erythropoiesis.3
Our results have shown that β-thalassemic/Hb E erythroblasts do not activate the UPR in cases of serum deprivation and that thalassemic erythroblasts are significantly more susceptible to serum deprivation induced apoptosis than normal erythroblasts. Since the primary role of the UPR is to protect the cell from cellular stress it would appear that it is the non-functional UPR that makes the cells more susceptible to serum deprivation induced apoptosis. Since chelation of excess calcium ions with EGTA generated a functional UPR in cases of serum deprivation, it is likely that treatment with EGTA would protect the thalassemic erythroblasts from the high levels of apoptosis seen upon serum deprivation. To test this hypothesis, β-thalassemia/Hb E erythroblasts were treated with EGTA as above, and the level of apoptosis determined in serum deprived and non-serum deprived erythroblasts. As expected by our hypothesis, treatment of β-thalassemic/Hb E erythroblasts with EGTA both reduced the level of apoptosis in non-serum deprived thalassemic erythroblasts (5.31±0.06%) to levels seen in normal control erythroblasts (5.92±1.116%), as well as significantly reducing the level of apoptosis seen in serum deprived thalassemic erythroblasts (15.83±0.57%) to approximately the values seen in serum deprived, normal control cells (13.47±1.83%; Online Supplementary Figure S2A and B).
Finally, to ensure that incubation of the β-thalassemic/Hb E erythroblasts with 1mM EGTA for three days (day 7 to day 10) did not significantly alter the maturation of the cells, the Glycophorin A, CD71 analysis was repeated on EGTA treated and EGTA treated-serum deprived cells. Results showed no significant alteration in maturation of β-thalassemic/Hb E erythroblasts as a result of either incubation in EGTA or incubation in EGTA and serum deprivation (Online Supplementary Figure S2C and D).
Discussion
The UPR is a well characterized cellular adaptive response mechanism against ER stress that can be induced by a number of stimuli including accumulation of misfolded proteins, excessive increase in secretory protein production, deprivation of nutrients such as glucose or sugar, inhibition of glycosylation, virus infection and alterations of calcium ion homeostasis or redox potential6 and persistent activation of the UPR results in the induction of apoptosis in the cell by a number of intrinsic and extrinsic pathways.6
While serum withdrawal has been well characterized as an inducer of apoptosis in a number of cell lines,21–24 the induction of the UPR in response to serum deprivation remains somewhat more poorly characterized, although several reports have documented the activation of the UPR response in serum deprivation in a number of different cell systems.25–27
In this study we have shown clearly that day 10 erythroblasts from normal controls undergo activation of the UPR in response to both intracellular stress, induced by the blockage of synthesis of all N-linked glycoproteins, as well as in response to the application of an extracellular stress, namely serum withdrawal. Somewhat surprisingly, day 10 erythroblasts from β-thalassemia/Hb E patients showed a starkly contrasting result. While clear activation of the UPR response was observed by blocking synthesis of N-linked glycoproteins with tunicamycin, no activation of the UPR in thalassemic erythroblasts was observed under conditions of serum withdrawal. As all of the thalassemia samples showed the same lack of response to the external stimulus, this represents a fundamental lesion in these cells, and is not a reflection of the severity of patient condition or the degree of globin chain imbalance.
More unusually, in response to growth factor deprivation, GRP78 expression was down-regulated in β-thalassemic erythroblasts at the level of both transcription and translation. However, previous studies have shown that where ER function is dysregulated conditions of oxidative stress can result in decreased mRNA and protein expression of GRP7828,29 and increased oxidative stress is believed to be a primary consequence of unbalanced globin chain synthesis.4
These results show that the UPR in β-thalassemic erythroblasts is potentially functional, but that there is a deficit in the transduction of the environmental stress to the ER resident UPR. Similar to our previous study,13 we have shown that modulating the levels of intracellular calcium in β-thalassemia/Hb E erythroblasts fully restored activation of the UPR in response to serum deprivation.
In response to serum deprivation, both control and β-thalassemia/Hb E erythroblasts show increased levels of apoptosis. Markedly, however, β-thalassemia/Hb E erythroblasts show a significantly higher level of apoptosis induction than did control erythroblasts. In parallel with re-establishing UPR function in response to serum withdrawal, modulation of the level of calcium significantly reduced the level of apoptosis induced in response to serum withdrawal to approximately the same level observed in normal, serum deprived controls. The function of the UPR is to provide a degree of protection or buffering against ER stress to allow the cell to regain normal functioning. In cases where normal cellular function cannot be re-imposed the UPR activates cellular apoptosis pathways.6 In the case of β-thalasssemia/Hb E erythroblasts, it is clear that the lack of activation of the UPR results in a greatly increased sensitivity to the induction of apoptosis under conditions of serum withdrawal.
Normal erythroblasts showed an increase in free calcium ion levels in response to serum withdrawal, and the level of free intracellular calcium in serum deprived cells (88.06±12.47 nM) is higher than the levels seen in normally cultured β-thalassemia/Hb E erythroblasts (48.34±5.94 nM), which show a decrease in free calcium ion levels in response to serum deprivation. Modulation of Ca2+ with EGTA to approximately normal control levels restored the response to that seen in normal controls and, as importantly, restored the direction of the response (serum withdrawal resulting in an increase in Ca2+ levels). However, these results are indicative of overall free calcium levels, and cellular function in erythroblasts may be significantly modulated by the bioavailability of calcium in different intracellular pools.
In our previous report,9 modulation of Ca2+ levels was shown to reduce β-thalassemia/Hb E erythroblast hyper-proliferation, and in this report modulation of Ca2+ levels has been shown to re-impose normal UPR function and dramatically decrease the sensitivity to serum withdrawal induced apoptosis. Combined, these results indicate that significantly more research into the mechanism of the maintenance of calcium ion homeostasis in β-thalassemia/Hb E erythroblasts is required and that modulation of calcium ion levels in β-thalassemia/Hb E patients may prove to be therapeutically productive.
Footnotes
Funding: this work was supported by a Research Strengthening Grant from the National Center for Genetic Engineering and Biotechnology (BIOTEC), National Science and Development Agency (NSTDA). PL is supported by a Thai Royal Golden Jubilee Research Scholarship, AL is supported by the Thai Commission on Higher Education and TW is supported by a BIOTEC Ph.D. Scholarship.
The Online version of this article has a Supplementary Appendix.
Authorship and Disclosures
DRS, FS were responsible for project conception and design. FS and SS were responsible for patient selection and screening. PL, TW, AL and SS were responsible for all experimental work. PL, TW, AL and DRS were responsible for analysis and interpretation. DRS and PL wrote the manuscript and all authors reviewed and contributed to the final version which was approved by all authors.
The authors have no conflict of interest with the presented work.
References
- 1.Rund D, Rachmilewitz E. Beta-thalassemia. N Engl J Med. 2005;353(11):1135–46. doi: 10.1056/NEJMra050436. [DOI] [PubMed] [Google Scholar]
- 2.Fucharoen S, Winichagoon P. Hemoglobinopathies in Southeast Asia: molecular biology and clinical medicine. Hemoglobin. 1997;21(4):299–319. doi: 10.3109/03630269709000664. [DOI] [PubMed] [Google Scholar]
- 3.Mathias LA, Fisher TC, Zeng L, Meiselman HJ, Weinberg KI, Hiti AL, et al. Ineffective erythropoiesis in beta-thalassemia major is due to apoptosis at the polychromatophilic normoblast stage. Exp Hematol. 2000;28(12):1343–53. doi: 10.1016/s0301-472x(00)00555-5. [DOI] [PubMed] [Google Scholar]
- 4.Schrier SL. Pathophysiology of thalassemia. Curr Opin Hematol. 2002;9(2):123–6. doi: 10.1097/00062752-200203000-00007. [DOI] [PubMed] [Google Scholar]
- 5.Richmond TD, Chohan M, Barber DL. Turning cells red: signal transduction mediated by erythropoietin. Trends Cell Biol. 2005;15(3):146–55. doi: 10.1016/j.tcb.2005.01.007. [DOI] [PubMed] [Google Scholar]
- 6.Schroder M, Kaufman RJ. The mammalian unfolded protein response. Annu Rev Biochem. 2005;74:739–89. doi: 10.1146/annurev.biochem.73.011303.074134. [DOI] [PubMed] [Google Scholar]
- 7.Zhang K, Kaufman RJ. The unfolded protein response: a stress signaling pathway critical for health and disease. Neurology. 2006;66(2 Suppl 1):S102–9. doi: 10.1212/01.wnl.0000192306.98198.ec. [DOI] [PubMed] [Google Scholar]
- 8.Umemura T, Constantoulakis P, Papayannopoulou T, Stamatoyannopoulos G. Differentiation kinetics and globin gene expression by circulating human BFUe in suspension cultures. Exp Hematol. 1990;18(10):1116–20. [PubMed] [Google Scholar]
- 9.Sripichai O, Makarasara W, Munkongdee T, Kumkhaek C, Nuchprayoon I, Chuansumrit A, et al. A scoring system for the classification of beta-thalassemia/Hb E disease severity. Am J Hematol. 2008;83(6):482–4. doi: 10.1002/ajh.21130. [DOI] [PubMed] [Google Scholar]
- 10.Langlois S, Ford JC, Chitayat D, Desilets VA, Farrell SA, Geraghty M, et al. Carrier screening for thalassemia and hemoglobinopathies in Canada. J Obstet Gynaecol Can. 2008;30(10):950–71. doi: 10.1016/S1701-2163(16)32975-9. [DOI] [PubMed] [Google Scholar]
- 11.Chong SS, Boehm CD, Higgs DR, Cutting GR. Single-tube multiplex-PCR screen for common deletional determinants of alpha-thalassemia. Blood. 2000;95(1):360–2. [PubMed] [Google Scholar]
- 12.Dode C, Krishnamoorthy R, Lamb J, Rochette J. Rapid analysis of -alpha 3.7 thalassaemia and alpha alpha alpha anti 3.7 triplication by enzymatic amplification analysis. Br J Haematol. 1993;83(1):105–11. doi: 10.1111/j.1365-2141.1993.tb04639.x. [DOI] [PubMed] [Google Scholar]
- 13.Wannatung T, Lithanatudom P, Leecharoenkiat A, Svasti S, Fucharoen S, Smith DR. Increased erythropoiesis of beta-thalassaemia/Hb E proerythroblasts is mediated by high basal levels of ERK1/2 activation. Br J Haematol. 2009;146(5):557–68. doi: 10.1111/j.1365-2141.2009.07794.x. [DOI] [PubMed] [Google Scholar]
- 14.Choi I, Muta K, Wickrema A, Krantz SB, Nishimura J, Nawata H. Interferon gamma delays apoptosis of mature erythroid progenitor cells in the absence of erythropoietin. Blood. 2000;95(12):3742–9. [PubMed] [Google Scholar]
- 15.McGrath KE, Bushnell TP, Palis J. Multispectral imaging of hematopoietic cells: where flow meets morphology. J Immunol Methods. 2008;336(2):91–7. doi: 10.1016/j.jim.2008.04.012. [DOI] [PMC free article] [PubMed] [Google Scholar]
- 16.Zong WX, Li C, Hatzivassiliou G, Lindsten T, Yu QC, Yuan J, et al. Bax and Bak can localize to the endoplasmic reticulum to initiate apoptosis. J Cell Biol. 2003;162(1):59–69. doi: 10.1083/jcb.200302084. [DOI] [PMC free article] [PubMed] [Google Scholar]
- 17.Shang J, Lehrman MA. Discordance of UPR signaling by ATF6 and Ire1p-XBP1 with levels of target transcripts. Biochem Biophys Res Commun. 2004;317(2):390–6. doi: 10.1016/j.bbrc.2004.03.058. [DOI] [PubMed] [Google Scholar]
- 18.Liu CY, Kaufman RJ. The unfolded protein response. J Cell Sci. 2003;116(Pt 10):1861–2. doi: 10.1242/jcs.00408. [DOI] [PubMed] [Google Scholar]
- 19.Hoyer-Hansen M, Jaattela M. Connecting endoplasmic reticulum stress to autophagy by unfolded protein response and calcium. Cell Death Differ. 2007;14(9):1576–82. doi: 10.1038/sj.cdd.4402200. [DOI] [PubMed] [Google Scholar]
- 20.Shalev O, Mogilner S, Shinar E, Rachmilewitz EA, Schrier SL. Impaired erythrocyte calcium homeostasis in beta-thalassemia. Blood. 1984;64(2):564–6. [PubMed] [Google Scholar]
- 21.Chou CC, Yung BY. Antiapoptotic effect of ras in the apoptosis induced by serum deprivation and exposure to actinomycin D. Naunyn Schmiedebergs Arch Pharmacol. 1997;355(2):177–82. doi: 10.1007/pl00004929. [DOI] [PubMed] [Google Scholar]
- 22.Chrestensen CA, Eschenroeder A, Ross WG, Ueda T, Watanabe-Fukunaga R, Fukunaga R, et al. Loss of MNK function sensitizes fibroblasts to serum-withdrawal induced apoptosis. Genes Cells. 2007;12(10):1133–40. doi: 10.1111/j.1365-2443.2007.01122.x. [DOI] [PubMed] [Google Scholar]
- 23.Jun EJ, Kim HS, Kim YH. Role of HGF/c-Met in serum-starved ARPE-19 cells. Korean J Ophthalmol. 2007;21(4):244–50. doi: 10.3341/kjo.2007.21.4.244. [DOI] [PMC free article] [PubMed] [Google Scholar]
- 24.Schamberger CJ, Gerner C, Cerni C. Caspase-9 plays a marginal role in serum starvation-induced apoptosis. Exp Cell Res. 2005;302(1):115–28. doi: 10.1016/j.yexcr.2004.08.026. [DOI] [PubMed] [Google Scholar]
- 25.Hu P, Han Z, Couvillon AD, Exton JH. Critical role of endogenous Akt/IAPs and MEK1/ERK pathways in counteracting endoplasmic reticulum stress-induced cell death. J Biol Chem. 2004;279(47):49420–9. doi: 10.1074/jbc.M407700200. [DOI] [PubMed] [Google Scholar]
- 26.Szegezdi E, Duffy A, O’Mahoney ME, Logue SE, Mylotte LA, O’Brien T, et al. ER stress contributes to ischemia-induced cardiomyocyte apoptosis. Biochem Biophys Res Commun. 2006;349(4):1406–11. doi: 10.1016/j.bbrc.2006.09.009. [DOI] [PubMed] [Google Scholar]
- 27.Voccoli V, Mazzoni F, Garcia-Gil M, Colombaioni L. Serum-withdrawal-dependent apoptosis of hippocampal neuroblasts involves Ca++ release by endoplasmic reticulum and caspase-12 activation. Brain Res. 2007;1147:1–11. doi: 10.1016/j.brainres.2007.01.145. [DOI] [PubMed] [Google Scholar]
- 28.Dey A, Kessova IG, Cederbaum AI. Decreased protein and mRNA expression of ER stress proteins GRP78 and GRP94 in HepG2 cells over-expressing CYP2E1. Arch Biochem Biophys. 2006;447(2):155–66. doi: 10.1016/j.abb.2006.01.013. [DOI] [PubMed] [Google Scholar]
- 29.Paschen W, Frandsen A. Endoplasmic reticulum dysfunction--a common denominator for cell injury in acute and degenerative diseases of the brain? J Neurochem. 2001;79(4):719–25. doi: 10.1046/j.1471-4159.2001.00623.x. [DOI] [PubMed] [Google Scholar]