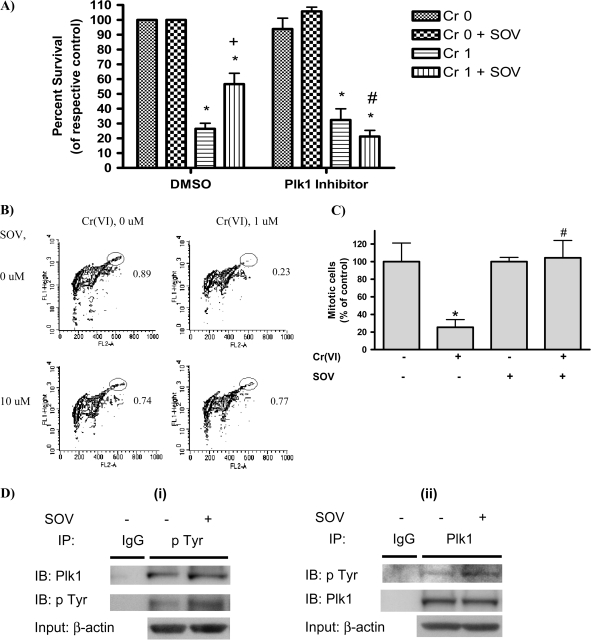
Fig. 1.
Plk1 is required for the PTP inhibitor to enhance clonogenic survival after Cr(VI) exposure. (A) HLF cells were incubated with either dimethyl sulfoxide (DMSO) (vehicle) or GW843682X (Plk1 inhibitor) with or without 1 μM Cr(VI) for 24 h in the presence or absence of 10 μM SOV. Cells were washed and reseeded to allow for colony formation. Colonies were stained with crystal violet and counted 12 days later. The data are expressed as percent of respective control in the absence of Cr(VI) and are the means + standard error of four independent experiments. Asterisks indicates a statistically significant difference from the respective control at P < 0.05. Plus sign indicates a statistically significant difference in the presence versus the absence of SOV after 1 μM Cr(VI) treatment at P < 0.05. Hash symbol indicates a statistically significant difference in the presence versus the absence of the Plk1 inhibitor after 1 μM Cr(VI) + SOV treatment at P < 0.05. (B) HLF cells were coincubated with the indicated agents for 24 h, washed, collected and fixed. Mitotic cells were determined by flow cytometry with an antibody to phospho-histone H3 (pH3), followed by Alexa 488-conjugated secondary antibody. Contour plots show staining of pH3 as an index of mitosis (FL1-Height) and propidium iodide fluorescence (FL2-A) as an index of DNA content. The mitotic population is delineated by the elliptical gate. The numbers next to the mitotic population represent the respective mean of four experiments and are the percentage of mitotic cells within the total population. (C) Graphical representation of data in Figure 1B. Data are the proportion of mitotic cells after Cr(VI) exposure, expressed as a percentage of that in the non-Cr(VI)-treated control and are the means ± standard error of four independent experiments. Asterisk indicates a statistically significant difference from the respective control at P < 0.05. Hash symbol indicates a statistically significant difference between the samples treated with and without SOV at P < 0.05. (D) (i) Immunoprecipitation (IP) for phosphotyrosine was carried out using Catch and Release Phosphotyrosine, clone 4G10 Immunoprecipitation Kit according to the manufacturer's instruction (Millipore). HLFs at 24 h postseeding were treated with 10 μM SOV or medium alone for 1 h and protein lysates were added to the spin column prepacked with immunoprecipitation capture resin. Then, anti-phosphotyrosine 4G10 antibody or normal mouse IgG was added to the column and incubated at room temperature for 30 min. A protein lysate from medium-treated cells was used for mouse IgG immunoprecipitation. Proteins were eluted from the column with a denatured elution buffer followed by immunoblotting (IB) with anti-Plk1 or anti-phosphotyrosine 4G10 antibody. An immunoblot with anti-β-actin antibody is also shown for equal protein loading for the column input. Data are representative of three independent experiments for phosphotyrosine immunoprecipitation and the increase in pTyr in the presence of SOV compared with the absence of SOV is statistically significant at P < 0.05. (ii) The Plk1 immunoprecipitation was carried out as described above by utilizing a Catch and Release immunoprecipitation system with anti-rabbit Plk1 antibody (Cell Signaling). Data are representative of one experiment for Plk1 immunoprecipitation.

