

Abstract
A unified model has been developed to predict release not only from bulk eroding and surface eroding systems but also from matrices that transition from surface eroding to bulk eroding behavior during the course of degradation. This broad applicability is afforded by fundamental diffusion/reaction equations that can describe a wide variety of scenarios including hydration of and mass loss from a hydrolysable polymer matrix. Together, these equations naturally account for spatial distributions of polymer degradation rate. In this model paradigm, the theoretical minimal size required for a matrix to exhibit degradation under surface eroding conditions was calculated for various polymer types and then verified by empirical data from the literature. An additional set of equations accounts for dissolution-and/or degradation-based release and is dependent upon hydration of the matrix and erosion of the polymer. To test the model’s accuracy, predictions for agent egress were compared to experimental data from polyanhydride and polyorthoester implants that were postulated to undergo either dissolution-limited or degradation-controlled release. Because these predictions are calculated solely from readily-attainable design parameters, it seems likely that this model could be used to guide the design controlled release formulations that produce a broad array of custom release profiles.
1. Introduction
The field of controlled release has led to the creation of therapeutics that have dramatically improved patient compliance and reduced side effects through extended dosing and targeting.[1, 2] This technology is frequently implemented as biodegradable polymer matrices that are completely adsorbed in vivo.[3] In fact, the FDA has approved at least 11 such biodegradable matrix-based, controlled release therapeutics over the past decade.[4] Despite their diverse therapeutic applications, a surprisingly limited number of polymer types are used in these FDA approved controlled release formulations.[5] In fact, just two biodegradable polymer types, polyesters and polyanhydrides, are used in the aforementioned commercially available therapeutics.[4, 6] Researchers have extensively studied the properties of these polymers and the resulting matrices in an effort to determine how they influence drug release.[7-10] Such studies include both empirical analysis of potentially critical properties [7, 8] and mathematical modeling to quantitatively analyze how these properties might affect release [9, 10].
While these experimental and mathematical analyses have greatly extended our knowledge regarding biodegradable control drug delivery vehicles, the overwhelming majority of these studies focus on systems with a single, dominate erosion behavior. In particular, for the mathematical models, the fundamental assumption has been made that the biodegradable matrices they are describing undergo either surface or bulk erosion. [7-10] In bulk eroding systems, it is assumed that the delivery vehicle hydrates rapidly, leading to degradation and erosion occurring randomly throughout the matrix.[11] To describe surface eroding systems, models assume that water does not penetrate the matrix leaving degradation and erosion confined to the matrix surface.[8]
In many cases, the assumption of a single, dominant erosion behavior is acceptable and has been successfully employed by very powerful predictive models.[12-17] Batycky et al. developed a deterministic model bulk eroding polyester microspheres that, with successive application, could be used to predict protein release.[13] A stochastic model has also been developed for bulk eroding microspheres and was successfully tested on the release of 5-fluorouracil, a small molecule.[14] Likewise, several models have developed for and successfully applied to polyanhydride implants, which were assumed to undergo surface erosion. [15-17] Gopferich et al developed a stochastic model of surface erosion that has been featured in several articles examining controlled release of different small molecules.[15, 18-21] Similar models of surface erosion have also been developed using non-stochastic approaches, although these models have only been tested on select sets of mass loss or small molecule release data.[16, 17]
Recent data by Burkerstroda et al reveals that systems which begin drug release under surface erosion most likely transition to a bulk eroding mechanism as mass is lost from the surface and the matrix size shrinks (i.e. the characteristic length scale of diffusion decreases) [22]. The matrix size at this transition from surface to bulk erosion has been dubbed the “critical length”. Conversely, this critical length can also be viewed as the distance water can penetrate into a matrix before it is entirely consumed by hydrolysis. Calculations using an average degradation rate and initial molecular weight placed this length at 75μm for polyanhydrides[22], which suggests that many implants made from these polymers will undergo a transition from surface to bulk erosion while release is still occurring.
Here, we describe the first model suitable for predicting a broad array of release behaviors not only from bulk eroding systems[12], but also surface eroding matrices and those that transition from a surface eroding to a bulk eroding degradation scheme during the course of degradation. This model builds off of our prior work, that focused on predicting release for a wide array of agents from bulk eroding systems.[12] Specifically, the current model combines diffusion-reaction equations, which account for the system’s hydration kinetics, along with sequential descriptions of dissolution and pore formation to compute drug release. Further, all parameters required to solve these equations can be obtained prior to controlled release experiments, allowing predictions to be made without regression. In support of prior work reporting empirically obtained critical lengths [22], the diffusion/reaction equations employed by the current model are used to compute this characteristic parameter from rate expressions.[23] To test the model’s accuracy, regression-free predictions were compared with published controlled release data from several different polyanhydride and poly(ortho ester) implants.
2. Methods
2.1. Release Paradigm
Consider a hydrolysable polymer matrix loaded with a finite amount of release agent or drug. This agent is dispersed discretely (below its percolation threshold), occupying either small granules or larger occlusions, as dictated by the matrix fabrication method. These occlusions or granules are distributed randomly throughout the polymer matrix, such that the probability of finding drug at any point in the polymer matrix is constant at all positions within the matrix.[12]
At time zero, water or buffer begins to hydrate the matrix. Specifically, water diffuses into the matrix and is simultaneously consumed through the hydrolysis of the polymer matrix [22]. Hence, a larger matrix with a faster hydrolysis rate, such as a polyanhydride implant, will have a sharper concentration gradient of water than a smaller matrix (microsphere) or one with a less labile polymer, such as a poly(lactic-co-glycolic) acid.
Following the hydration of a region of matrix, release of drug can be limited by its solubility or dissolution kinetics. The dissolution rate expression for this process depends upon the agent’s solubility and concentration[15] as well as the concentration of solvent. If an agent is highly soluble in water, dissolution may happen on a time scale that is much shorter than the duration of release. In systems where hydrophobic molecules have been encapsulated, however, dissolution can occur over a considerable amount of time, dramatically affecting the release profile.[15, 24]
After an agent has dissolved, its diffusive egress may be further restricted by the encapsulating matrix. In this case, the matrix needs to degrade to the point where a network of pores is formed, before permitting egress of encapsulated agent.[12, 25] This degradation is assumed to happen randomly and heterogeneously throughout hydrated regions of the matrix. Further, the degradation of the matrix occurs in tandem with the dissolution of the agent, and both are dependent upon the hydration kinetics of the system. The interplay between these factors can be translated into a framework of coupled equations for describing release.
2.2. Model Development
The time-dependant concentration profile of water within a hydrolysable polymer matrix of initial molecular weight (Mwo) can be calculated from competing diffusion-reaction equations. As water diffuses into a matrix, a process described by Fick’s second law, it is also consumed in hydrolysis of the polymer matrix, (written below as a second order reaction, which applies to both polyesters and polyanhydrides[8, 26]). Hence, equation 1 below describes the presence of water within the polymer matrix.
| (1) |
Where CW is the time dependant concentration of water, DW is the diffusivity of water in the polymer matrix (found to be on the order of 10-12 m2/s for a broad array of systems [22]), k is the degradation rate constant, and Mw is the polymer molecular weight.
As part of the hydrolysis reaction, polymer bonds are also broken leading to a decrease in the molecular weight of the polymer matrix. The kinetics of this process can be described by the standard second order rate expression commonly used for both polyesters and polyanhydrides.[8, 26] (Equation 2)
| (2) |
It is assumed that components of the polymer matrix (e.g. initially high molecular weight polymer degradation products) do not diffuse considerably before the onset of erosion (Mw ≈ kDa), by which time the release of most types of agents will have commenced. In line with previous models, a “degradation front” can be defined at a point in the polymer matrix where the gradient of the polymer molecular weight (dMw/dr vs. r) is at a minimum[19, 27]. This minimum is defined as the inflection point of the continuous function, Mw(r), such that the initial average molecular weight at this front is ½ Mwo, provided that the core of polymer matrix is at its initial molecular weight.
With the hydration kinetics defined, the dissolution of the drug can be calculated, which is normally done with a second order rate expression.[28] Unlike the standard systems used to derive this second order expression, the solvent concentration of the present system varies with position and time, and hence must be considered as well. The standard expression is also written in terms of the solute surface area and mass transfer coefficient which have been translated into equivalent, readily measurable parameters.(Equation 3)
| (3) |
where kdis is the intrinsic dissolution rate constant, CSn is the normalized concentration of solid drug in the polymer matrix, CAn is the difference between the aqueous agent concentration and its maximum solubility (CAmx), normalized by CAmx, and CWn is the normalized concentration of water. Next, the position-(r) and time- (t) dependant concentration of dissolved agent in a polymer matrix can be calculated from Fick’s second law and the dissolution rate expression. (Equation 4)
| (4) |
where Deff is an effective diffusivity term. Integrating the total normalized concentration of agent in the matrix over all space yields the cumulative fraction of agent remaining in the matrix at each point in time. (Equation 5)
| (5) |
In turn, the cumulative fraction of agent release (R(t)), a metric commonly used to document formulation performance, is simply: (Equation 6)
| (6) |
The Deff term in Equation 4 is dependent on the matrix porosity (ε) and the diffusivity of the agent through the porous matrix (DA). (Deff = DA ε) The time-and space-dependant matrix porosity follows a cumulative normal distribution function, based a molecular weight or degradation rate distribution of the given polymer. (Equation 7)
| (7) |
The variance (σ2) is based on the crystallinity of the polymer matrix and corresponding distribution of degradation rates, as done previously[12]. The molecular weight of the polymer matrix during release (Mwr) has been previously correlated to the molecular weight of the agent for common biodegradable systems[12]. The diffusivity (DA) of agents passing through the newly-formed pores in the polymer matrix has been correlated to bulk eroding matrix size.[12, 29] This correlation is based on the idea that a larger matrix will experience more rapid degradation due to autocatalysis than a smaller one and therefore have more highly developed pores, allowing the less restricted passage of agent.[12, 29] For a surface eroding matrix, autocatalytic degradation only occurs in the region of matrix that is hydrated, thus the system’s critical length is used to determine the diffusivity from published correlations.
The boundary conditions for the polymer phase, as well as the aqueous and solid release agent phases, match those defined in a prior model for bulk eroding matrices[12]. Briefly, symmetry conditions (dCn/dr = 0) are defined at the matrix center and perfect sink conditions (Cn = 0) are set at the matrix surface (at radius Rp and length L in a cylinder or disk). For water concentration, the same internal symmetry conditions still apply, but the concentration of water at the matrix surface is set to match that of an infinite reservoir, with a concentration of Cwo calculated as the density of water over its molecular weight. Further, when the encapsulated agent is gathered in large occlusions or pockets (relative to the size of the entire matrix), such as would be found in a double emulsion fabricated microsphere, the matrix should be represented with two subdomains, as demonstrated previously,[12] to account for the resulting initial burst.
2.2.1. Limiting Cases
Depending on the nature of the encapsulated agent, it may be possible to simplify the mathematical description of release. If an agent possesses a high aqueous solubility and dissolves rapidly, such that the rate of dissolution is at least 2 orders of magnitude faster than the rate of diffusion, the timescale of dissolution is negligible. When modeling such cases,[30-32] the drug was assumed to dissolve instantaneously in water. Hence, Equation 3 can be neglected entirely and Equation 4 can be simplified to the following form. (Equation 8)
| (8) |
where CAo becomes the initial concentration of agent. In total, these simplifications reduced the model to three sets of diffusion-reaction equations instead of four and eliminated three input parameters (CSo, kdis, and CAmx).
Alternatively if an agent has a Mwr > Mwo, by definition, it can diffuse freely through the newly hydrated polymer matrix and does not require degradation of the matrix for egress. Specifically, the agent is small enough to pass freely through the matrix and, as such, pores formed during degradation are no longer needed to provide a pathway for diffusive egress; hence Deff = DA. In this case the expression for matrix porosity (Equation 7) can be neglected.
2.3. Model Implementation
By adopting the proven approach to calculating release as detailed in section 2.2, existing correlations[12] can be used along with the model to generate regression-free predictions. To calculate such predictions, the model was coded in Matlab® (Mathworks, r2007a) and computed using the finite element method on Comsol® (v3.1). Meshing was successively refined, until node-density independent results were observed. Otherwise, default solver settings were maintained.
2.3.1. Critical length
To investigate the effects of polymer molecular weight (Mwo) and degradation rate (k) on the transition from surface to bulk erosion, only equations 1 and 2 were considered. This transition occurs at a set matrix size, dubbed the critical length.[22] Burkersroda et al originally defined the critical length as the distance water can travel through a matrix before the rate of diffusion equals the rate of degradation, such that in a surface eroding system, the rate of degradation surpasses the rate of diffusion.[22] However, when mathematically accounting for these two rates with Fick’s second law and a second order rate expression (applicable to autocatalytic hydrolysable polymers) this original definition becomes physically untenable because the Cw term in the hydrolysis rate expression prevents the reaction rate from ever surpassing the diffusion rate. Thus, in order to determine the erosion mechanism of the matrices examined here in, we defined critical length as the matrix size where the polymer residing in the degradation front hydrolyzes at its most rapid rate, as noted by a minimum in dMwf/dt vs. t. In other words, during surface erosion, this front moves progressively inward, slowing its traverse only as the matrix begins to uniformly hydrate. With the onset of bulk erosion, the hydrolysis reaction taking place throughout the matrix can no longer consume the water before it penetrates to the matrix core. This leads to a matrix where the water concentration is at a maximum and the polymer molecular weight has not significantly decreased from its initial value. Together, these conditions maximize the degradation rate (-kCwMw), resulting in the fastest possible drop in the average polymer molecular weight. Hence, it can be said that the matrix size, where degradation proceeds (on average) at its fastest average rate, denotes the end of surface erosion and the onset of bulk erosion, and therefore can be defined as the critical length.
Using this definition, the critical length was calculated for a variety of polymers, including PLA, PLGA, PFAD:SA, and PSA, at initial molecular weights ranging from 5kDa to 130kDa. The results of these calculations were used to determine if published release data [1, 30, 32] was generated by surface eroding, bulk eroding, or transitioning phenomena. Specific calculations were also performed to check the erosion mechanism of matrices used in other modeling literature.[20, 31]
2.3.2. Release Predictions
The simplified forms of the model described in section 2.2.1 were validated against release data from matrices that could be represented in 2-dimensions using axial symmetry. Values for common model parameters Rp, L (for a cylinder), Mwo, MwA, CWo, CSo, CAmx, k, Dw, and kdis were specified directly from, or calculated using parameters specified in, the materials and methods sections of published literature [30-33]. Existing correlations were used to calculate values for DA and Mwr using formulation parameters that would be available prior to controlled release experimentation.[12]
It is important to note that the poly(ortho ester) matrices investigated herein are unique in the field of controlled release because they contain a small molecule anhydride excipient. This is proposed to alter the degradation mechanism of the polymer by increasing the rate of autocatalysis in the system.[34] Fortunately, data on the hydrolysis of this anhydride excipient was published for these matrices and was used to enhance model caculations.[31] Specifically, this data was used to calculate the amount of water diverted from polymer degradation into anhydride hydrolysis as a function of time. The newly calculated rate expression was amended to the hydrolysis reactions to adjust for the additional consumption of water by the excipient.
3. Results
3.1. Matrix Degradation Kinetics
Solutions to equations 1 and 2 generate hydration and degradation profiles for a specified polymer matrix. Figure 1 shows degradation profiles (Mw/Mwo as a function of r and t) for matrices composed of a single polymer where the dominate erosion mechanism has clearly been predetermined by carefully selecting the matrix size. In a system undergoing surface erosion, the degradation-erosion front will move inward toward the center of the matrix as both degradation and erosion are confined to the periphery. (Figure 1A) In bulk eroding systems, in which degradation occurs randomly throughout the matrix, the matrix size remains constant as its average molecular weight decreases.(Figure 1C) This change in average molecular weight begins at the most rapid rate possible, with water concentration and polymer initial molecular weight both being at maximal values, and decreases as the number of hydrolysable bonds is depleted. Hence, average degradation rate in the polymer matrix should be at a maximum with the onset of bulk erosion (or in other words, during a transition from surface to bulk erosion).(Figure 2A) In turn, the critical length is calculated as the matrix size (marked at the center of the degradation front) when this transition occurs. Increasing the polymer degradation rate, indicating a more labile hydrolysable bond type, correspondingly decreases the critical length, indicating more dominate surface eroding behavior. Likewise, increasing the polymer initial molecular weight also decreases the critical length. (Figure 2B)
Figure 1.

Degradation profiles (Mw relative to Mwo as a function of position and time) for various spherical matrices of 10kDa PSA. Matrix size is varied (A. 2 cm, B. 2 mm, C. 200 μm) to explore the various erosion schemes: A) surface erosion, B) a transition from surface to bulk erosion and C) bulk erosion. The lifetime of each matrix changes with its size, such that each line in A) represents 1 month, B) represents 1 day and C) represents 2 hours. In each figure, the line furthest to the right and top indicates the earliest time point.
Figure 2.
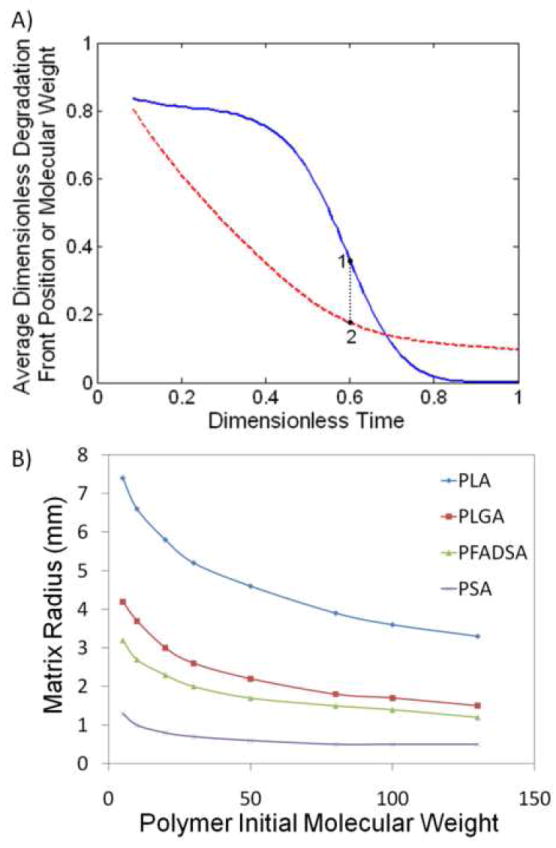
Calculation of critical length using a second order rate expression as a function of both the initial molecular weight of polymer and hydrolysis rate constant. A) Critical length (point 2) was calculated as the matrix size (dashed line) in which the average molecular weight of polymer at the degradation front (solid line) decreases most rapidly (point 1), indicating the onset of bulk erosion. B) Values for critical length as a function of initial molecular weight for a variety of polymer matrices: PLA (diamond), 50:50 PLGA (square), 50:50 PFAD:SA (triangle) and PSA (cross).
Having determined the matrix specifications required to maintain surface erosion, the model’s ability to predict controlled release from matrices with a variety of different erosion mechanisms was examined. Further, systems with different hypothesized, release rate-limiting steps were also examined. The tested systems range from bupivacaine release from FAD:SA polyanhydride disks (dissolution limited, bulk eroding), to gentamicin release from FAD:SA polyanhydride rods (degradation limited, surface eroding), to amaranth release from POE disks (degradation limited, surface and bulk eroding).[30-32]
3.2. Dissolution Controlled Release
Work by Park et al.[30] examines the release of a small molecule, bupivacaine, from a 50:50 FAD:SA polyanhydride disk with a 4 mm radius and 1 mm thickness sized at slightly below the calculated critical length for this system (~1.7mm). This suggests that the system would exhibit bulk eroding behavior and, as such, model predictions made with and without taking into account the hydration kinetics should both match the bupivacaine release data with comparable accuracy.(Figure 3) In line with this result, both predictions matched the data within assumed cumulative experimental error, with the prediction from the full model producing a slightly more accurate result than the simplified version of the model that neglected hydration kinetics. It was also hypothesized that dissolution kinetics were an important factor in determining the release rate of bupivacaine and failing to consider them increased the SSE by a factor of 25 (SSE = 4.9004, data not shown).
Figure 3.
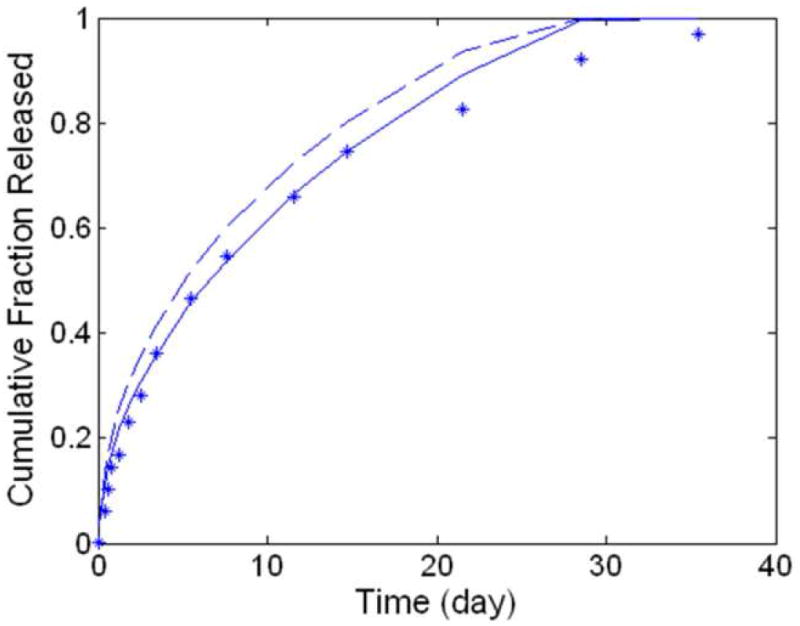
Predictions of dissolution-controlled, release of drug. The experimental data (asterisks) was generated from polyanhydride disks releasing the sparingly soluble agent, bupivacaine. [30] For comparison, model predictions were generated without regression while considering surface erosion (solid, SSE = 0.0204), and assuming bulk erosion (dashed, SSE = 0.0691). To make these regression-free predictions, system-specific parameters were set as follows: Rp = 4mm, L = 1mm, Mwo = 50 kDa, CSo = 288.42 mol/m3 and CAmx = 2.184 mol/m3 kdis = 0.046mol/m3 s. D was calculated as 4.61 × 10⁻¹² m2/s from a correlation published previously.[12]
3.3. Degradation Controlled Release
Stephens et al [32] documented gentamicin release from a 35.8 kDa Mwo 50:50 FAD:SA polyanhydride bead with a 4 mm diameter and a 12mm length, a matrix on the same order of magnitude as, but still slightly larger than the calculated critical length of 1.9 mm. Based on the calculations of critical length presented in Figure 2B and the those made by Burkersroda et al.,[22] this system should exhibit surface eroding behavior, and any attempt to accurately model it should account for hydration kinetics.[22] If a prediction for release is made without accounting for hydration kinetics, as detailed in [12], a relatively poor fit to the data is observed (SSE = 0.4350). However, when accounting for hydration kinetics, using equations 1 and 2, the model’s prediction improved dramatically (as expected), resulting in an SSE of 0.0657. (Figure 4)
Figure 4.
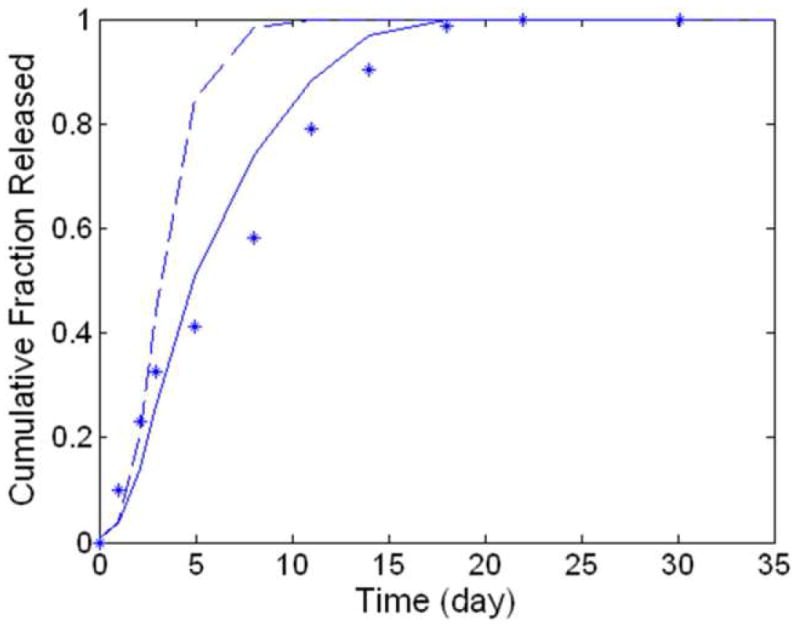
Predictions for degradation-controlled release of drug. The experimental data (asterisks) charts gentamicin release from FAD:SA matrix rods.[32] Model predictions were generated without regression while considering surface erosion (solid, SSE = 0.0657) and assuming bulk erosion (dashed, SSE = 0.4350). To generate these regression-free predictions, the following values were used: Rp = 2 mm, L = 12 mm, Mwo = 35.8 kDa, Mwr = 13.3 kDa, DA = 5.94 × 10⁻¹² m2/s.
Work by Joshi et al examined amaranth dye release from POE disks (10 mm diameter, 1.4 mm thick), which had their erosion mechanism controlled by the addition of phthalic anhydride. When a low amount of anhydride (0.25 w/w%) was present in the disk, a bulk eroding mechanism was postulated to dominate, a point confirmed by our own critical length calculations (data not shown). In contrast, with the addition of just 1% anhydride excipient, the critical length dropped to 684 μm, a value slightly below the shortest matrix dimension, suggesting that surface erosion should dominate (at least at early times).[31] Predictions of drug release from both of these systems take into account both the increase degradation rate from and the consumption of water by the anhydride excipient. If these factors are not considered increased error is observed in the predictions. (data not shown) Accounting for these effects significantly improved prediction for both the 0.25% anhydride matrix, reducing error by a factor of 4, and the 1% anhydride matrix, reducing error by a factor of 6, when compared to previously published results.[31]
4. Discussion
Biodegradable matrices for controlled release have been traditionally classified as either surface or bulk eroding and mathematical models of drug delivery from these systems have often reflected this classification in their assumptions.[7-10] Recent data suggests that many surface eroding systems actually transition to a bulk eroding mechanism while drug release is occurring.[22] With this in mind, a new model was developed to predict drug release from matrices undergoing multiple different erosion schemes, the first of its kind to describe the release of a wide array of agents without regression. This model uses diffusion-reaction equations to describe the hydration kinetics, drug dissolution and degradation controlled release. Using the equations governing matrix hydration, a mechanistically accurate method for calculating a system’s critical length was developed, and then applied to a range of common systems. Regression-free predictions (which use parameters that can be obtained prior to release experimentation) were made including and (for validation purposes) ignoring the effects of matrix hydration in both smaller and larger than their respective critical lengths. Specifically, the model has been used here to predict bupivacaine release from polyanhydride disks[30] and gentamicin release from polyanhydride cylinders[32] as well as amaranth red release from poly(ortho ester) disks[31]. The model’s applicability is not, as shown previously, limited to small molecules and should apply with comparable accuracy to systems that encapsulate and release macromolecules.[12]
Several of the fundamental concepts from the current model’s paradigm have been separately employed in prior models.[12-17] However, the equations used to translate these concepts into mathematical predictions for drug release have, however, been altered in some way from their previous forms. For example, a dissolution rate expression has been used in prior published work.[15] Unlike this previously published expression[15], the form in equations 3 and 4 include a term for the dimensionless concentration of water that accounts for potential solubility limitations associated with partially hydrated systems. Another example comes from the porosity expression, which has been translated from a time-dependant form that assumes a uniform degradation rate [12] to a version with broader applicability, based on the local molecular weight of the polymer matrix. Finally, the concept of using diffusion/reaction equations to create a model that uniformly captures different erosion schemes has also been investigated before. One prior model based on species-dependant, diffusion/reaction equations was successfully developed and applied to data for dye release from POE disks (Figure 5). The results from predictions in that work are compared to results from our more comprehensive model below. Importantly, predictions using this previous model required system-specific parameters that could not be directly measured in order to generate predictions. In the current model, predictions have been simplified using widely tested mathematical descriptions of pore-mediated release and polymer degradation.[12, 15, 25] It is important to note that these simplifications have not hindered the current model’s predictive power. For instance, regression-free predictions from the current model describe the amaranth red release data used to validate this prior work, with a greater degree accuracy (i.e. lower error in the prediction of data).[31]
Figure 5.
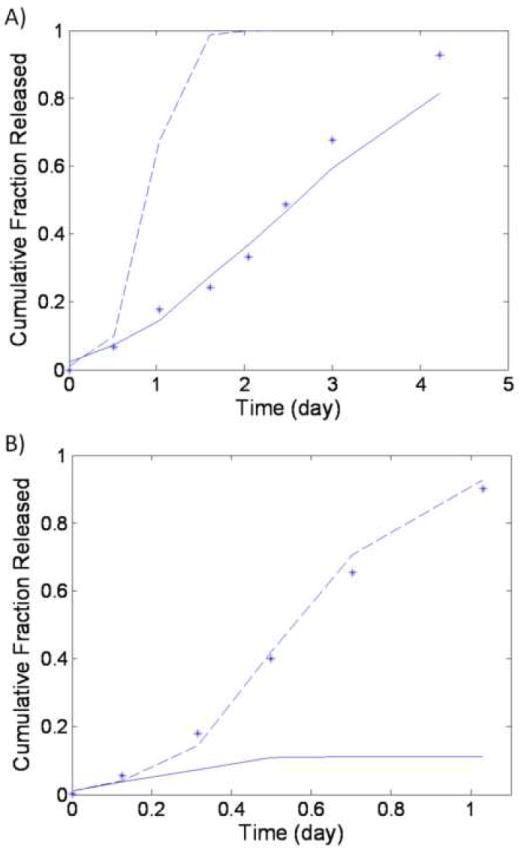
Predictions of release from (A) bulk eroding and (B) surface eroding poly(ortho ester) matrices. Predictions have been made for the experimental data for dye release (astricks), while accounting for the hydrolysis of the anhydride excipient, with the complete model (solid line, (A) SSE = 0.0237 and (B) SSE = 1.1539) and the simplified version which assumes bulk erosion (dashed line, (A) SSE = 1.0077 and (B) SSE = 0.0061). For calculations in both A and B, the following parameters were used: Mwo = 28.2 kDa, Mwr = 10.2 kDa, Rp = 5 mm, and L = 1.4 mm. Based on their differing anhydride contents, values of DA were unique to A and B, with DA = 1.44 × 10⁻¹² m2/s in A and DA = 9.75 × 10⁻¹² m2/s in B.
An examination of hydration and degradation profiles based on Equations 1 and 2 show that the current model can produce profiles that resemble surface erosion, bulk erosion and the transition between the two based on a careful selection of matrix size. Further, these degradation profiles (Figure 1A, B) provide a direct means for calculating a theoretical critical length (i.e. where a given polymer transitions from surface to bulk erosion) (Figure 2). In contrast to the original calculations of critical length, which used an Erlang distribution to represent the degradation rate,[22] this new calculation relies on a second order rate expression that can directly account for radial gradients in polymer molecular weight within the matrix. When accounting for the different degradation rates used in these two expressions, both sets of calculated values for critical length agree within order of magnitude for all systems tested.
Comparison of predictions from the model to experimental data from biodegradable matrices serves to validate elements of its release paradigm. The bupivacaine-loaded disks modeled in Figure 3 showcase the importance of the dissolution and hydration rate expressions in generating accurate (SSE = 0.0172) predictions for the release of a sparingly soluble agent from a polyanhydride matrix.[30] (Figure 3) Attempting to predict the release of bupivacaine without considering its slow dissolution produced inaccurate predictions. Conversely, predictions made without considering the system’s hydration kinetics show only a slight decrease in model accuracy. Prima facie, it may be surprising that a slight drop in accuracy is observed with this system which, being a bulk eroding system, is most often characterized by rapid, uniform hydration.[11] However, prior work indicates that, while bulk eroding systems in the micron size-range hydrate in minutes, bulk eroding implants (as defined by diffusion rate > degradation rate) on the order of millimeters can take days to become uniformly hydrated.[13] When such an implant only delivers drug over several days or weeks, this longer hydration time can significantly delay release, even though the system can be technically considered “bulk eroding”.
Regression-free predictions for the POE matrix (Figure 5A) provide a different view for the importance of accounting for various mechanisms of matrix dynamics and physical agent egress. Like the bupivacaine-loaded matrix featured in Figure 3, predictions for this system were also significantly better when hydration kinetics were accounted for by the model. This provides additional support for the conclusion that hydration kinetics can significantly influence the rate of drug release from bulk eroding implants. Unlike dissolution-limited release of bupivacaine, though, the readily-soluble amaranth red being released from this system is instead thought to only be restricted by the POE matrix. Because this system contained an anhydride excipient the model’s proven degradation-controlled release paradigm[12] was augmented to account for the consumption of water during anhydride hydrolysis. [31] Attempting to predict release from this system without accounting for the diversion of water into the hydrolysis of the anhydride lead to increased error between days 1 and 3, when the anhydride excipient is postulated to be hydrolyzing.[31] (data not shown) Even with this increased error, predictions from the current model still offer an improvement in accuracy (lower SSE) over prior modeling work.[31]
The implants examined in Figure 4 are slightly larger than the calculated critical length, and gentamicin is large enough to be readily restricted by the polymer matrix, making this a prime example of how release occurs in a system that transitions from surface to bulk erosion.[32] Support of the model paradigm for release from a transitioning system is found in the accurate regression-free prediction (SSE = 0.0821) data from this system.[32] (Figure 4). Failing to consider matrix hydration kinetics greatly (8-fold) decreases the accuracy of this prediction, as would be expected for a system that begins under surface erosion. This change is much more dramatic than the one observed for comparable bulk eroding systems (e.g. Figure 3), which provides a perspective on the crucial that role hydration kinetics play in systems that transition from surface to bulk erosion.
With respects to the POE controlled release data in Figure 5B, it is apparent that the simplified form of the model, assuming bulk erosion, generates a more accurate prediction of the amaranth red release data from the disk with 1% anhydride content than the full version of the model, even though the matrix should theoretically begin release under a surface eroding mechanism. However it is important to note that published empirical evidence, from time-lapse images of matrix cross-sections, clearly shows a distinct change in internal morphology, between 5 and 8 hours of incubation, that suggests water has already perfused into the matrix core.[35] This hydration appears to occur much more rapidly than is predicted by equations 1 and 2 (data not shown). During the time period between 5 and 8 hours, the initially rapid, average hydrolysis rate also transitions to a near zero value[31], which is inconsistent with published predictions based on random chain scission theory.[31] Taken together, this evidence suggests that another process, beyond the diffusion/reaction kinetics considered herein, causes water to perfuse the matrix earlier than expected by simple diffusion and hydrolysis for this system. It is possible that the unaccounted driving force could come from an increase in matrix osmotic pressure, brought about by the 1 w/w% of anhydride excipient.[36] Regardless, this data serves an example of how actual phenomena can create situations with dynamics that extend beyond model assumptions. However, once the correct physical phenomenon has been determined (using cross sectional analysis here), the model will accurately predict release if constrained accordingly.
Together, the validations performed on published release data sets (Figures 3-5) confirm that the regression-free predictions appear accurate when the systems in question conform to the model’s fundamental assumptions. System attributes, such as high loading (above the percolation threshold) or the presence of excipients, can cause the experimental data to deviate from model predictions. Future work could further expand the applicability of the model developed herein with addition of equations accounting for such phenomenon such as system osmotic pressure or drug percolation.
5. Conclusions
We have developed a new model for predicting release from surface eroding biodegradable matrices. This model attributes egress to matrix hydration, agent dissolution, and polymer degradation instead of relying on the traditional assumption that release is solely erosion controlled. Further, accounting for matrix hydration with diffusion/reaction equations captures the transition from surface to bulk erosion in common polymer systems. Strong agreement with multiple published data sets supports future use of the model as a design tool, allowing researchers to rapidly acquire the matrix specifications that will yield a desired release profile.
Glossary of Variables
- CA
Concentration of dissolved agent in the polymer matrix
- CAmx
Maximum concentration of dissolved agent (solubility limit)
- CAo
Initial concentration of dissolved agent
- CS
Concentration of solid, crystalline or powdered, agent
- CSo
Initial concentration of solid agent in the polymer matrix
- CW
Concentration of water in polymer matrix
- CWo
Concentration of water in the reservoir
- DA
Diffusivity of agent through the polymer matrix
- DW
Diffusivity of water through the polymer matrix
- ε
Matrix porosity
- k
Polymer degradation rate
- kdis
Agent dissolution rate
- L
Length of cylindrical matrix
- Mw
Polymer molecular weight
- Mwo
Average initial polymer molecular weight
- Mwr
Molecular weight of release
- P(t)
Cumulative fraction of agent retained in the matrix at time t
- R(t)
Cumulative fraction of agent released from the matrix by time t
- Rp
Matrix radius
- σ
Variance in Mwr
- t
Time
Abbreviations
- PFADSA
1:1 Poly(fatty acid dimer-co-sebacic acid) anhydride
- PLA
Polylactic acid
- PLGA
Poly(lactic-co-glycolic) acid
- POE
Poly(ortho ester)
- PSA
Polysebacic anhydride
Footnotes
Publisher's Disclaimer: This is a PDF file of an unedited manuscript that has been accepted for publication. As a service to our customers we are providing this early version of the manuscript. The manuscript will undergo copyediting, typesetting, and review of the resulting proof before it is published in its final citable form. Please note that during the production process errors may be discovered which could affect the content, and all legal disclaimers that apply to the journal pertain.
References
- 1.Jain JP, Modi S, Domb AJ, Kumar N. Role of polyanhydrides as localized drug carriers. Journal of Controlled Release. 2005;103(3):541–563. doi: 10.1016/j.jconrel.2004.12.021. [DOI] [PubMed] [Google Scholar]
- 2.Sinha VR, Trehan A. Biodegradable microspheres for protein delivery. Journal of Controlled Release. 2003;90(3):261–280. doi: 10.1016/s0168-3659(03)00194-9. [DOI] [PubMed] [Google Scholar]
- 3.Jain RA. The manufacturing techniques of various drug loaded biodegradable poly(lactide-co-glycolide) (PLGA) devices. Biomaterials. 2000;21(23):2475–2490. doi: 10.1016/s0142-9612(00)00115-0. [DOI] [PubMed] [Google Scholar]
- 4.Dorati R, Genta I, Colonna C, Modena T, Pavanetto F, Perugini P, et al. Investigation of the degradation behaviour of poly(ethylene glycol-co-d,l-lactide) copolymer. Polymer Degradation and Stability. 2007;92(9):1660–1668. [Google Scholar]
- 5.Sinha VR, Trehan A. Biodegradable microspheres for parenteral delivery. Critical Reviews in Therapeutic Drug Carrier Systems. 2005;22(6):535–602. doi: 10.1615/critrevtherdrugcarriersyst.v22.i6.20. [DOI] [PubMed] [Google Scholar]
- 6.Dang W, Daviau T, Ying P, Zhao Y, Nowotnik D, Clow CS, et al. Effects of GLIADEL® wafer initial molecular weight on the erosion of wafer and release of BCNU. Journal of Controlled Release. 1996;42(1):83–92. [Google Scholar]
- 7.Alexis F. Factors affecting the degradation and drug-release mechanism of poly(lactic acid) and poly[(lactic acid)-co-(glycolic acid)] Polymer International. 2005;54(1):36–46. [Google Scholar]
- 8.Gopferich A, Tessmar J. Polyanhydride degradation and erosion. Advanced Drug Delivery Reviews. 2002;54(7):911–931. doi: 10.1016/s0169-409x(02)00051-0. [DOI] [PubMed] [Google Scholar]
- 9.Arifin DY, Lee LY, Wang CH. Mathematical modeling and simulation of drug release from microspheres: Implications to drug delivery systems. Advanced Drug Delivery Reviews. 2006;58(12-13):1274–1325. doi: 10.1016/j.addr.2006.09.007. [DOI] [PubMed] [Google Scholar]
- 10.Siepmann J, Gopferich A. Mathematical modeling of bioerodible, polymeric drug delivery systems. Advanced Drug Delivery Reviews. 2001;48(2-3):229–247. doi: 10.1016/s0169-409x(01)00116-8. [DOI] [PubMed] [Google Scholar]
- 11.Gopferich A. Polymer bulk erosion. Macromolecules. 1997;30(9):2598–2604. [Google Scholar]
- 12.Rothstein SN, Federspiel WJ, Little SR. A simple model framework for the prediction of controlled release from bulk eroding polymer matrices. Journal of Materials Chemistry. 2008;18(16):1873–1880. [Google Scholar]
- 13.Batycky RP, Hanes J, Langer R, Edwards DA. A theoretical model of erosion and macromolecular drug release from biodegrading microspheres. Journal of Pharmaceutical Sciences. 1997;86(12):1464–1477. doi: 10.1021/js9604117. [DOI] [PubMed] [Google Scholar]
- 14.Siepmann J, Faisant N, Benoit JP. A new mathematical model quantifying drug release from bioerodible microparticles using Monte Carlo simulations. Pharmaceutical Research. 2002;19(12):1885–1893. doi: 10.1023/a:1021457911533. [DOI] [PubMed] [Google Scholar]
- 15.Gopferich A, Langer R. Modeling monomer release from bioerodible polymers. Journal of Controlled Release. 1995;33(1):55–69. [Google Scholar]
- 16.Kipper MJ, Narasimhan B. Molecular description of erosion phenomena in biodegradable polymers. Macromolecules. 2005;38(5):1989–1999. [Google Scholar]
- 17.Larobina D, Mensitieri G, Kipper MJ, Narasimhan B. Mechanistic understanding of degradation in bioerodible polymers for drug delivery. AIChE Journal. 2002;48(12):2960–2970. [Google Scholar]
- 18.Gopferich A, Karydas D, Langer R. Predicting drug release from cylindric polyanhydride matrix discs. European Journal of Pharmaceutics and Biopharmaceutics. 1995;41(2):81–87. [Google Scholar]
- 19.Gopferich A, Langer R. Modeling of polymer erosion. Macromolecules. 1993;26(16):4105–4112. [Google Scholar]
- 20.Gopferich A, Langer R. Modeling of polymer erosion in three dimensions: rotationally symmetric devices. AIChE Journal. 1995;41(10):2292–2299. [Google Scholar]
- 21.Gopferich A. Bioerodible implants with programmable drug release. Journal of Controlled Release. 1997;44(2-3):271–281. [Google Scholar]
- 22.Burkersroda F, Schedl L, Gopferich A. Why degradable polymers undergo surface erosion or bulk erosion. Biomaterials. 2002;23(21):4221–4231. doi: 10.1016/s0142-9612(02)00170-9. [DOI] [PubMed] [Google Scholar]
- 23.Schliecker G, Schmidt C, Fuchs S, Kissel T. Characterization of a homologous series of D,L-lactic acid oligomers; a mechanistic study on the degradation kinetics in vitro. Biomaterials. 2003;24(21):3835–3844. doi: 10.1016/s0142-9612(03)00243-6. [DOI] [PubMed] [Google Scholar]
- 24.Frenning G, Brohede U, Strømme M. Finite element analysis of the release of slowly dissolving drugs from cylindrical matrix systems. Journal of Controlled Release. 2005;107(2):320–329. doi: 10.1016/j.jconrel.2005.06.016. [DOI] [PubMed] [Google Scholar]
- 25.Saltzman WM, Langer R. Transport rates of proteins in porous materials with known microgeometry. Biophysical Journal. 1989;55(1):163–171. doi: 10.1016/S0006-3495(89)82788-2. [DOI] [PMC free article] [PubMed] [Google Scholar]
- 26.Shah SS, Cha Y, Pitt CG. Poly (glycolic acid-co-DL-lactic acid): Diffusion or degradation controlled drug delivery? Journal of Controlled Release. 1992;18(3):261–270. [Google Scholar]
- 27.Gopferich A. Mechanisms of polymer degradation and erosion. Biomaterials. 1996;17(2):103–114. doi: 10.1016/0142-9612(96)85755-3. [DOI] [PubMed] [Google Scholar]
- 28.Seader JD. Separation process principles. New York: Wiley; 1998. [Google Scholar]
- 29.Siepmann J, Elkharraz K, Siepmann F, Klose D. How autocatalysis accelerates drug release from PLGA-based microparticles: A quantitative treatment. Biomacromolecules. 2005;6(4):2312–2319. doi: 10.1021/bm050228k. [DOI] [PubMed] [Google Scholar]
- 30.Park ES, Maniar M, Shah JC. Biodegradable polyanhydride devices of cefazolin sodium, bupivacaine, and taxol for local drug delivery: Preparation, and kinetics and mechanism of in vitro release. Journal of Controlled Release. 1998;52(1-2):179–189. doi: 10.1016/s0168-3659(97)00223-x. [DOI] [PubMed] [Google Scholar]
- 31.Joshi A, Himmelstein KJ. Dynamics of controlled release from bioerodible matrices. Journal of Controlled Release. 1991;15(2):95–104. [Google Scholar]
- 32.Stephens D, Li L, Robinson D, Chen S, Chang HC, Liu RM, et al. Investigation of the in vitro release of gentamicin from a polyanhydride matrix. Journal of Controlled Release. 2000;63(3):305–317. doi: 10.1016/s0168-3659(99)00205-9. [DOI] [PubMed] [Google Scholar]
- 33.Domb AJ, Maniar M. Absorbable biopolymers derived from dimer fatty acids. Journal of Polymer Science, Part A: Polymer Chemistry. 1993;31(5):1275–1285. [Google Scholar]
- 34.Thombre AG, Himmelstein KJ. Simultaneous transport-reaction model for controlled drug delivery from catalyzed bioerodible polymer matrices. AIChE Journal. 1985;31(5):759–766. [Google Scholar]
- 35.Nguyen TH, Higuchi T, Himmelstein KJ. Erosion characteristics of catalyzed poly(ortho ester) matrices. Journal of Controlled Release. 1987;5(1):1–12. [Google Scholar]
- 36.Little SR, Lynn DM, Puram SV, Langer R. Formulation and characterization of poly (beta amino ester) microparticles for genetic vaccine delivery. Journal of Controlled Release. 2005;107(3):449–462. doi: 10.1016/j.jconrel.2005.04.022. [DOI] [PubMed] [Google Scholar]