

Abstract
The endoplasmic/sarcoplasmic reticulum (ER/SR) plays a crucial role in cytoplasmic signalling in a variety of cells. It is particularly relevant to skeletal muscle fibres, where this organelle constitutes the main Ca2+ store for essential functions, such as contraction. In this work, we expressed the cameleon biosensor D1ER by in vivo electroporation in the mouse flexor digitorum brevis (FDB) muscle to directly assess SR Ca2+ depletion in response to electrical and pharmacological stimulation. The main conclusions are: (1) D1ER is expressed in the SR of FDB fibres according to both di-8-(amino naphthyl ethenyl pyridinium) staining experiments and reductions in the Förster resonance energy transfer signal consequent to SR Ca2+ release; (2) the amplitude of D1ER citrine/cyan fluorescent protein (CFP) ratio evoked by either 4-chloro-m-cresol (4-CmC) or electrical stimulation is directly proportional to the basal citrine/CFP ratio, which indicates that SR Ca2+ modulates ryanodine-receptor-isoform-1-mediated SR Ca2+ release in the intact muscle fibre; (3) SR Ca2+ release, measured as D1ER citrine/CFP signal, is voltage-dependent and follows a Boltzmann function; and (4) average SR Ca2+ depletion is 20% in response to 4-CmC and 6.4% in response to prolonged sarcolemmal depolarization. These results indicate that significantly depleting SR Ca2+ content under physiological conditions is difficult.
Keywords: Skeletal muscle, Calcium, Sarcoplasmic reticulum
Introduction
Understanding the complex regulation of endoplasmic/sarcoplasmic reticulum (ER/SR) Ca2+ release and its contribution to cytoplasmic signalling is important in a variety of cells. This organelle is particularly relevant for muscle fibres, where it constitutes the main Ca2+ store for basic functions, such as contraction.
In mammals, however, loading only the skeletal muscle SR with Ca2+-sensitive indicators presents technical difficulties that seriously hamper our ability to determine its Ca2+ concentration and release kinetics. Limitation to measure Ca2+ concentration and dynamics had prevented reliable examination of questions relevant to muscle fibre physiology and pathology. Whether ER/SR Ca2+ depletion controls SR Ca2+ release channel/ryanodine receptor (RyR) and/or SR Ca2+ release termination is unknown, whilst its influence on Ca2+ influx via activation of a store-operated Ca2+ entry (SOCE) is debatable [15, 21, 36]. Putative mechanisms are triggered by a considerable decline in SR Ca2+, at least in non-excitable cells [25]. Assessing Ca2+ depletion as a consequence of SR Ca2+ release is relevant to examining lumenal Ca2+ buffer capacity and the mechanisms of Ca2+-dependent regulation of RyR function, termination of SR Ca2+ release, activation of SOCE and age-dependent decline in SR Ca2+ release [18]. The pathogenesis of disease states, such as muscular dystrophy, malignant hyperthermia and fatigue syndromes, will undoubtedly benefit from a better understanding of lumenal SR Ca2+ homeostasis.
Although not exempt from limitations [7], measuring Ca2+ release using engineered protein expression targeted to the SR is increasingly important [27, 38]. It has been claimed that the genetically encoded Ca2+ indicator D1ER, created by redesigning the binding interface of calmodulin and a calmodulin-binding peptide, has better reaction kinetics and exhibits a theoretically appropriate dissociation constant for tracking changes in SR/ER or SR Ca2+ concentration compared to previous Förster resonance energy transfer (FRET)-based cameleons. In addition, it is not perturbed by large excesses of native calmodulin [27, 28]. Therefore, D1ER has been proposed as a promising tool to examine Ca2+ dynamics in the SR lumen of various cell types [28, 49], including skeletal muscle fibres [38], in the only study in the literature to examine skeletal muscle SR Ca2+ release. Although this publication is intriguing, a number of questions remain about: (1) the variability in resting SR Ca2+ concentration amongst fibres of the same muscle; (2) the reproducibility of the D1ER signal; (3) the dependence of D1ER signal amplitude on basal SR FRET signal; (4) the magnitude of SR Ca2+ depletion in response to maximal fibre stimulation; (5) the voltage dependence of the lumenal SR Ca2+ response detected with D1ER; and (6) the timeframe of the SR and cytosolic Ca2+ transient.
The present study aims to extend previous work [38] to answer the questions above in voltage-clamped adult mouse flexor digitorum brevis (FDB) muscle fibres monitored using the SR Ca2+ biosensor D1ER. Maximal SR Ca2+ release is also examined by bypassing the physiological Cav1.1/ryanodine receptor-1 (RyR1) coupling and directly stimulating RyR1. For this application, we used the specific RyR1 agonist 4-chloro-m-cresol (4-CmC) based on the reproducibility of its action and the lack of any reported effect on SR Ca2+ refilling.
Materials and methods
Flexor digitorum brevis muscle fibres
Single skeletal muscle fibres from the FDB were obtained from 3- to 5-month-old Freund virus B(FVB) mice raised in the Animal Research Program of Wake Forest University School of Medicine (WFUSM). Mice were killed by cervical dislocation. Animal handling followed a protocol approved by the WFUSM Animal Care and Use Committee.
FDB fibre electroporation and D1ER expression location
The pcDNA3 plasmid carrying the cameleon biosensor D1ER [28], kindly provided by Dr. Roger Y. Tsien (Department of Pharmacology and Howard Hughes Medical Institute, University of California at San Diego), was electroporated into the FDB muscle from FVB mice following described methods [8]. To determine D1ER subcellular expression, FDB fibres were enzymatically dissociated 2 weeks after muscle electroporation [45, 46]. Fibres expressing D1ER were stained with 5 μM di-8-amino naphthyl ethenyl pyridinium (di-8-ANEPPS) for 30–45 min, and images were recorded with a Radiance 2100 (Bio-Rad, Zeiss) confocal microscope with a Fluar ×100/1.30 objective (Zeiss). D1ER and di-8-ANEPPS signals were excited by an argon laser at 488 nm, whilst the emission wavelengths were 528 and 600 nm, respectively. The 488-nm laser wavelength, although not optimal for CFP, directly excites citrine as reported [35].
Intracellular Ca2+ fluorescence
Enzymatically dissociated FDB fibres were voltage-clamped in the whole-cell configuration of the patch-clamp technique [16], according to described procedures specific for muscle fibres [45]. Potential voltage errors associated with whole-cell recording in large cells were minimised by selecting small FDB fibres and adequately compensating for whole-cell capacitance transients. The pipette electrode was filled with the following solution (mM): 130 Cs aspartate, 2 MgCl2, 10 Cs2 ethylene glycol tetraacetic acid (EGTA), 10 HEPES, 5 Na-ATP and 0.5 GTP; pH was adjusted to 7.3 with CsOH. High EGTA was used in the pipette solution to reproduce experimental conditions like those in a series of studies on FDB muscle fibres in which SR Ca2+ release was recorded in the cytosol [13, 18, 47, 48]. The electrode resistance ranged from 450 to 650 kΩ. We have not seen any difference in Ca2+ uptake kinetics in the presence or absence of 10 mM EGTA in the cytoplasm (data not shown), which may be explained by the slow dissociation of the cameleon/Ca2+ complex (see below). The external solution contained (in mM): 100 tetraethylammonium hydroxide (TEA)-OH, 50 Na2SO4, 2 MgSO4, 2 CaSO4, 2 3-4DAP and 5 Na-HEPES. Solution pH was adjusted to 7.3 with CH4SO3 [18, 45]. These solutions ensured good control of resting leakage currents, and the preparation was well preserved throughout the experiment. Methane sulfonic acid is the counterion to TEA. Drift and noise imposed by silver chloride wires are corrected by standard methods. All experiments were recorded at room temperature (21–22°C).
Fluorescence was recorded 2 weeks after FDB electroporation using an Axiovert 200 microscope and a spectrofluorometer (PTI, Birmingham, NJ, USA) with a ×20/0.75 or ×40W/1.2 objective (Zeiss). For Fura-2FF (Invitrogen, Carlsbad, CA, USA), excitation and emission wavelengths were set at 350/380 and 510 nm, respectively. Ratiometric citrine/CFP data were recorded with a dual photomultiplier (see below).
SR Ca2+ release and cytosolic Ca2+ transients were recorded sequentially (20-s interval). No differences in the amplitude and kinetics of cytosolic Ca2+ release monitored with Fura-2FF were apparent in D1ER transfected and untransfected fibres (data not shown). Fura-2FF was loaded into the fibre via the patch pipette. Resting Ca2+ concentration was measured in dissociated fibres loaded with 5 μM Fura-2 AM mixed with 10% (v/v) pluronic acid (Invitrogen) in anhydrous dimethyl sulfoxide (DMSO) acid at <4, 5–23 and 24 h after dissociation. DMSO was kept at 0.05% final concentration. Ratiometric traces were converted into Ca2+ concentration using the following equation: Ca2+ = KD(R – Rmin)/(Rmax – R) (β) [14], where R is fluorescence ratio measured at 340 and 380 nm; KD is the Fura affinity constant for Ca2+; and β is the intrinsic ratio of intensities of free vs. Ca2+-bound indicator [14]. A KD value of 51 μM [17] and Rmax and Rmin of 3.5 and 0.02 were measured.
Statistics
Values are given as mean±SEM with the number of observations (n). Statistical analysis was performed using Student’s unpaired t test and the Mann–Whitney rank sum test when values were not normally distributed. P<0.05 was considered significant.
Results
D1ER expression in the SR of FDB fibres
We first examined whether D1ER is expressed in the SR of FDB fibres. Figure 1a shows that expression of the SR Ca2+ biosensor produces a striated pattern when recorded with epifluorescence microscopy at two magnifications. Fibres expressing D1ER were stained with di-8-ANEPPS and examined with confocal microscopy to determine the position of the sarcotubular system (Fig. 1b). As expected, the D1ER and di-8-ANEPPS images show similar dualstriation patterns and almost complete overlap due to the sarcotubular system’s proximity to the SR terminal cisternae at the muscle fibre triad. Figure 1c shows the fluorescence intensity profiles corresponding to the rectangular area spanning three sarcomeric spaces drawn on Fig. 1b.
Fig. 1.
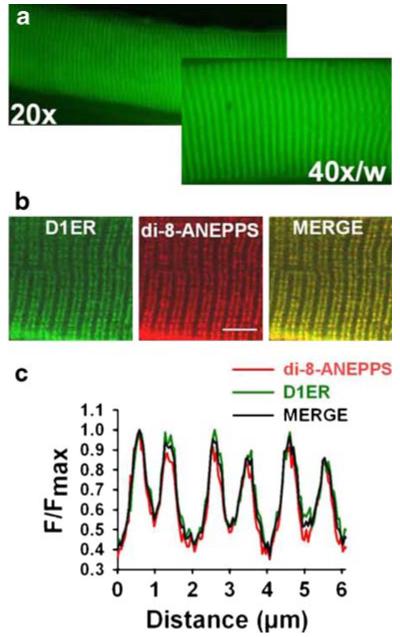
D1ER is expressed in the SR of FDB fibres. a D1ER epifluorescence recorded in the same FDB fibre at two magnifications, ×20 and ×40. b FDB fibres expressing D1ER, stained with di-8-ANEPPS (t-tubules) and imaged with a confocal microscope, show a striation pattern (merged image). The calibration bar is 5 μm. c Normalised fluorescence intensity profiles for D1ER and di-8-ANEPPS, measured in the rectangular area shown in b
RyR1 mediates SR Ca2+ release recorded with D1ER
To verify that RyR1 mediates the Ca2+ release detected with D1ER, we voltage-clamped FDB fibres at −80 mV and exposed them to the channel blocker ryanodine. Peak SR Ca2+ fluorescence decreased with time after applying 5 μM ryanodine extracellularly. Figure 2 illustrates D1ER fluorescence in response to a series of three consecutive 100-ms pulses delivered every 3 s before (a) and 20 min after (b) applying ryanodine. The amplitude of the citrine/CFP ratio at 20 min after applying the drug compared to time zero was 0.09±0.03 (n=3). During ryanodine application, basal R was 1.61±0.27 and 1.49±0.28 at times 0 and 20 min, respectively. This difference was not statistically significant (P>0.05). As RyR1 is the only isoform expressed in adult skeletal muscle [3, 33, 37], these results indicate that this RyR isoform mediates decreases in SR Ca2+ in response to sarcolemmal depolarization. Using two pharmacological agents that bind the SR Ca2+ release channel/ryanodine receptor with high affinity, an antagonist (ryanodine) and an agonist (4-CmC, see below), allows us to demonstrate that the recorded D1ER signal corresponds to Ca2+ released from the SR lumen through the ryanodine receptor. The slow timescale of the effect indicates slow diffusion of the agent. The kinetics of ryanodine binding to its receptor may be a contributing factor.
Fig. 2.

Ryanodine receptor inhibition prevents decline in D1ER FRET. Peak fluorescence amplitude decreased with time after adding 10 μM ryanodine to the bath solution. D1ER fluorescence in response to a series of three consecutive 100-ms pulses before (a) and 20 min after (b) applying the drug. The interval between trains was 3 s
Resting SR Ca2+ exhibits great variability
Basal SR Ca2+, expressed as the ratio between fluorescence signals attributed to citrine and CFP, was measured in 100 FDB fibres showing a value (mean±SEM) of 1.62±0.10 with a range of 0.39–7.40 (Fig. 3a). This high variability is surprising as all fibres examined were from 19 healthy mice of the same strain (FVB) and same age range (3–5 months). They were confined to cages of the same size and exhibited similar levels of physical activity. This variability does not seem to be an exclusive property of the FDB muscle; a significant but less pronounced variability was reported in the mouse tibialis anterior muscle using D1ER as the SR Ca2+ biosensor in vivo (basal citrine/CFP ratio range 2.2–4.0) [38].
Fig. 3.

Basal citrine/CFP ratio and its dependence on time after fibre dissociation. a Basal citrine/CFP ratio in 100 FDB fibres. b Basal citrine/CFP ratio at different times after fibre dissociation. The number of fibres analysed at 0–10, 11–20 and more than 24 h are expressed in parentheses above the bars
Figure 3b shows the stability of the citrine/CFP ratio in FDB fibres under voltage-clamp over 48 h after dissociation. The number of fibres examined, not included in Fig. 3a, was 33, 12 and 12 at 0–10, 11–20 and 24–48 h, respectively. These results indicate that the variability of SR Ca2+ loading described above does not depend on the time after dissociation that the fibre was examined as differences between the three time periods are not statistically significant.
The variability of the basal citrine/CFP ratio prevented us and another group [38] from reliably calibrating the biosensor because we could not define a single set of Rmin and Rmax values to transform citrine/CFP ratios into Ca2+ concentrations. Palmer et al. [27] suggested that calibration should be performed in each experimental fibre. We believe this is a reasonable approach for culture cell lines but rather cumbersome for muscle fibre patch-clamp studies.
Fractional SR Ca2+ release in response to electrical stimulation
Figure 4a shows SR Ca2+ fluorescence in response to a 200-ms pulse to 20 mV at two emission wavelengths, 535 nm (citrine) and 485 nm (CFP), and their ratio (citrine/CFP). The decrease in citrine was larger than the increase in CFP emission, producing a decreased citrine/CFP ratio in the SR lumen as an expression of decreased FRET. We have recorded a decrease in D1ER signal in response to electrical stimulation in only 17 out of 32 fibres (53%) voltage-clamped in the whole-cell configuration of the patch clamp, despite the similar basal citrine/CFP ratio (Fig. 4b). We observed a stereotypical D1ER expression pattern in all fibres inspected with confocal microscopy (see above). Therefore, its accumulation in pre-SR compartments is improbable. FDB cell appearance and electrical properties in responding and non-responding fibres was similar, so it is not obvious why approximately half the fibres examined did not respond. Unfortunately, we cannot find any publications with which to compare our success rate. Figure 4c illustrates the citrine/CFP ratio at four potentials from −40 to 20 mV, with the 20-mV interval corresponding to the steeper part of the curve. The relationship between membrane voltage and the normalised citrine/CFP ratio was examined in 14 fibres. Data points corresponding to the amplitude of the FRET decline were fitted to a Boltzmann equation of the form F = Fmax/[1 + exp(VF1/2 – Vm)/K]. The amplitude of the signal was measured from onset (average of ten points immediately before application of the command pulse) or the basal fluorescence (average of ten baseline points before application of the train of pulses) to nadir (see Fig. 5a). vF1/2 and K values were −15.7±0.9 and 5.7±0.7, respectively. Ca2+ response was detected at −27± 3.3 mV. Figure 4d shows the direct linear relationship between the basal SR citrine/CFP ratio and citrine/CFP response amplitude examined in 17 fibres (r2=0.6; Pearson correlation=0.776, P=0.0025). These results indicate that basal SR Ca2+ modulates the amplitude of SR Ca2+ release and contradict a previous report in which the normalised drop of the YFP/CFP ratio during twitch/basal YFP/CFP exhibited an inverse relationship [38]. The maximal decrease in D1ER ratio elicited by a 100-ms pulse to 20 mV was (mean±SEM) 6.45±0.8%, with a range of 2.6–11.7% (n=16). Longer pulses have been applied (see below), but the magnitude of SR Ca2+ depletion did not increase further. These results indicate that SR Ca2+ depletion is almost negligible in response to pulses 100 times longer than those necessary to elicit an action potential.
Fig. 4.

Voltage dependence of D1ER FRET. a Citrine and CFP fluorescence and their ratio. b Average basal citrine/CFP ratios corresponding to fibres responding or not responding to electrical stimulation. The number of fibres per group is expressed between parentheses. c Voltage-normalised citrine/CFP ratio relationship. Data points, measured from the onset of the signal to nadir, were fitted to a Boltzmann equation. See the text for the best-fitting parameters. The upper panel illustrates the citrine/CFP ratio at four potentials. d Linear relationship between basal citrine/CFP ratio and the amplitude of the citrine/CFP response to 100-ms pulses to 20 mV
Fig. 5.

SR D1ER FRET in response to repetitive electrical stimulation. a D1ER response to a sequence of five sequential pulses (100 ms, 20 mV) showing where the basal-nadir and onset–nadir ratios were measured. b Voltage–normalised citrine/CFP ratio relationship. Data points, measured from the basal level of the signal to nadir, were fitted to a Boltzmann equation. See the text for the best-fitting parameters. Normalised citrine/CFP ratio amplitude for each pulse using the basal-to-nadir (c) or onset-to-nadir (d) relationships
Examination of SR Ca2+ release elicited by repetitive electrical stimulation shows reproducible responses with cumulative SR Ca2+ depletion. Figure 5a shows the citrine/CFP ratio in response to a sequence of five 100-ms command pulses to 20 mV. We measured the normalised citrine/CFP amplitude for the five pulses from basal or onset (asterisk) to nadir. Figure 5b shows the normalised citrine/CFP ratio as a function of membrane voltage. Data were fitted to a Boltzmann equation as described above. vF1/2 and K values were −14.3±0.6 and 5.8±0.5, respectively, for the basal-to-nadir relationship (n=14). Figure 5c shows the normalised citrine/CFP amplitude, measured as the basal-to-nadir relationship as a function of pulse number. Progressive SR Ca2+ depletion for the first three pulses, with no further decrease, is observed, which may indicate that Ca2+ accumulation in the cytosol results in a larger cytosolic/SR Ca2+ gradient, rendering the SR Ca2+ pump more efficient [26]. As expected, the amplitude of the citrine/CFP ratio responses, measured as the onset-to-nadir relationship, did not significantly vary throughout the train of pulses (Fig. 5d). These results indicate that SR Ca2+ replenishment is effective but slower than that recorded with low-affinity cytosolic Ca2+ indicators [6, 12]. This slow signal is characteristic of cameleon sensors [7].
Further analysis of the D1ER signal elicited by progressively longer command pulses showed a graded increase in the citrine/CFP ratio amplitude with saturation in response to pulses longer than 150 ms. Figure 6a shows a family of Ca2+ currents (a, b) and their corresponding decline in SR D1ER FRET (c, d) evoked by 100-, 150- and 200-ms pulses to 20 mV. A more pronounced citrine/CFP ratio decline was induced using this protocol. Increasing the pulse duration to 600-, 1,100-, 1,600- and 2,100-ms achieved steady state. These representative studies of 14 fibres used various pulse durations. Figure 6b shows progressive SR Ca2+ depletion for short pulses (<150 ms), but it remained steady with more prolonged depolarization (>150 ms), possibly due to cytosolic Ca2+ accumulation, which leads to RyR1 inactivation and inhibition of SR Ca2+ release.
Fig. 6.
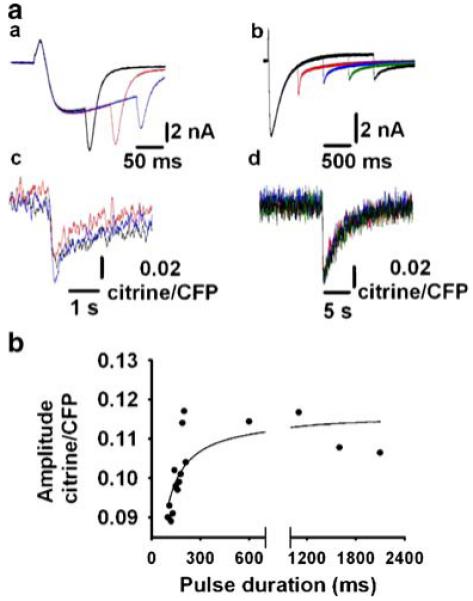
Effect on D1ER FRET of prolonging electrical stimulation. a Inward Ca2+ currents and citrine/CFP ratio in response to 100-, 150- and 200-ms pulses (a, c) or 600-, 1,100-, 1,600- and 2,100-ms pulses (b, d) to 20 mV, respectively. b Citrine/CFP ratio amplitude as a function of pulse duration
Voltage-dependent changes in D1ER lumenal signal and cytoplasmic Ca2+ transients
FDB fibres expressing D1ER were loaded with 200 μM Fura-2FF via the patch pipette and depolarized with 600-ms command pulses from vh=-80 to 20 mV (Fig. 7a). Normalised citrine/CFP ratios for the maximal ratiometric signals (R/Rmax) of D1ER (a) and Fura-2FF (b) were sequentially recorded and displayed in the same timescale. The kinetics of SR Ca2+ release and uptake is similar to the cytoplasmic Ca2+ transient increase and decay but slower than that reported in EDL fibres using furaptra (see above). The amplitude and voltage dependence of cytosolic Ca2+ is similar to that reported in adult FDB fibres [18]. Also, thevoltage dependence and amplitude of the cytoplasmic signal is similar to that of SR Ca2+ release examined with D1ER. The time-to-peak of the D1ER signal was 114±23 and 186±75 ms at 0 and 10 mV, respectively, whilst for Fura-2FF the time-to-peak was 170±31 and 139±10 ms, respectively. Apparent differences in the voltage dependence of the cytosolic and SR Ca2+ and time-to-peak of D1ER and Fura-2FF signals were not statistically significant. Figure 7b (a) shows Ca2+ transients recorded in response to increasing fibre depolarization. Figure 7b (b) shows the peak Fura-2FF ratio normalised to the maximal response in each fibre (R/Rmax) as a function of membrane voltage. Data points were fitted to a Boltzmann equation. Half-activation potential and curve steepness were −14.9±2.7 mV and K = 7.2 ± 0.9, respectively (n=7 fibres). These values do not differ significantly from those recorded for D1ER using the basal–nadir or onset–nadir, respectively. Elevations in cytoplasmic Ca2+ were detected at −20± 3.8 mV, similar to the D1ER signal.
Fig. 7.

Voltage-dependent D1ER FRET signal and cytoplasmic Ca2+ transients. a An FDB fibre, expressing D1ER and loaded with 200 μM Fura-2FF via the patch pipette, depolarized with two command pulses from vh=−80 to 20 mV for 600 ms. Normalised ratiometric signals (R/Rmax) for D1ER (a) and Fura-2FF (b) were sequentially recorded (20-s interval) and displayed in the same timescale. b (a) Fura-2FF fluorescence signals in response to command pulses from −70 to 20 mV. (b) Relationship between the normalised Fura-2FF ratio (R/Rmax) and membrane voltage (mV) fitted to a Boltzmann equation. See text for best-fitting parameters. Data points represent the mean± SEM of seven fibres
Fractional SR Ca2+ release in response to pharmacological RyR1 activation
We then investigated the magnitude of SR Ca2+ release depletion evoked by direct RyR1 activation. Figure 8a shows the time course of D1ER FRET in a FDB fibre exposed to the RyR agonist (4-CmC, top bar), which was removed after peak FRET decline was reached. The top panel illustrates the fibre’s fluorescence, recorded with confocal microscopy at three time points after exposure to 1 mM 4-CmC. Figure 8b shows changes in citrine/CFP amplitude ratio as a function of the resting/basal SR citrine/CFP in response to 4-CmC application. The citrine/CFP ratio values for most fibres are grouped between 1.0 and 3.0, whilst only one exhibits a ratio of ~7. These data indicate a linear relationship between basal citrine/CFP ratio and amplitude of 4-CmC-evoked RyR activation. The decrease in SR D1ER FRET elicited by 4-CmC was (mean±SEM) 20.6±3.6%, with a range of 6.6–57.4% (n=15). These results indicate that prolonged SR Ca2+ release depletes only a small fraction of the SR Ca2+. The amplitude of SR Ca2+ release in response to a 100-ms voltage pulse to 20 mV (see above) is about one third of the Ca2+ mobilised by 4-CmC, and neither activating manoeuvre comes close to completely depleting SR Ca2+.
Fig. 8.
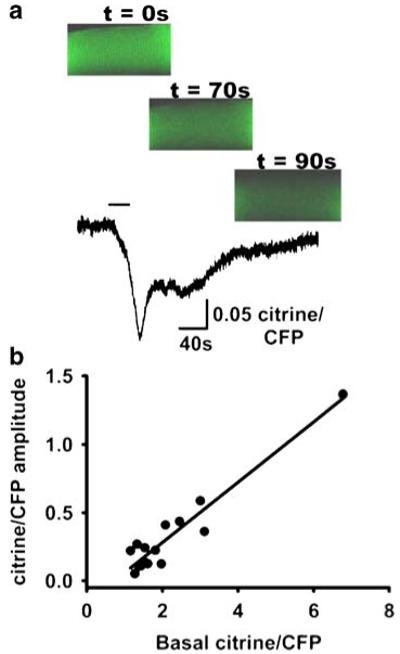
Ryanodine receptor activation elicits SR Ca2+ release. a Time course of D1ER FRET in an FDB fibre exposed to the RyR agonist 4-CmC (top bar=30 s). The top panel illustrates fibre fluorescence before (t=0) and after (t=70 and 90 s) exposure to 1 mM 4-CmC. The dimensions of the three images are 30×60 μm. b Basal citrine/CFP–citrine/CFP amplitude in response to 4-CmC application (n=15 fibres)
Discussion
Two properties of D1ER, its expression at the SR (this work) and the decline in FRET signal in the presence of Ca2+ [27], which have been analysed in detail, are crucial to examining SR Ca2+ dynamics. Despite the technical limitations described above and in a previous publication [38], analysing the D1ER ratiometric signal recorded in muscle fibre provides useful information about relative SR Ca2+ changes and is required to estimate SR Ca2+ depletion. Relative changes in citrine/CFP ratio, rather than [Ca2+]er, have been reported using D1ER in arterial smooth muscle [49], HEK-293 cells expressing RyR2 [19] and vascular endothelial cells [31].
This work concludes that: (1) the biosensor D1ER is expressed in the SR of FDB fibres according to both di-8-ANEPPs staining, co-registration with D1ER fluorescence experiments and reductions in the FRET signal consequent to electrical and pharmacological stimulation. (2) The basal citrine/CFP ratio shows great variability in electroporated FDB fibres obtained from a homogeneous mouse population. (3) The decline in SR D1ER signal evoked by electrical or pharmacological stimulation of FDB fibres is directly proportional to the basal D1ER ratio, indicating that SR lumenal Ca2+ modulates SR Ca2+ release. (4) SR Ca2+ release as measured with D1ER is voltage dependent and follows a Boltzmann function. (5) The average SR Ca2+ depletion is 20%—with a maximum of 57%—in response to 4-CmC and 6.4%—with a maximum of 11.7%—in response to prolonged or maximal sarcolemmal depolarization, respectively. (6) The time to peak of SR Ca2+ release and cytoplasmic Ca2+ transient at maximal sarcolemmal depolarization does not differ significantly.
D1ER morphological and functional expression in the FDB fibre SR
The dual-striation pattern of D1ER overlapping the T-tubule projections detected with 8-di-ANEPPS indicates that the Ca2+ biosensor is predominantly expressed at the SR terminal cisternae. This conclusion is consistent with the observation that mammalian skeletal muscle fibres display two triads per sarcomere, one on each A–I band interface [10][11, 22]. The fluorescence between these two rows (see Fig. 1b, c) may imply D1ER expression in the longitudinal SR as well.
We rule out the possibility that D1ER is located in the cytosol because, in addition to the morphological evidence, basal fibre fluorescence is intense, which indicates that the biosensor is exposed to a Ca2+ environment as high as that reported in the SR by biochemical methods (see below). Thus, under high Ca2+ conditions, the cameleon shows a decrease in CFP and an increase in citrine emission, indicating increased FRET. In contrast, the cytosolic compartment is strongly buffered, and basal-free Ca2+ is below 50nM, preventing significant D1ER FRET. Resting myoplasmic Ca2+ concentration using 5 μM Fura-2 AM <4, 4–23 and 24 h after dissociation was (in nM; mean±SEM): 34.7±0.25, 13.7±0.23 and 16.1±0.22, respectively (n=10 fibres for each time group) in D1ER-expressing FDB fibres.
We do not know whether the D1ER FRET decrease in response to fibre excitation fully represents SR Ca2+ release, or the signal is influenced by Ca2+ redistribution between bound and unbound conformations of the biosensor and calsequestrin. D1ER FRET measurements in a calsequestrin knockout mouse model can probably answer this question.
SR Ca2+ release measured in the whole-cell configuration may underestimate Ca2+ depletion at the SR terminal cisternae. We do not know the relative contribution of the longitudinal or junctional SR components to our recordings. Future studies using a spot scanning confocal microscope [9] may help to answer this question.
D1ER compared to other methods used to assess SR Ca2+ release in skeletal muscle
Various methods have been used to assess SR Ca2+ in skeletal muscle fibre. Fluo-5 N AM was successfully loaded into toad muscle fibre SR [20]. In mammals, it has, to our knowledge, been applied to cardiac [34, 39] but not skeletal muscle. Prolonged tetanic activation decreased basal SR fluorescence 40% [20]. Launikonis et al. [24] measured a 10% SR depletion evoked by brief electrical stimulation using shifted excitation and emission ratioing of fluorescence. A 14% decline in SR Ca2+ was reported in frog muscle triggered by individual action potentials using the H+ displacement from EGTA loaded into the cytoplasm as an indirect measure of Ca2+ release [30]. In summary, taking into account the duration of fibre activation, measures of declined D1ER FRET reported here are lower than the percent of Ca2+ decline recorded with any other method.
The use of cameleon Ca2+ sensors represents an advance over previous methods. First, they can be selectively targeted to intracellular organelles using intact cells or tissues in vivo or in vitro. Second, their ratiometric property minimises confounding factors, such as mechanical artefacts and probe concentration. The slow dissociation of the cameleon/Ca2+ complex is a limitation, but it does not prevent reliable peak D1ER FRET transient recordings [5]. Unfortunately, quantifying Ca2+ concentration is limited by difficulties in calibrating D1ER in vivo.
Some studies have reported an SR Ca2+ concentration of ~1 mM in frog muscle fibres [40, 44], whilst a threefold to fourfold lower value (~308 μM) was noted using the Ca2+ biosensor D1ER [38]. To transform the D1ER FRET signal into Ca2+ concentration, this group used a Kd for the Ca2+ value of 200 μM and Rmin and Rmax of 1.5 and 4.0, respectively. This approach is problematic for several reasons. The KD was measured in HeLa cells, which may not reflect muscle cell ionic composition and viscosity. Also, the D1ER was assumed to be saturated at the highest basal citrine/CFP ratio value recorded. That value was used as the Rmax, but, as we have shown here, the D1ER signal expands over a wider fluorescence range, so it may be inaccurate. Additionally, treating muscle fibre with cyclopiazonic acid for 30 min does not seem sufficient to induce a maximal SR Ca2+ depletion for Rmin estimation. Significant SR Ca2+ depletion requires multiple fibre stimulations with a RyR1 agonist in the presence of a SR Ca2+ pump inhibitor as demonstrated previously [21]. We believe that the D1ER ratiometric signal can be transformed into Ca2+ only if Rmax and Rmin are measured in the experimental fibre, which is rather difficult for the reasons discussed above. Thus, SR Ca2+ concentration remains unknown for intact adult mammalian skeletal muscle. On the other hand, relative changes in D1ER FRET provide information about SR Ca2+ dynamics and SR depletion.
Rudolph et al. [38] reported a maximal drop in SR Ca2+ concentration of ~17%, detected with D1ER in mouse skeletal muscle, whilst the decrease in the absolute citrine/CFP ratio ranged from 3% to 25% of the basal value. Our data show a similar mean value but for 4-CmC experiments in which the release represented a 20% decline in D1ER FRET, whilst the mean decline in response to voltage pulses was considerably less (6.4%). Perhaps nerve stimulation generates a more synchronic SR Ca2+ release along the muscle fibre than that recorded under voltage clamp. Given the amplitude of the D1ER FRET responses to 4-CmC application or electrical stimulation reported here, lower D1ER expression may provide a larger fractional signal. FDB fibres, electroporated with the biosensor, exhibit variable expression levels, and the data shown in Fig. 4 enable us to establish a linear relationship between the basal citrine/CFP ratio and the electrically evoked citrine/CFP amplitude ratio. Therefore, our experiments do not support the possibility that lower D1ER expression leads to a larger fractional FRET signal. Moreover, in the initial stages of this work, recordings earlier than 7–10 days after muscle electroporation resulted in fainter D1ER signals than those reported here (data not shown).
Relevance of quantifying D1ER FRET signal amplitude and dynamics
Quantifying D1ER FRET signal amplitude and dynamics helps to determine Ca2+-dependent regulation of RyR1 function, termination of SR Ca2+ release and activation of SOCE in the cellular environment.
Ca2+-dependent regulation of RyR function
Although cooperative Ca2+-dependent RyR activation has been proposed [4, 42], this work shows a direct correlation between basal citrine/CFP and this ratio’s amplitude in response to electrical or pharmacological stimulation of the fibre. Results in the literature disagree on the relationship between Ca2+ concentration/loading in the RyR lumenal side and Ca2+ flux, channel activity and Ca2+ sparks (for a discussion, see [36]). Although not a direct demonstration, our results are the first to support the concept that lumenal SR Ca2+ modulates RyR1-meditated SR Ca2+ release in intact muscle fibre.
Termination of SR Ca2+ release
A fast significant decline in lumenal SR Ca2+ led to the termination of Ca2+ sparks in cardiac myocytes [50] where a whole-cell calcium transient releases about 50% of stored SR Ca2+ [2, 41]. In contrast, the percent of decline in D1ER FRET signal in response to a maximal and a prolonged depolarization in the skeletal muscle fibre reported here is almost ten times less, or about a fifth, when the mean or maximal values are considered, respectively. Our results suggest that SR Ca2+ depletion is unlikely to be decisive in stopping SR Ca2+ release. Whether RyR1 is more sensitive than RyR2 to changes in SR Ca2+ concentration is not known; further experiments in intact whole muscle fibre are needed.
Activation of SOCE
It has been suggested that prolonged muscle stimulation activates SOCE [29, 43]. However, in the present study, 4-CmC applied for as long as 30 s elicits only a 20% decline in D1ER FRET. SR Ca2+ release in response to a 100-ms pulse recovers up to ~80% in 3–4s and in minutes in mouse muscle bundles [29]. Although SOCE activation in the seconds range has been reported in skinned fibres [23], whether it plays a physiological role in the intact cell is unknown. Our data show a 6.4% decrease in D1ER FRET in response to electrical stimulation, consistent with previous work on ageing muscle fibres [33]. When single FDB fibres from ageing mice are stimulated repetitively in the absence of extracellular Ca2+, tetanic force declines to zero [33]. Under these conditions, 4-CmC elicits a contracture of the same amplitude as that recorded in response to a maximal tetanus in the same fibre [32], indicating that significant decrease in SR Ca2+ consequent to prolonged fibre stimulation is unlikely. Previous studies demonstrate that repetitive contractures in the presence of a SERCA inhibitor were needed to stimulate Ca2+ entry into mouse skeletal myotubes or adult muscle fibres [21, 43]. These results suggest that significant SR Ca2+ depletion is difficult to achieve in adult and mature muscle fibre and raise concerns about the role of SOCE under physiological conditions [1]. Analysis of SR lumenal D1ER FRET combined with cytosolic fluorescence Mn2+ quenching evoked by muscle fibre electrical stimulation is required to answer this question.
Acknowledgments
The present study was supported by grants from the National Institutes of Health/National Institute on Ageing (AG07157, AG33385 and AG15820) and the Muscular Dystrophy Association (MDA33149) to Osvaldo Delbono, and the Wake Forest University Claude D. Pepper Older Americans Independence Centre (P30-AG21332).
Abbreviations
- ER/SR
Endoplasmic/sarcoplasmic reticulum
- FDB
Flexor digitorum brevis
- SOCE
Store-operated Ca2+ entry
- FRET
Förster resonance energy transfer
- FVB
Freund virus B
- CFP
Cyan fluorescent protein
- YFP
Yellow fluorescent protein
- RyR1
Ryanodine receptor isoform 1
- 4-CmC
4-Chloro-m-cresol
- TEA
Tetraethylammonium
- di-8-ANEPPS
Di-8-amino naphthyl ethenyl pyridinium
Footnotes
Present Address: R. Jiménez-Moreno, Department of Neurobiology and Anatomy, Wake Forest University School of Medicine, Winston-Salem, NC 27157, USA
Contributor Information
Ramón Jiménez-Moreno, Department of Internal Medicine, Section on Gerontology and Geriatric Medicine, Wake Forest University School of Medicine, Winston-Salem, NC 27157, USA.
Zhong-Ming Wang, Department of Internal Medicine, Section on Gerontology and Geriatric Medicine, Wake Forest University School of Medicine, Winston-Salem, NC 27157, USA.
María Laura Messi, Department of Internal Medicine, Section on Gerontology and Geriatric Medicine, Wake Forest University School of Medicine, Winston-Salem, NC 27157, USA.
Osvaldo Delbono, Department of Internal Medicine, Section on Gerontology and Geriatric Medicine, Wake Forest University School of Medicine, Winston-Salem, NC 27157, USA; Molecular Medicine and Neuroscience Programs, Wake Forest University School of Medicine, Winston-Salem, NC 27157, USA; Wake Forest University School of Medicine, Winston-Salem, NC 27157, USA.
References
- 1.Allard B, Couchoux H, Pouvreau S, Jacquemond V. Sarcoplasmic reticulum Ca2+ release and depletion fail to affect sarcolemmal ion channel activity in mouse skeletal muscle. J Physiol. 2006;575:69–81. doi: 10.1113/jphysiol.2006.112367. [DOI] [PMC free article] [PubMed] [Google Scholar]
- 2.Bers DM. Sarcoplasmic reticulum Ca release in intact ventricular myocytes. Front Biosci. 2002;7:d1697–d1711. doi: 10.2741/A873. [DOI] [PubMed] [Google Scholar]
- 3.Conti A, Gorza L, Sorrentino V. Differential distribution of ryanodine receptor type 3 (RyR3) gene product in mammalian skeletal muscles. Biochem J. 1996;316(Pt 1):19–23. doi: 10.1042/bj3160019. [DOI] [PMC free article] [PubMed] [Google Scholar]
- 4.Copello JA, Barg S, Onoue H, Fleischer S. Heterogeneity of Ca2+ gating of skeletal muscle and cardiac ryanodine receptors. Biophys J. 1997;73:141–156. doi: 10.1016/S0006-3495(97)78055-X. [DOI] [PMC free article] [PubMed] [Google Scholar]
- 5.Day RN, Periasamy A, Schaufele F. Fluorescence resonance energy transfer microscopy of localized protein interactions in the living cell nucleus. Methods. 2001;25:4–18. doi: 10.1006/meth.2001.1211. [DOI] [PubMed] [Google Scholar]
- 6.Delbono O, Stefani E. Calcium transients in single mammalian skeletal muscle fibres. J Physiol (Lond) 1993;463:689–707. doi: 10.1113/jphysiol.1993.sp019617. [DOI] [PMC free article] [PubMed] [Google Scholar]
- 7.Demaurex N, Frieden M. Measurements of the free luminal ER Ca(2+) concentration with targeted “cameleon” fluorescent proteins. Cell Calcium. 2003;34:109–119. doi: 10.1016/s0143-4160(03)00081-2. [DOI] [PubMed] [Google Scholar]
- 8.Difranco M, Neco P, Capote J, Meera P, Vergara JL. Quantitative evaluation of mammalian skeletal muscle as a heterologous protein expression system. Protein Expr Purif. 2006;47:281–288. doi: 10.1016/j.pep.2005.10.018. [DOI] [PubMed] [Google Scholar]
- 9.DiFranco M, Quinonez M, DiGregorio DA, Kim AM, Pacheco R, Vergara JL. Inverted double-gap isolation chamber for high-resolution calcium fluorimetry in skeletal muscle fibers. Pflugers Arch. 1999;438:412–418. doi: 10.1007/s004240050929. [DOI] [PubMed] [Google Scholar]
- 10.Dulhunty AF. Feet, bridges, and pillars in triad junctions of mammalian skeletal muscle: their possible relationship to calcium buffers in terminal cisternae and T-tubules and to excitation–contraction coupling. J Membr Biol. 1989;109:73–83. doi: 10.1007/BF01870792. [DOI] [PubMed] [Google Scholar]
- 11.Franzini-Armstrong C, Protasi F, Ramesh V. Comparative ultrastructure of Ca2+ release units in skeletal and cardiac muscle. Ann N Y Acad Sci. 1998;853:20–30. doi: 10.1111/j.1749-6632.1998.tb08253.x. [DOI] [PubMed] [Google Scholar]
- 12.Garcia J, Schneider MF. Calcium transients and calcium release in rat fast-twitch skeletal muscle fibres. J Physiol (Lond) 1993;463:709–728. doi: 10.1113/jphysiol.1993.sp019618. [DOI] [PMC free article] [PubMed] [Google Scholar]
- 13.Gomez J, Neco P, DiFranco M, Vergara JL. Calcium release domains in mammalian skeletal muscle studied with two-photon imaging and spot detection techniques. J Gen Physiol. 2006;127:623–637. doi: 10.1085/jgp.200509475. [DOI] [PMC free article] [PubMed] [Google Scholar]
- 14.Grynkiewicz G, Poenie M, Tsien RW. A new generation of Ca2+ indicators with greatly improved fluorescence properties. Role of specific intracellular signaling pathways. J Clin Invest. 1985;96:1473–1483. [PubMed] [Google Scholar]
- 15.Gyorke S, Terentyev D. Modulation of ryanodine receptor by luminal calcium and accessory proteins in health and cardiac disease. Cardiovasc Res. 2008;77:245–255. doi: 10.1093/cvr/cvm038. [DOI] [PubMed] [Google Scholar]
- 16.Hamill OP, Marty A, Neher E, Sakmann B, Sigworth FJ. Improved patch-clamp techniques for high-resolution current recording from cells and cell-free patches. Pflugers Arch. 1981;391:85–100. doi: 10.1007/BF00656997. [DOI] [PubMed] [Google Scholar]
- 17.Jimenez-Moreno R, Guerring R, Wang ZM, Delbono O. Maximum sarcoplasmic reticulum releasable calcium in aging skeletal muscle; 50th Annual Meeting of the Biophysical Society; 2006. [Google Scholar]
- 18.Jimenez-Moreno R, Wang ZM, Gerring R, Delbono O. Sarcoplasmic reticulum Ca2+ release declines in muscle fibers from aging mice. Biophys J. 2008;94:3178–3188. doi: 10.1529/biophysj.107.118786. [DOI] [PMC free article] [PubMed] [Google Scholar]
- 19.Jones PP, Jiang D, Bolstad J, Hunt DJ, Zhang L, Demaurex N, Chen SR. Endoplasmic reticulum Ca2+ measurements reveal that the cardiac ryanodine receptor mutations linked to cardiac arrhythmia and sudden death alter the threshold for store-overload-induced Ca2+ release. Biochem J. 2008;412:171–178. doi: 10.1042/BJ20071287. [DOI] [PubMed] [Google Scholar]
- 20.Kabbara AA, Allen DG. Measurement of sarcoplasmic reticulum Ca2+ content in intact amphibian skeletal muscle fibres with 4-chloro-m-cresol. Cell Calcium. 1999;25:227–235. doi: 10.1054/ceca.1999.0023. [DOI] [PubMed] [Google Scholar]
- 21.Kurebayashi N, Ogawa Y. Depletion of Ca2+ in the sarcoplasmic reticulum stimulates Ca2+ entry into mouse skeletal muscle fibres. J Physiol. 2001;533:185–199. doi: 10.1111/j.1469-7793.2001.0185b.x. [DOI] [PMC free article] [PubMed] [Google Scholar]
- 22.Lannergren J, Bruton JD, Westerblad H. Vacuole formation in fatigued single muscle fibres from frog and mouse. J Muscle Res Cell Motil. 1999;20:19–32. doi: 10.1023/a:1005412216794. [DOI] [PubMed] [Google Scholar]
- 23.Launikonis BS, Rios E. Store-operated Ca2+ entry during intracellular Ca2+ release in mammalian skeletal muscle. J Physiol. 2007;583:81–97. doi: 10.1113/jphysiol.2007.135046. [DOI] [PMC free article] [PubMed] [Google Scholar]
- 24.Launikonis BS, Zhou J, Royer L, Shannon TR, Brum G, Rios E. Confocal imaging of [Ca2+] in cellular organelles by SEER, shifted excitation and emission ratioing of fluorescence. J Physiol. 2005;567:523–543. doi: 10.1113/jphysiol.2005.087973. [DOI] [PMC free article] [PubMed] [Google Scholar]
- 25.Lewis RS. The molecular choreography of a store-operated calcium channel. Nature. 2007;446:284–287. doi: 10.1038/nature05637. [DOI] [PubMed] [Google Scholar]
- 26.Narayanan N, Jones DL, Xu A, Yu JC. Effects of aging on sarcoplasmic reticulum function and contraction duration in skeletal muscles of the rat. Am J Physiol. 1996;271:C1032–1040. doi: 10.1152/ajpcell.1996.271.4.C1032. [DOI] [PubMed] [Google Scholar]
- 27.Palmer AE, Giacomello M, Kortemme T, Hires SA, Lev-Ram V, Baker D, Tsien RY. Ca2+ indicators based on computationally redesigned calmodulin-peptide pairs. Chem Biol. 2006;13:521–530. doi: 10.1016/j.chembiol.2006.03.007. [DOI] [PubMed] [Google Scholar]
- 28.Palmer AE, Jin C, Reed JC, Tsien RY. Bcl-2-mediated alterations in endoplasmic reticulum Ca2+ analyzed with an improved genetically encoded fluorescent sensor. Proc Natl Acad Sci U S A. 2004;101:17404–17409. doi: 10.1073/pnas.0408030101. [DOI] [PMC free article] [PubMed] [Google Scholar]
- 29.Pan Z, Yang D, Nagaraj RY, Nosek TA, Nishi M, Takeshima H, Cheng H, Ma J. Dysfunction of store-operated calcium channel in muscle cells lacking mg29. Nat Cell Biol. 2002;4:379–383. doi: 10.1038/ncb788. [DOI] [PubMed] [Google Scholar]
- 30.Pape PC, Jong DS, Chandler WK. Calcium release and its voltage dependence in frog cut muscle fibers equilibrated with 20 mM EGTA. J Gen Physiol. 1995;106:259–336. doi: 10.1085/jgp.106.2.259. [DOI] [PMC free article] [PubMed] [Google Scholar]
- 31.Park KS, Poburko D, Wollheim CB, Demaurex N. Amiloride derivatives induce apoptosis by depleting ER Ca(2+) stores in vascular endothelial cells. Br J Pharmacol. 2009;156:1296–1304. doi: 10.1111/j.1476-5381.2009.00133.x. [DOI] [PMC free article] [PubMed] [Google Scholar]
- 32.Payne AM, Jimenez-Moreno R, Wang ZM, Messi ML, Delbono O. Role of Ca2+, membrane excitability, and Ca2+ stores in failing muscle contraction with aging. Exp Gerontol. 2009;44:261–273. doi: 10.1016/j.exger.2008.09.013. [DOI] [PMC free article] [PubMed] [Google Scholar]
- 33.Payne AM, Zheng Z, Gonzalez E, Wang ZM, Messi ML, Delbono O. External Ca2+-dependent excitation–contraction coupling in a population of ageing mouse skeletal muscle fibres. J Physiol (Lond) 2004;560(1):137–157. doi: 10.1113/jphysiol.2004.067322. [DOI] [PMC free article] [PubMed] [Google Scholar]
- 34.Picht E, DeSantiago J, Blatter LA, Bers DM. Cardiac alternans do not rely on diastolic sarcoplasmic reticulum calcium content fluctuations. Circ Res. 2006;99:740–748. doi: 10.1161/01.RES.0000244002.88813.91. [DOI] [PubMed] [Google Scholar]
- 35.Piston DW, Kremers GJ. Fluorescent protein FRET: the good, the bad and the ugly. Trends Biochem Sci. 2007;32:407–414. doi: 10.1016/j.tibs.2007.08.003. [DOI] [PubMed] [Google Scholar]
- 36.Rios E, Launikonis BS, Royer L, Brum G, Zhou J. The elusive role of store depletion in the control of intracellular calcium release. J Muscle Res Cell Motil. 2006;27:337–350. doi: 10.1007/s10974-006-9082-5. [DOI] [PubMed] [Google Scholar]
- 37.Rossi D, Sorrentino V. Molecular genetics of ryanodine receptors Ca2+-release channels. Cell Calcium. 2002;32:307–319. doi: 10.1016/s0143416002001987. [DOI] [PubMed] [Google Scholar]
- 38.Rudolf R, Magalhaes PJ, Pozzan T. Direct in vivo monitoring of sarcoplasmic reticulum Ca2+ and cytosolic cAMP dynamics in mouse skeletal muscle. J Cell Biol. 2006;173:187–193. doi: 10.1083/jcb.200601160. [DOI] [PMC free article] [PubMed] [Google Scholar]
- 39.Shannon TR, Guo T, Bers DM. Ca2+ scraps: local depletions of free [Ca2+] in cardiac sarcoplasmic reticulum during contractions leave substantial Ca2+ reserve. Circ Res. 2003;93:40–45. doi: 10.1161/01.RES.0000079967.11815.19. [DOI] [PubMed] [Google Scholar]
- 40.Somlyo AV, Gonzalez-Serratos HG, Shuman H, McClellan G, Somlyo AP. Calcium release and ionic changes in the sarcoplasmic reticulum of tetanized muscle: an electron-probe study. J Cell Biol. 1981;90:577–594. doi: 10.1083/jcb.90.3.577. [DOI] [PMC free article] [PubMed] [Google Scholar]
- 41.Stern MD, Cheng H. Putting out the fire: what terminates calcium-induced calcium release in cardiac muscle? Cell Calcium. 2004;35:591. doi: 10.1016/j.ceca.2004.01.013. [DOI] [PubMed] [Google Scholar]
- 42.Stern MD, Song LS, Cheng H, Sham JS, Yang HT, Boheler KR, Rios E. Local control models of cardiac excitation-contraction coupling. A possible role for allosteric interactions between ryanodine receptors. J Gen Physiol. 1999;113:469–489. doi: 10.1085/jgp.113.3.469. [DOI] [PMC free article] [PubMed] [Google Scholar]
- 43.Stiber J, Hawkins A, Zhang ZS, Wang S, Burch J, Graham V, Ward CC, Seth M, Finch E, Malouf N, Williams RS, Eu JP, Rosenberg P. STIM1 signalling controls store-operated calcium entry required for development and contractile function in skeletal muscle. Nat Cell Biol. 2008;10:688–697. doi: 10.1038/ncb1731. [DOI] [PMC free article] [PubMed] [Google Scholar]
- 44.Volpe P, Simon BJ. The bulk of Ca2+ released to the myoplasm is free in the sarcoplasmic reticulum and does not unbind from calsequestrin. FEBS Lett. 1991;278:274–278. doi: 10.1016/0014-5793(91)80134-o. [DOI] [PubMed] [Google Scholar]
- 45.Wang ZM, Messi ML, Delbono O. Patch-clamp recording of charge movement, Ca2+ current and Ca2+ transients in adult skeletal muscle fibers. Biophys J. 1999;77:2709–2716. doi: 10.1016/s0006-3495(99)77104-3. [DOI] [PMC free article] [PubMed] [Google Scholar]
- 46.Wang Z-M, Messi ML, Delbono O. Sustained over-expression of IGF-1 prevents age-dependent decrease in charge movement and intracellular calcium in mouse skeletal muscle. Biophys J. 2002;82:1338–1344. doi: 10.1016/S0006-3495(02)75489-1. [DOI] [PMC free article] [PubMed] [Google Scholar]
- 47.Woods CE, Novo D, DiFranco M, Capote J, Vergara JL. Propagation in the transverse tubular system and voltage dependence of calcium release in normal and mdx mouse muscle fibres. J Physiol. 2005;568:867–880. doi: 10.1113/jphysiol.2005.089318. [DOI] [PMC free article] [PubMed] [Google Scholar]
- 48.Woods CE, Novo D, DiFranco M, Vergara JL. The action potential-evoked sarcoplasmic reticulum calcium release is impaired in mdx mouse muscle fibres. J Physiol. 2004;557:59–75. doi: 10.1113/jphysiol.2004.061291. [DOI] [PMC free article] [PubMed] [Google Scholar]
- 49.Xi Q, Adebiyi A, Zhao G, Chapman KE, Waters CM, Hassid A, Jaggar JH. IP3 constricts cerebral arteries via IP3 receptor-mediated TRPC3 channel activation and independently of sarcoplasmic reticulum Ca2+ release. Circ Res. 2008;102:1118–1126. doi: 10.1161/CIRCRESAHA.108.173948. [DOI] [PMC free article] [PubMed] [Google Scholar]
- 50.Zima AV, Picht E, Bers DM, Blatter LA. Termination of cardiac Ca2+ sparks: role of intra-SR [Ca2+], release flux, and intra-SR Ca2+ diffusion. Circ Res. 2008;103:e105–e115. doi: 10.1161/CIRCRESAHA.107.183236. [DOI] [PMC free article] [PubMed] [Google Scholar]