

Abstract
The folding pathway of the Sc.ai5γ derived group II intron ribozyme D135 is highly specific to the correct M2+ cofactor. Upon partial replacement of Mg2+ with Ca2+, the molecules split into two distinct static subpopulations that are not interchangeable. Type 2 molecules thereby form a compact but misfolded state.
Keywords: Multidomain RNA folding, single molecule Förster Resonance Energy Transfer, ribozyme, splicing, metal ions
The phosphate sugar backbone imposes a large negative charge on RNA and DNA that needs to be neutralized for three dimensional-structure assembly. In addition to proteins and polyamines, the most important cofactors that bind nucleic acids are metal ions. They help to overcome repulsion forces and mediate higher order structure formation, and they frequently participate directly in the chemical reaction of catalytic nucleic acids, i.e. ribozymes.[1] Catalytic RNAs show a distinct specificity for metal ions, both with respect to the kind as well as their concentration.[2–6] Mg2+ is the most abundant divalent metal ion in the cell and is often considered the natural cofactor for ribozymes.
Self-splicing group II introns rank amongst the largest ribozymes known and are found in organellar genes of lower eukaryotes, fungi, plants and bacteria.[7] They represent large molecular machines able to perform autocatalysis.[7] In vitro, the D135 ribozyme derived from the S. cerevisiae group II intron Sc.ai5γ displays an optimal activity at unphysiologically high metal ion concentrations (500 mM KCl, 50–100 mM MgCl2).[8] This ribozyme consists of domains 1, 3, and 5, contains all the elements necessary for activity and represents the best investigated system for group II intron folding.[9,10] D135 folds in a Mg2+ dependent fashion.[10] Starting from the unfolded state U in the presence of monovalent metal ions only, two transient on-pathway intermediates I (extended intermediate) and F (folded intermediate) are observed before reaching the native state N by the addition of Mg2+. I and F are in fast dynamic equilibrium separated by low energy barriers.[10] Interestingly, increasing [Mg2+] activate the structural dynamics, directly linking dynamics to ribozyme activity.[10]
The hammerhead ribozyme retains activity with Ca2+ only,[3,11] and the Tetrahymena group I intron was shown to globally fold with Ca2+ only, but requires small [Mg2+] for catalysis.[12] Group II introns instead are inhibited already by very low [Ca2+];[4] Ca2+ thereby actively replaces Mg2+ ions in the folded state.[4] Calcium inhibition is particularly interesting because the cox1 gene coding for Sc.ai5γ is located in mitochondria and these cellular compartments are not only involved in Ca2+ homeostasis, serving as Ca2+ storage pools, but both the cox1 gene and altering Ca2+ levels are also involved in apoptosis.[13–15] Therefore, the ribozyme splicing activity and thus correct cox1 expression is potentially regulated by local [Ca2+] in mitochondria.
Until now it was impossible to distinguish whether the role of Ca2+ is reflected in the disturbance of the overall ribozyme structure or the replacement of one or more Mg2+ ions directly involved in catalysis. Both of these effects would result in a similar, undistinguishable inhibition in a standard cleavage assay. To address this, we have characterized the folding of the group II intron D135 ribozyme in the presence of Ca2+ independently of catalysis using single-molecule Förster Resonance Energy Transfer (smFRET).
Calcium(II) ions affect the overall distribution of conformational states in the D135-L14 ribozyme
The fluorophore labeled D135-L14 ribozyme has been previously characterized[10] and shown to be catalytically competent in cleaving substrate RNA (Supporting Figure S1). We have now carried out smFRET experiments in the presence of 0, 2, 5, 7, or 10 mM Ca2+ in a background of Mg2+ to give a total [M2+] of 100 mM. Cumulative FRET distribution histograms from single-molecule time trajectories are shown in Figure 1a (30–50 molecules each). In the presence of Mg2+ only, the two intermediate folding states (I and F, FRET ≈ 0.25 and 0.4) are equally populated, while the native state (N, FRET ≈ 0.6) is clearly a minor population (Figure 1a, top).[10] Upon addition of Ca2+ a distinct population transfer takes place: The magnitude of the 0.4 FRET state decreases as the 0.6 FRET state increases dramatically (Figure 1a). Interestingly, the peak value of the highest FRET distribution also shifts from ~0.60 to ~0.54 as [Ca2+] increases to 10 mM.
Figure 1.

Distribution histograms of smFRET time traces in the presence of Ca2+. a) Upon addition of up to 10 mM Ca2+ (in a total divalent metal ion concentration of 100 mM completed with the addition of Mg2+), the contribution of the high FRET state at ~0.6 dramatically increases. Concomitantly, the mean maximal FRET value shifts from 0.6 to 0.54 and the peak height of the 0.4 FRET state decreases. b) Histograms of single molecule trajectories separated into subpopulations type 1 (left) and type 2 (right) at the indicated Mg2+: Ca2+ mixtures. The two subpopulations are distinctly different.
The presence of Ca2+ leads to the appearance of two distinct subpopulations and a new misfolded species
To characterize the increase of the 0.6 FRET state in the presence of Ca2+, we analyzed the single time trajectories individually (Figure 2). In the presence of Mg2+ only, three reoccurring conformational states of D135-L14 are observed at FRET values ~0.25, 0.4 and 0.6, corresponding to I, F and N. These three states are in fast equilibrium and the 0.6 state is only transiently occupied (Figure 2, top). In the presence of Ca2+ two distinctively different trace types appear. Type 1 traces are similar to those observed with Mg2+ only (Figure 2, middle). In contrast, type 2 traces show a completely new behavior: The molecules predominantly populate the high FRET state, and exhibit direct transitions from 0.25 to 0.6 FRET and fewer transitions to 0.4 FRET (Figure 2, bottom). The 0.4 state apparently describes a conformation along a minor folding pathway, although it is not clear whether the transitions from 0.6 to 0.25 are direct or if they include a very short intermission in the 0.4 FRET, which we miss because of our 33 ms time resolution. The intermediate 0.4 FRET state is reached from both the 0.25 and 0.6 states. Yet FRET 0.4 is not an on-pathway state as the molecules fall back to their original state rather than continuing to the respective third state. Interchanges from single molecules from type 1 to type 2 were also not observed within the ~1 min observation window. This reflects a certain memory effect of the single molecules similar to earlier observations.[16]
Figure 2.

Exemplary single molecule traces at 100 mM Mg2+ (top) and of the two subpopulations at 90 mM Mg2+: 10 mM Ca2+ (middle and bottom). The FRET histograms (right) reveal two distinct types of traces in the presence of Ca2+.
Cumulative histograms of the single molecule traces split into type 1 and type 2 traces strongly support the existence of two distinct subpopulations (Figure 1b). Type 1 histograms show large peak distributions at 0.25 and 0.4 FRET and a consistently minor distribution at ~0.6 FRET, which only increases slightly with [Ca2+]. In contrast, type 2 traces primarily populate the low and high FRET states, but hardly the intermediate state. Careful inspection of the type 2 histograms also reveals a shift in the maximum of the high FRET distribution from 0.58 to 0.53, whereas the peaks at the two lower FRET states remain unchanged (Figure 1b). This can be explained by concluding that type 2 molecules no longer reach the native state N. Instead, they form a new conformational (misfolded) species M with a FRET state that is clearly distinguishable from the native state N at 0.6 FRET.
We further determined the relative amount of type 2 traces as a function of [Ca2+] (Figure 3). The fraction of type 2 molecules increases linearly up to 50% in 10 mM [Ca2+], which correlates nicely with the loss of function in the presence of Ca2+ ions.[4] This further supports the existence of two subpopulations and explains the observed progression in the overall FRET histograms that include both type 1 and type 2 traces (Figure 1a).
Figure 3.

Fraction of type 2 molecules as a function of [Ca2+]. A linear relationship is revealed (slope = 4.5 ± 0.4 mM−1).
Folding rates in the presence of Ca2+ support the accumulation of the molecules in the high FRET state
Folding rates for type 1 molecules were determined in a range of Mg2+/Ca2+ ratios (25–50 molecules each) using dwell time analysis as described.[10] Both forward (k11 and k12) and both backward rates (k−11 and k−12) either increase linearly with increasing [Ca2+] or stay the same within the error limits (Figure 4a,b). The ratios of forward and backward rates agree with the observation that the high FRET state remains a minor species but its contribution increases in the presence of Ca2+ (Figure 1b).
Figure 4.

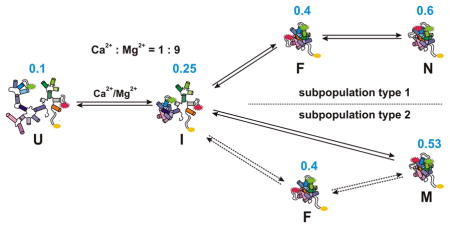
Folding pathway of D135-L14 in the presence of Mg2+ and Ca2+. a) In the presence of Mg2+ the ribozyme shows a linear folding pathway from the unfolded state U via the on-pathway intermediates I (unfolded intermediate) and F (folded intermediate) to the native state N.[10] b) In the presence of Ca2+ two different types of subpopulations appear. Type 1 traces depict a pathway similar to the Mg2+ case with slightly altered rates. Molecules of type 2 predominantly fold directly from I to a misfolded species M. Some type 2 molecules follow a minor pathway passing F on the way from I to M. The maxima of the FRET distributions are given in blue. All rates are in s−1 and correspond to 10 mM Ca2+/90 mM Mg2+. The individual error limits are estimated[17] to be about 50% of the given values. The first step of folding, i.e. the addition of monovalent ions to the RNA, is not shown. Note that we cannot distinguish if I is the dividing point or if it already differs for the two subpopulations (see also text).
For type 2 molecules, we assigned new folding rates describing the transition between 0.25 and 0.4 FRET as well as from the 0.25 or 0.4 states to the highest FRET state at 0.53 (k21/k−21, k22/k−22, and k23/k−23, respectively, Figure 4). Roughly one third of the type 2 molecules show transitions to and from 0.4 FRET, whereas all other traces show a direct I-M transition. Due to the rare occurrence of the transitions involving the F state (especially at low [Ca2+]), the rates k21, k−21, k22 and k−22 were estimated as the inverse of the respective averaged dwell times. k21 and k−21 could be calculated at 10 mM Ca2+: 90 mM Mg2+ only but need to be interpreted with great care due to their large error. k22 and k−22 are independent of the [Ca2+]. Instead, k23 increases with higher [Ca2+] and is the fastest rate under all conditions. The opposite transition (k−23) becomes slower at high [Ca2+]. Overall, the rapid accumulation of the molecules in the 0.53 FRET state is well explained by these rates.
Conclusion
This study is the first investigation at the single molecule level on the effect of an M2+ other than Mg2+ on RNA folding. The group II intron derived D135-L14 ribozyme is the largest protein-free RNA investigated by smFRET and represents a perfect model system for the investigation of folding of large RNAs. Its splicing activity is very sensitive to trace amounts of Ca2+.[4] Although an (additional) inhibition of the catalytic step itself by Ca2+ cannot be ruled out, our results reveal an unprecedented behavior of RNA folding upon Ca2+ binding.
The addition of Ca2+ to the D135-L14 ribozymes induces the division of all single molecules into two distinct subpopulations:
Type 1 molecules fold very similarly to those in the Mg2+-only pathway, the individual folding rates increasing only moderately (if at all) by adding Ca2+. We ascribe this type to a structure where Mg2+ still occupies the key sites of the threedimensional architecture. Ca2+ might bind to some places in the RNA, but presumably only diffusely for charge compensation, thus having hardly any effect on the global structure. The faster ligand exchange rate and larger ionic radius of Ca2+ compared to Mg2+ might be reflected in the slight increase in folding rates, the higher dynamics of domain assembly, and the slightly less compact high FRET state.
In type 2 molecules, 0.4 FRET is highly destabilized and almost inexistent. It is an open question whether the molecules fold directly from the 0.25 state to the most compact and misfolded ~0.53 state, or if the 0.4 state is transiently reached but unobservable due to an occupancy shorter than the experimental time window of 0.33 ms. The high FRET state F is slightly less compact than the native one, and hence, within this second subpopulation, Ca2+ obviously occupies one or more key sites in the folded structure.
The differences in folding dynamics of the D135-L14 ribozyme with increasing [Ca2+] concur and can thus be explained with the different coordinating properties of Mg2+ and Ca2+: Ca2+ is larger, has faster ligand exchange dynamics, and can enlarge its coordination number to 8, instead of only 6 with Mg2+. In addition, Ca2+ has an intrinsic lower affinity towards nucleic acids than Mg2+. As Mg2+ is in excess under all conditions, at least at one site Ca2+ must bind more tightly than Mg2+.
One can speculate on the distinct role of Ca2+ for the individual steps of folding: The 0.25 FRET state I, which is attributed to a folded domain 1,[10] does not seem to be influenced by Ca2+ in its global fold. The split into two coexisting but distinct subpopulations upon Ca2+ addition becomes noticeable only after the subsequent docking of domains 3 and 5. It was previously shown[10] that high [Mg2+] increase the dynamics of group II introns, i.e. the 0.25 state is occupied on a regular basis. Presumably, one (or possibly several) Ca2+ ion bind to a specific junction within the I state, which controls the structural dynamics leading to an inevitable branching-off of the pathway towards the misfolded structure M. Maybe binding of the first Ca2+ leads to cooperative binding of subsequent ions, which would explain the coexistence of type 1 and type 2 molecules. Such a cooperative binding is corroborated by the linear increase in molecules of type 2 with increasing [Ca2+]. Yet we do not observe traces that interchange from type 1 to type 2 behavior during our experimental time window. Although I shows the same FRET value for the two types of traces in our experiments, we cannot rule out that it differs already in the two subpopulations.
Our findings are well in line with previous observations that Ca2+ inhibition takes place in prefolded D135 molecules.[4] In earlier biochemical studies, the catalytic rate kcat is reduced to 50% at 5 mM Ca2+ and splicing completely inhibited at 20 mM Ca2+. A quantitative comparison between splicing inhibition and the occurrence of two subpopulations with increasing [Ca2+] is not possible, because in the previous experiments D5 was added in trans, i.e. D5 is not covalently linked to the rest of the ribozyme. Such a two-piece setup obviously strongly impedes the last step of folding to the active structure.
Proving a functional role for folding heterogeneity has so-far not been achieved. A recent bulk FRET study on the extended Schistosoma hammerhead ribozyme concluded that divalent metal ions other than Mg2+ have almost no effect on the global RNA fold, but strongly regulate catalysis.[6] However, the small differences in maximum FRET intensities found in our study would not be detected in bulk experiments aimed to study folding heterogeneity. This illustrates that only single molecule spectroscopy is able to reveal the subtle effect of M2+ binding during RNA folding.
Group II intron folding is of general interest because (i) no kinetic traps exist on the native folding pathway, (ii) the active state N is reached only transiently from a collapsed near-native state F, (iii) N is stabilized by substrate binding, and (iv) Mg2+ not only induces folding but also increases the inherent dynamics of the folded RNA.[10] Our presented results add two further aspects to this list: (v) It could be shown for the first time that the binding of specific metal ions has an effect on the global architecture of a large RNA. One can thereby distinguish between Mg2+ and Ca2+ bound RNA molecules on a single molecule level. (vi) By linking the biochemical data[4] with the here observed separation into two subpopulations, a functional role for folding heterogeneity could be demonstrated for the first time.
Experimental Section
RNA preparation and single molecule experiments
The D135-L14 RNA, derived from the S. cerevisiae intron Sc.ai5γ, was obtained by in vitro transcription under standard conditions with homemade T7 polymerase from HindIII digested plasmid pT7D135-L14 and the T-Biotin, Cy3- and Cy5 DNAs purified as described.[18–20] Single molecule experiments were performed as described.[10,21] Samples were incubated in mixtures containing 100 mM Mg2+, 98 mM Mg2+: 2 mM Ca2+, 95 mM Mg2+: 5 mM Ca2+, 93 mM Mg2+: 7 mM Ca2+ or 90 mM Mg2+: 10 mM Ca2+ to test and compare the influence of increasing amounts of Ca2+ under conditions of equal ionic strength. For details see Supplementary Information.
Supplementary Material
Footnotes
This work was supported by the Swiss National Science Foundation and the University of Zurich (R.K.O.S.), as well as the NIH and the NSF (R01 GM085996 and MCB-0747285 to D.R.).
Contributor Information
Prof. Dr. David Rueda, Email: rueda@chem.wayne.edu.
Prof. Dr. Roland K. O. Sigel, Email: roland.sigel@aci.uzh.ch.
References
- 1.Sigel RKO, Pyle AM. Chem Rev. 2007;107:97–113. doi: 10.1021/cr0502605. [DOI] [PubMed] [Google Scholar]
- 2.Sigel RKO. Eur J Inorg Chem. 2005;12:2281–2292. [Google Scholar]
- 3.Roychowdhury-Saha M, Burke DH. RNA. 2006;12:1846–1852. doi: 10.1261/rna.128906. [DOI] [PMC free article] [PubMed] [Google Scholar]
- 4.Erat MC, Sigel RKO. J Biol Inorg Chem. 2008;13:1025–1036. doi: 10.1007/s00775-008-0390-7. [DOI] [PubMed] [Google Scholar]
- 5.Freisinger E, Sigel RKO. Coord Chem Rev. 2007;251:1834–1851. [Google Scholar]
- 6.Boots JL, Canny MD, Azimi E, Pardi A. RNA. 2008;14:2212–2222. doi: 10.1261/rna.1010808. [DOI] [PMC free article] [PubMed] [Google Scholar]
- 7.Michel F, Ferat JL. Annu Rev Biochem. 1995;64:435–461. doi: 10.1146/annurev.bi.64.070195.002251. [DOI] [PubMed] [Google Scholar]
- 8.Su LHJ, Brenowitz M, Pyle AM. J Mol Biol. 2003;334:639–652. doi: 10.1016/j.jmb.2003.09.071. [DOI] [PubMed] [Google Scholar]
- 9.Fedorova O, Zingler N. Biol Chem. 2007;388:665–678. doi: 10.1515/BC.2007.090. [DOI] [PubMed] [Google Scholar]
- 10.Steiner M, Karunatilaka KS, Sigel RKO, Rueda D. Proc Natl Acad Sci USA. 2008;105:13853–13858. doi: 10.1073/pnas.0804034105. [DOI] [PMC free article] [PubMed] [Google Scholar]
- 11.Chowrira BM, Berzal-Herranz A, Burke JM. Biochemistry. 1993;32:1088–1095. doi: 10.1021/bi00055a014. [DOI] [PubMed] [Google Scholar]
- 12.Celander DW, Cech TR. Science. 1991;251:401–407. doi: 10.1126/science.1989074. [DOI] [PubMed] [Google Scholar]
- 13.Babcock DF, Hille B. Curr Op Neurobiol. 1998;8:398–404. doi: 10.1016/s0959-4388(98)80067-6. [DOI] [PubMed] [Google Scholar]
- 14.Carafoli E. FEBS Lett. 1979;104:1–5. doi: 10.1016/0014-5793(79)81073-x. [DOI] [PubMed] [Google Scholar]
- 15.Zamzami N, Hirsch T, Dallaporta B, Petit PX, Kroemer G. J Bioenerg Biomembr. 1997;29:185–193. doi: 10.1023/a:1022694131572. [DOI] [PubMed] [Google Scholar]
- 16.Zhuang XW, Kim H, Pereira MJB, Babcock HP, Walter NG, Chu S. Science. 2002;296:1473–1476. doi: 10.1126/science.1069013. [DOI] [PubMed] [Google Scholar]
- 17.Blanchard SC, Gonzalez RL, Kim HD, Chu S, Puglisi JD. Nature Struct Mol Biol. 2004;11:1008–1014. doi: 10.1038/nsmb831. [DOI] [PubMed] [Google Scholar]
- 18.Gallo S, Furler M, Sigel RKO. CHIMIA. 2005;59:812–816. [Google Scholar]
- 19.Walter NG. Methods. 2001;25:19–30. doi: 10.1006/meth.2001.1212. [DOI] [PubMed] [Google Scholar]
- 20.Rueda D, Walter NG. Methods Mol Biol. 2006;335:289–310. doi: 10.1385/1-59745-069-3:289. [DOI] [PubMed] [Google Scholar]
- 21.Zhao R, Rueda D. Methods. 2009 doi: 10.1016/j.ymeth.2009.1004.1017. online available. [DOI] [PubMed] [Google Scholar]
Associated Data
This section collects any data citations, data availability statements, or supplementary materials included in this article.