

Abstract
Characterization of leukocytes is an integral part of blood analysis and blood-based diagnostics. In the present paper we combine lensless holographic imaging with antibody microarrays for rapid and multiparametric analysis of leukocytes from human blood. Monoclonal antibodies (Abs) specific for leukocyte surface antigens (CD4 and CD8) and cytokines (TNF-α, IFN-γ, IL-2) were printed in an array so as to juxtapose cell capture and cytokine detection Ab spots. Integration of Ab microarrays into a microfluidic flow chamber (4 μl volume) followed by incubation with human blood resulted in capture of CD4 and CD8 T-cells on specific Ab spots. On-chip mitogenic activation of these cells induced release of cytokine molecules that were subsequently captured on neighboring anti-cytokine Ab spots. The binding of IL-2, TNF-α and IFN-γ molecules on their respective Ab spots was detected using HRP-labeled anti-cytokine Abs and a visible color reagent. Lensfree holographic imaging was then used to rapidly (∼4 sec) enumerate CD4 and CD8 T-lymphocytes captured on Ab spots and to quantify the cytokine signal emanating from IL-2, TNF-α, and IFN-γ spots on the same chip. To demonstrate the utility of our approach for infectious disease monitoring, blood samples of healthy volunteers and human immunodeficiency virus (HIV)-infected patients were analyzed to determine CD4/CD8 ratio – an important HIV/AIDS diagnostic marker. The ratio obtained by lensfree on-chip imaging of CD4 and CD8 T-cells captured on Ab spots was in close agreement with conventional microscopy-based cell counting. The present paper, describing tandem use of Ab microarrays and lensfree holographic imaging, paves the way for future development of miniature cytometry devices for multiparametric blood analysis at the point of care or in a resource-limited setting.
Introduction
White blood cells or leukocytes are a heterogeneous mixture of cell types categorized based on size, shape of the nucleus, expression of surface markers and secretion of cytokines. The numbers of leukocytes and proportions of leukocyte subsets change drastically in the presence of infections, malignancies and autoimmune disorders, making analysis of leukocyte subpopulations quite valuable in the diagnosis and monitoring of disease.1 For example, the number of CD4 T cells and CD4/CD8 ratio are the key parameters used in monitoring human immunodeficiency virus (HIV) and AIDS.2-4 In addition, release of signaling molecules called cytokines is central to T-cell's role in orchestrating a well coordinated immune response involving other leukocyte subsets. Therefore, T-cell cytokine profiling is an important indicator of immune system competency in fighting infections such as HIV.5-7
Traditionally, leukocytes are phenotyped based on surface antigen expression and cytokine production using flow cytometry.8, 9 While enabling multiparametric, high-throughput characterization of leukocytes, flow cytometry is relatively expensive and complicated making this technology suboptimal for blood analysis performed at the point of care or in a resource-poor setting. As a result, considerable effort has been directed towards the development of miniature devices for simple and inexpensive leukocyte analysis.10-14 The number of CD4 T-cells in blood is the key diagnostic marker of HIV progression to AIDS and is routinely monitored in conjunction with antiretroviral therapy. Therefore, significant emphasis has been placed on development of miniature devices for CD4 T-cell counting.11, 13, 14 To provide a solution to this need, microfluidic devices modified with anti-CD4 Abs have been used to capture CD4 T-cells and have been shown to accurately predict T-cell numbers when compared with flow cytometry.11 Rapid enumeration of cells captured inside the microfluidic device has been another important area of research where cell detection schemes based on electrical properties of cells or cell lysate have been described.15, 16 However, these approaches do not directly visualize the cells and may be susceptible to sample-to-sample variation.
To provide an alternative, simpler and higher throughput solution for this task of counting cells, the use of lensfree on-chip imaging technologies has been recently proposed.17-25
In these on-chip imaging technologies, the cells of interest (e.g, within a microfluidic device) are directly positioned onto an opto-electronic sensor array (such as a CCD or CMOS chip) and the diffraction pattern (i.e., the shadow) of each cell is detected without the use of any lenses or mechanical scanning over a field of view that is significantly larger than that of a regular microscope.17, 21, 23, 24 A major advancement in these lensless on-chip imaging technologies came with tuning the spatial coherence of the illumination source to convert simple cell shadows into lensless holograms 21, 23, 25 at the sensor surface, which then significantly increased the signal to noise ratio as well as the digital information content of the cell signatures. In this holographic imaging technique, which is referred to as Holographic-LUCAS 21 (Lensfree Ultra-wide-field Cell monitoring Array platform based on Shadow imaging), the lensfree hologram of each cell is created by the interference of the unscattered light that is directly emanating from the source (which can be as simple as a light emitting diode) with the light waves that interacted with each cell through scattering, absorption and refraction processes. In this paper, we sought to employ Holographic-LUCAS platform for high-throughput quantitative imaging of cell capture and cytokine binding on antibody microarrays.
Given the complexity of the immune response it is clearly beneficial to be able to determine multiple immune markers from the same blood sample. To this end, the goal of the present work was to demonstrate that the simplicity and the cost-effectiveness of the device need not compromise information content of blood analysis. One way to enable multiparametric blood analysis is to create surfaces containing antibody microarrays where different Ab spots encode for cell surface antigens or secreted molecules.26-29 In preceding publications, our lab has demonstrated integration of Ab arrays inside fluidic devices and capture of pure CD4 and CD8 T-cells on Ab spots.30 More recently, we described strategies for detecting secreted cytokines or other proteins in the immediate vicinity of captured cells.31-33 While our previous reports pointed to the possibility of multiplexed analysis of cells and secreted cytokines from blood, cell enumeration was carried out by laborious manual counting while cytokine signals were detected with an expensive fluorescence laser microarray scanner.
In the present study we explore the use of lensfree holographic imaging as a rapid, high-throughput cost-effective method for monitoring cell and cytokine signals on Ab microarrays. For this end, a microarray comprised of cell-(anti-CD4, -CD8) and cytokine-specific (TNF-α, -IFN-γ, -IL-2) Ab spots was printed on hydrogel-coated glass slide (see Figure 1), integrated into a silicone rubber microfluidic device and incubated with human blood. Lensfree holographic imaging of Ab microarrays (see Figure 2) quantified CD4 and CD8 T-cell numbers as well as TNF-α, IFN-γ, IL-2 signals. The use of Ab microarrays in tandem with high-throughput lensless on-chip imaging paves the way to simple and cost-effective microdevices for multiparametric blood analysis at the point of care or in resource-poor settings.
Figure 1.

(A) Design of an antibody (Ab) microarray for capturing leukocytes and detecting secreted cytokines. T-cell Ab spots were print next to spots for detection of IFN-γ, TNF-α and IL-2. Anti-mouse IgG spots provided negative control whereas biotin spots were used for positive control. (B) Principle of operation of the assay. T-cells are captured in the immediate vicinity of cytokine-sensing Ab spots. On-chip activation of T-cells results in release of cytokines and detection of these secreted molecules on adjacent Ab spots. Sandwich immunoassay with colorimetric readout is used to visualize cytokine signal. (C) Ab microarrays are integrated with a microfluidic conduit to minimize blood volume required for analysis. T-cell capture and cytokine detection occurs in the microfluidic device.
Figure 2.
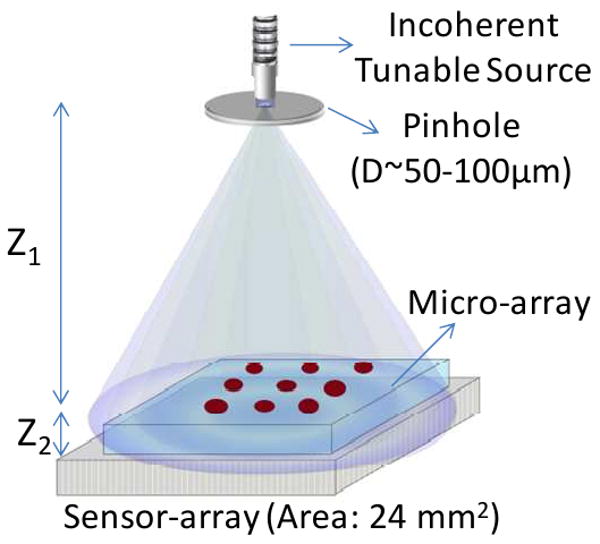
Schematic diagram of the Holographic - LUCAS platform. Z1 and Z2 represent pinhole-to-sample plane and sample-to-detector plane distances, respectively. D is the diameter of the pinhole which filters the spatially incoherent input light.
Materials and Methods
Materials
10× Phosphate-buffered saline (PBS) without calcium and magnesium, paraformaldehyde (PFA), surfactant TWEEN® 20, Na4EDTA, KHCO3, NH4Cl, poly(ethylene glycol) diacrylate (PEG-DA) (MW575), anhydrous toluene (99.9%), bovine serum albumin (BSA) were purchased from Sigma-Aldrich (Saint Louis, MO). Silane adhesion promoter, 3-acryloxypropyl trichlorosilane, was from Gelest, Inc. (Morrisville, PA). Monoclonal antibodies used for capturing T-lymphocytes and cytokines consisted of the following: purified mouse anti-human CD4 (13B8.2) and anti-CD8 (B9.11) Abs from Beckman-Coulter (Fullerton, CA). Purified mouse anti-human IFN-γ Ab (clone K3.53), anti-IL2 Ab (clone 5355), anti-TNF-α/TNFSF1A Ab (clone 28401), biotinylated goat anti-human IFN-γ, IL2 and TNF-α/TNFSF1A Abs from R&D Systems (Minneapolis, MN). As a negative/isotype control we used purified mouse IgG2a (OX34) and purified IgG conjugated to biotin from AbD Serotec. Antibodies used for immunostaining of surface bound cells or flow cytometry analysis listed below: anti-human CD3ε -FITC (UCHT1), anti-CD4-PE (L120) and anti-CD8-PE (RPA-T8) were all purchased from BD Pharmingen. Streptavidin horseradish peroxidase (HRP) conjugate was purchased from Invitrogen (Carlsbad, CA) and Metal Enhanced DAB Substrate kit from Thermo Fisher Scientific Inc. Human recombinant IFN-γ, IL-2 and TNF-α/TNFSF1A were from R&D Systems (Minneapolis, MN). T-cell activation reagents: Phorbol 12-myristate 13-acetate (PMA) and ionomycin were purchased from Sigma-Aldrich. Cell culture medium RPMI 1640: 1×, with L-Glutamine from VWR was supplemented with fetal bovine serum (FBS) and penicillin/streptomycin purchased from Invitrogen. Poly-(dimethylsiloxane) (PDMS) and its curing agents were purchased from Dow Corning (Midland, MI). Glass slides (25×75×1 mm) and coverslip (22×30×0.1 mm) were obtained from VWR (West Chester, PA). Silicone tubing, needles and syringes were purchased from Fisher Scientific, Pittsburgh, PA.
Printing Ab microarrays for cell and cytokine detection
Ab microarrays were printed on poly(ethylene glycol) (PEG) hydrogel-coated glass slides. Preparation of glass surfaces has been described in detail elsewhere.30, 34 PEG gel-coated glass slides were lyophilized for 24 h in order to ensure rapid absorption and uniform distribution of Ab molecules in the hydrogel upon printing. An 8 × 20 microarray of Ab spots (∼300 μm diameter, 375 μm center-to-center spacing) was printed on hydrogel-coated glass slides using contact microarrayer (GMS 417 Affymetrix, Santa Clara, CA). Prior to printing, anti-CD4, -CD8, -IFN-γ, -IL-2, -TNF-α and mouse IgG (negative control) Abs were dissolved in DI water at a concentration of 0.2 mg/mL and were supplement with BSA (0.5% v/v) and Tween20 (0.005% v/v) (anti-CD4 and -CD8 Abs contain only 0.005% Tween20). Components of the microarray were loaded into a 384-well plate (Genetix, Boston, MA) and then robotically imprinted onto a hydrogel-coated glass slide. After printing, surfaces were air dried and stored in a sealed box at 4°C prior to further use.
Figure 1(A, B) shows design of the microarray with columns of anti-CD4 or –CD8 Ab spots placed next to rows of cytokine immunoassay spots. This microarray arrangement ensured that all cytokine immunoassay spots were exposed to the same cytokine concentration. In addition to capture Abs, cytokine immunoassay microarray included several negative and positive controls. Anti-mouse IgG-2a spots were employed as negative (isotype) control, while IgG conjugated to biotin spots were used as a positive control for streptavidin-HRP molecules used in our experiments to visualize cytokine binding.
Integrating Ab microarrays into a microfluidic device
Ab microarrays were incorporated into a microfluidic device to decrease blood sample volume required for analysis and to increase cytokine concentration. Microfluidic devices, fabricated from poly(dimethyl siloxane) (PDMS) using standard soft lithography approaches35, are described in greater detail elsewhere.31 Each device contained two blood analysis channels with width-length-height dimensions of 3×10×0.1 mm as well as independently addressed auxiliary channels for applying negative pressure to PDMS slab. The auxiliary vacuum channels went around the perimeter of the fluidic device as well as between fluid-flow channels. Applying negative pressure to this network of channels suctioned the PDMS device onto a glass substrate. The negative pressure was applied for the duration of the cell capture and cytokine detection experiment. This strategy provided an effective seal for a fluidic conduit and was non-destructive to printed Ab arrays. PDMS fluid conduit could be easily removed subsequent to cell capture and cytokine detection experiments. Pressure-driven fluid flow was established in the microfluidic channels by means of withdrawing a 5 ml syringe connected to a syringe pump (Harvard Apparatus, Boston, MA). Syringe to microfluidic channel connection was made via silicone tubing (1/32 inch I.D., Fisher) which was attached to the outlet of the flow chamber with a metal insert cut from a 20 gauge needle. At the inlet, we positioned a 20 gauge needle carrying a plastic hub with volume of 100 μL to create a reservoir for sampling. Cell suspension was dispensed into this reservoir and introduced into the fluidic channel by withdrawing a syringe pump. Typical blood analysis experiment required ∼50 μl of cell suspension.
Capturing T-cells on Ab spots inside a microfluidic device
Red blood cell (RBC) depleted whole human blood was employed in T-cell isolation experiments. Blood was collected from healthy adult donors through venipuncture under sterile conditions with informed consent and approval of the Institutional Review Board of the University of California at Davis (protocol number 200311635-6). HIV-infected blood was obtained from patients infected at least 2 years, with detectable plasma viral load, and not currently undergoing antiretroviral therapy. Written informed consent was obtained from all patients as approved by the Institutional Review Board (IRB) of the University of California Davis protocol number 200311088-11.
RBCs were removed using ammonia chloride based erythrocyte lysis solution (89.9 g NH4Cl, 10.0 g KHCO3, and 370.0mg tetrasodium EDTA in 10 L of deionized water) as described previously.30, 34 RBC-depletion produced blood cell suspension comprised of granulocytes, peripheral blood mononuclear cells and RBC debris. The cells were concentrated by centrifugation and re-suspended in RPMI1640 medium containing 10% FBS and 1% penicillin/streptomycin but without L-glutamine and Phenol Red (Mediatech, Herndon, VA).
We carried out two types of experiments. In one set of experiments, each channel contained cell-capture and cytokine-detection arrays. Another set of experiments focused solely on cell counting and the channels contained only T-cell-capture arrays. Prior to introduction of cells, PDMS molds containing fluidic and vacuum channels were sterilized by 15 min UV exposure in a tissue culture hood. Sterile 1× PBS was first injected into the flow chamber to remove air bubbles, then 50 μl of RBC-lysed blood, resuspended in phenol red-free RPMI1640, was added into the inlet reservoir (hub of a 20 gauge needle) and drawn into a microfluidic channel at shear stress of 0.3 dyne/cm2 (9 μl/min). Upon entry of cells into a channel the shear stress was decreased to 0.1 dyne/cm2 (3 μl/min) and was maintained for 15 min allowing cells to interact with Ab microarrays. This time was found by us to be sufficient for binding of cells on Ab spots.34 In order to wash away nonspecific cells while retaining T-cells captured on Ab microarrays flow rate was increased to 50 μl/min, creating a shear stress of 1.7 dynes/cm2. The shear stress window of 1-2 dynes/cm2 was previously found to be optimal for removal of nonspecifically bound cells as well as contaminating monocytes, while retaining CD4 and CD8 T-cells.11, 30 Flow rate to shear stress conversions were made by equating microfluidic device to infinitely wide parallel-plate flow chamber as described before.34, 36
Detecting cell-secreted cytokines on Ab microarrays
Upon capture of T-cells devices were flushed with 1× PBS and filled with mitogenic agents to commence cell activation and cytokine production. The mitogenic solution consisted of PMA and ionomycin dissolved to concentrations of 50 ng/ml and 2μM respectively in phenol red-free RPMI1640 media supplemented with 10% FBS. A surgical clamp was secured around the inlet/outlet tubing to eliminate convective mixing and to establish diffusion gradient of cytokine concentration. A microfluidic chamber with captured T-cell was then placed into a tissue culture incubator (37°C, 5% CO2 and 90% humidity) for periods of time ranging from 4 to 15h. The dual channel design of the microfluidic device (see Figure 1C) allowed placement of Ab microarrays in each of the channels. Thus, one channel/microarray could be used for mitogenic activation of T-cells whereas the other channel could serve as a negative control not receiving a mitogen. Alternatively, one channel could be used to capture CD4 T-cells and detect cytokines secreted by these cells, whereas the other channel could be used for binding of CD8 T-cells and detecting cytokine release of this subset.
At the end of the activation period, a cocktail of biotinylated anti-IFN-γ, -TNF-α and -IL-2 Abs (5 μg/mL in 1% of BSA) was introduced into the microfluidic channel and incubated for 30 min. In the next step, streptavidin-HRP (10 μg/mL in 1% of BSA) was flushed into the fluidic device, incubated for 30 min and was then followed by color reagent DAB (diaminobenzidine) substrate for 5 min. Samples were washed and fixed with 4% PFA before analysis. This procedure resulted in formation of sandwich immunoassay on cytokine detection spots as shown in Figure 1A. Importantly, cytokine sensing spots had a visible color signal that could be quantified using simple absorbance measurements described below.
Lensfree holographic imaging of cell and cytokine signals on Ab microarrays
For lensfree on-chip imaging of microarrays, we utilized the Holographic-LUCAS platform to acquire the two dimensional holographic diffraction pattern of each cell that is captured on the chip as well as to monitor the cytokine spots on the same micro-array. These acquired images were then digitally processed using custom-developed holographic reconstruction 23-25 and pattern recognition algorithms 21 to enable characterization of each antibody micro-array chip.
In these Holographic LUCAS experiments (see Figure 2), each microarray chip was loaded onto the active region of an opto-electronoc sensor-array (CMOS, Model: MT9P031, Micron Technology – with a pixel size of 2.2 μm and an imaging area of 24.4 mm2). The distance between the surface of the sensor-chip and the micro-array is controlled to be <∼1 mm. This assembly was illuminated by a tunable monochromator source (Cornerstone T260, Newport Corp.) which was comprised of a Xenon Lamp along with a standard grade fused silica multi-mode fiber (77564, Newport). A pinhole of ∼100μm diameter located at ∼10 cm above the sensor surface is used to filter the incoherent light of the monochromator to better control the spatial coherence diameter at the micro-array plane. For capturing lensless holographic signatures of the micro-array elements, we tuned the wavelength of the monochromator to λ0 = 450 nm with a FWHM spectral bandwidth of ∼15 nm. Under these illumination conditions the spatial coherence diameter at the microarray chip surface can be estimated to be >400 μm, which is sufficiently large for capture of individual cell holograms at the sensor-array. These recorded holographic shadow images of the cells permitted further digital reconstruction of microscopic images of the same field of view by using iterative phase recovery algorithms,23-25 which was then followed by automated cell identification and counting using a custom developed decision algorithm. Raw holograms of the cells as well as their reconstructed images were utilized in this algorithm to make a counting decision.
In this cell-counting algorithm, a Laplacian-of-Gaussian (LoG) convolution filter 37, 38 is applied to both the raw hologram image and its reconstructed version to enhance the contrast of cell signatures from background noise as well as to distinguish any partially overlapping cells in high-density samples. Any potential issues due to illumination gradients, thin film interference patterns, or pixel noise will be also be mitigated by the LoG filter. Once the digital filtering is complete, points of interest can be extracted from the filtered images by means of a threshold operation whereby all pixel values below a certain value will be set to black and remaining pixels will be set to white, resulting in a binary black and white image. However, this introduces a problem where clusters of cells or cells in very close proximity may be joined in this binarization process. To address this problem, digital separation is achieved through the application of a watershed filter 39 which partitions two connected objects at their point of minimum overlap. At this stage, we have successfully identified salient points of interest within our imaging field-of-view. Such points are likely to represent target cell locations; however, a proper screening process is necessary to discriminate target points from erroneous ones. Toward this endeavor, a set of descriptors is applied to each potential cell location based on its size, circularity, signal to noise ratio, and local peak value in the LoG domain as well their holographic and reconstructed signatures. Any point that is not within a range of acceptable criteria based on these parameters will be pruned from the set of valid count objects. With the finalization of the pruning process, markers are printed on the original image and statistical information about the counted cells is written to an XML file for further analysis if necessary.
The quantification of the cytokine concentration on the same microarray chip using the Holographic-LUCAS platform required less digital signal processing compared to enumeration of CD4 and CD8 T-lymphocytes. For this end, we averaged the inverted pixel values over an area of ∼0.05 mm2 for each Holographic-LUCAS image that belongs to an individual cytokine spot. Although the area of each cytokine spot on the chip is ∼0.09 mm2, to avoid possible errors caused by the edges or the inhomogeneity of the printing process, we used the center region of each cytokine spot to calculate the mean transmission value of the spot, quantifying the relative amount of local cytokine secretion on micro-array chip.
Results and Discussion
This paper describes the use of Ab microarrays and lensfree holographic on-chip imaging to enable detection of CD4 and CD8 T-cells as well as IFN-γ, TNF-α and IL-2 cytokines from a small volume of human blood (see Figure 1 and 2). Future applications of this cytometry platform for multiparametric blood analysis at the point of care are envisioned.
Determining phenotype of T-cells captured on Ab microarrays
The use of Ab-modified surfaces for determining leukocyte subsets in blood requires the capture of pure cell populations. Figure 3 shows a representative result of a T-cell capture experiment where RBC-depleted human blood was injected into a microfluidic device and allowed to interact with Ab microarrays. Flowing cell suspension across the Ab spots at a flow rate of 3 μl/min (shear stress 0.1 dyne/cm2) for 15 min resulted in capture of cells. The time was sufficient for on-spot cell density to reach saturation. The Ab microarray was designed so as to capture CD4 and CD8 T-cells on the adjacent rows of spots. The phenotype of captured T-cells has previously been rigorously examined 30, 34 but was confirmed in the present study as well. Leukocytes captured inside the fluidic channels were incubated with a mixture of anti-CD3-FITC (green) (T-cell marker) and anti-C4-PE (red) Abs to establish phenotype of captured cells as either CD3+CD4+ or CD3+CD4- (CD8 T-cells). As seen from Figure 3, cells residing on anti-CD4 spots expressed both CD3 and CD4 antigens identifying them as CD4 T-lymphocytes. As shown in Figure 2C, cells captured on anti-CD8 spots stained positive for CD3 but did not express CD4. These cells were assumed to be CD8 T-lymphocytes given the low abundance of other leukocytes that express CD3 but not CD4 (e.g. natural killer T-cells <0.2% or CD3+CD4-CD8- cells < 5%). The images of Figure 3 demonstrate our ability to capture different T-cell subsets on the adjacent Ab spots. As can be seen from Figure 3 the numbers of T-cells residing on anti-CD4 and anti-CD8 Ab spots were different. The next section describes the use of lensfree holographic imaging for rapidly enumerating CD4 and CD8 T-cells captured on Ab spots and for determining CD4/CD8 ratio.
Figure 3.
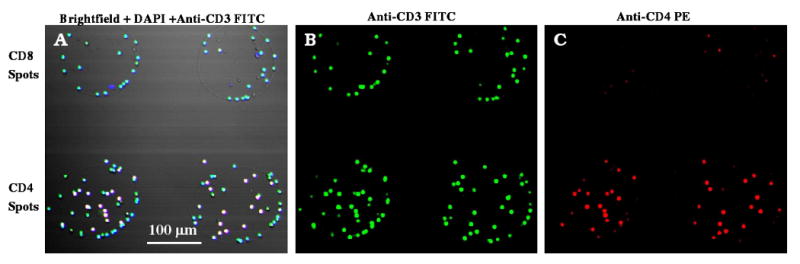
Immunofluorescent staining of cells captured on 300 μm diameter CD4 and CD8 Ab spots from uninfected blood. (A) Merged brightfield + DAPI (blue) + anti-CD3FITC (green) image of cells shows that captured cells have small nuclei and stain positive for CD3. This confirms cell phenotype as T-cells. (B) Cells on anti-CD4 Ab spots were stained with both anti-CD3 FITC (green) and anti-CD4 PE (red), identifying these cells as CD4+ T-cells. (C) Cells on anti-CD8 Ab spots were stained with anti-CD3 FITC (green) but not with anti-CD4 PE (red) pointing to CD3+CD4- or CD8+ T-cell phenotype.
Quantifying CD4/CD8 ratio based on T-cell distribution on Ab spots
In addition to CD4 T-cell counts, CD4/CD8 ratio represents an important diagnostic indicator of HIV/AIDS.2, 3 To highlight the tandem use of Ab microarrays and Holographic-LUCAS platform for leukocyte phenotyping we characterized CD4/CD8 ratio from blood of healthy volunteers and HIV- infected patients. In these experiments, counts obtained by lensfree holographic imaging were compared to traditional brightfield microscopy to validate our optical characterization approach. Figure 4A compares typical 10× objective-lens microscope images with raw Holographic-LUCAS images as well as the reconstructed holographic images of T-cells captured on 300 μm diameter Ab spots. Automated identification algorithms (see Materials and Methods Section) ensured that cell numbers obtained with holographic imaging were in good agreement with microscopy-based counts. In a typical experiment, cells bound on 10 different CD4 and CD8 spots were enumerated and averaged to account for spot-to-spot variability. Figure 4B compares CD4 and CD8 numbers obtained by lensfree holographic imaging and conventional microscopy-based counting for 10 T-cell clusters formed on 300 μm diameter Ab spots. These data show excellent agreement between the two approaches. A tremendous advantage of our approach is that automated cell counting of the entire imaging field of view (∼24 mm2) of the Holographic-LUCAS platform takes less than a few seconds even using a modest CPU (e.g., at 1.8 GHz).
Figure 4.
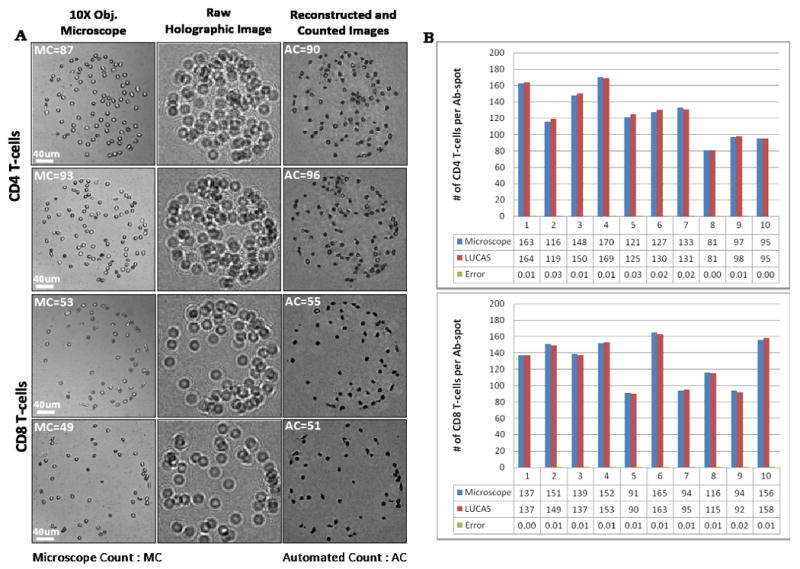
(A) Lensfree holographic imaging- and conventional microscopy-based characterization of CD4 and CD8 T-cells on 300 μm diameter Ab spots. Sub-panels demonstrate 10× objective-lens microscope images, representative raw holograms (amplitude), and reconstructed & counted holograms of the same Ab spots. Automated CD4 and CD8 cell counting results using Holographic-LUCAS match very well with conventional microscope count results. (B) A representative histogram showing CD4 and CD8 T-cell counting on an array of Ab spots (n=10).
It should be noted that immunostaining was not required in these T-cell counting experiments. Given the high purity of CD4 and CD8 T-cells on Ab spots,30, 34 the phenotype was determined solely based on location of the cells within the microarray. The “location gating” was used to assign CD4 and CD8 phenotype to cells residing on anti-CD4 and anti-CD8 Ab spots respectively. After determining the numbers of CD4 and CD8 T-cells, the CD4/CD8 ratio could be easily established. Figures 5(A) and 5(B) show CD4/CD8 ratios of healthy volunteers (n=5) and HIV-infected patients (n=4) determined by lensfree holographic imaging and conventional bright field microscopy, respectively. As seen from these graphs, there was a close agreement between the two cell counting approaches. Lensfree imaging had significant benefits of capturing a large field of view and providing a rapid cell number readout. The CD4/CD8 ratios of HIV-infected patients were considerably lower than those of healthy subjects (see Figure 5) -this is consistent with depletion of CD4 T-cells during HIV.
Figure 5.

CD4/CD8 ratios obtained by Holographic-LUCAS as well as conventional microscopy for (A) healthy volunteers (n=5) and (B) HIV-infected patients (n=4) are illustrated. Automated Holographic-LUCAS based counting results were in close agreement with conventional microscopy based counting.
The results of Figures 4 and 5 further demonstrate that lensfree scanning allowed to accurately enumerate surface-bound cells for a large array of Ab spots. T-cell binding to Ab microarrays occurred after 15 min of incubation with RBC depleted blood whereas automated counting of cells on microarrays with lensfree imaging required <4 seconds using a modest CPU. These results provide proof-of-concept multiparametric analysis of leukocyte numbers and subset proportions using novel integration of Ab microarrays and lensfree holographic imaging. The information content of this cytometry platform will be further enhanced in the future by including on the same microarray chip various other Abs for capturing different leukocyte subsets (e.g. neutrophils, monocytes and B-cells).
On-chip detection of T-cell secreted cytokines
Release of cytokines is used by leukocytes to orchestrate immune responses to pathogens. Therefore, detection of cytokine production is an important indicator of immune cell function.5 In addition, cytokine profiles are often used to determine phenotype of leukocytes. For example, CD4 T-cells (T-helper cells) are commonly subdivided into T-helper1 (Th1) phenotype comprised of cells producing IFN-γ and IL-2, and Th2 phenotype containing cells that release IL-4 and IL-10. In HIV-infected patients prevalence of Th1 phenotype has been correlated with vigorous immune response and non-progression while Th2 phenotype has been associated with rapid progression to AIDS.40, 41
Therefore, in addition to leukocyte counts, cytokine release is an important immune function indicator that is significant to have at the point of care. Given that the same cytokines may be released by different types of leukocytes (e.g. IFN-γ can be released by CD4 T-cells or CD8 T-cells) making a connection between leukocyte subset and cytokine production is particularly challenging. Currently, leukocyte subset-cytokine profile connection requires either a purification step prior to cytokine analysis or flow cytometry-based analysis of surface markers and intracellular cytokines. Both of these approaches are labor intensive, expensive and utilize bench top instrumentation making them unsuitable for low cost or point-of-care blood analysis. To simplify analysis of cell subset-specific cytokines we developed a microarray of cell- and cytokine-specific Ab spots that allowed to place pure T-cell population in the immediate vicinity of multiplexed cytokine immunoassay.31 However, the use of immunofluorescence and laser microarray scanners for quantifying cytokine binding in these previous studies made the detection method unsuitable for the point of care applications.
In the present study we sought to simplify cytokine detection by employing immunostaining with visible color readout and by scanning cytokine detection microarrays using lensfree holographic on-chip imaging. Figure 1(A, B) demonstrates the design of Ab microarrays where columns of anti-CD4 or anti-CD8 Ab spots were printed next to rows of anti-IFN-γ, anti-TNF-α, anti-IL-2, anti-mouse IgG (negative control) and biotin (positive control) spots. The microarray was incorporated into a microfluidic device and then incubated with RBC depleted human blood, as described in the previous section, resulting in the capture of either CD4 or CD8 T-cells next to cytokine detection microarray. Cytokine release from T-cells was induced by incubation with a mitogen inside a fluidic device. The flow in the chamber was stopped during T-cell activation and cytokine production to eliminate convection. The binding of cytokine molecules on Ab microarrays was visualized by injecting a cocktail of biotinylated anti-IFN-γ, -IL-2 and – TNF-α Abs into the microfluidic device, followed by HRP-avidin and visible color reagent (DAB).
Results of a typical experiment are shown in Figure 6(A, B). As seen from this figure, cells are localized adjacent to cytokine sensing Ab spots with brown color indicating the presence of secreted cytokine molecules. The use of PEG hydrogel coating as a non-fouling matrix for printing microarrays ensures high fidelity of cell binding on Ab regions and limited leukocyte adhesion elsewhere on the surface. The lack of signal from mouse IgG spots serving as negative controls points to specificity of the cytokine assay. The visible color intensity of anti-IFN-γ, anti-TNF-α and anti-IL-2 Ab spots revealed differences in cytokine production by T-cells that were easily quantified using lensfree on-chip imaging.
Figure 6.
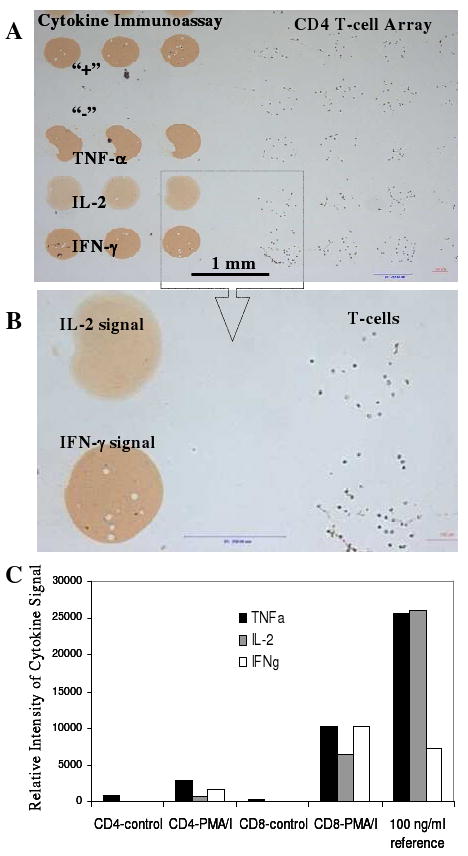
Analysis of cytokine release from healthy human T-cells. (A, B) T-cells captured on 300 μm diameter anti-CD4 Ab spots next to cytokine-sensing Ab microarray. Cells were mitogenically activated on-chip for 4h. Cytokine signal was developed by incubating microarrays with HRP-labeled anti-cytokine Abs and color reagent (DAB). (C) Relative cytokine signal intensity determined by lensfree on-chip imaging of IFN-γ, TNF-α and IL-2-sensing spots. Cytokine signal was observed only when T-cells were mitogenically stimulated with PMA/Ionomyocin. In a parallel experiment, Ab microarrays were exposed to a known reference concentration (100 ng/ml) of recombinant IFN-γ, TNF-α and IL-2. This reference signal was used to estimate the amount of secreted cytokines.
Figure 6C demonstrates intensity profiles of cytokine detection microarrays obtained by the Holographic-LUCAS platform. As can be seen from these data, release of IFN-γ, IL-2 and TNF-α from either CD4 or CD8 T-cells was only observed after mitogenic activation. One should note that both CD4 and CD8 T-cells secreted all the cytokines tested here. Therefore, being able to separate/purify the desired cells prior to cytokine detection was indeed important. As shown in Figure 6C, the concentration of cell-secreted cytokines could be estimated by comparing to cytokine signals of Ab arrays challenged with a known cytokine concentration.
In general, the time required for cytokine detection is defined by the sensitivity of immunoassay as well as by physiology of leukocyte activation. Traditional cytokine detection assays employ prolonged (∼12 to 24h) activation steps.9 Given the miniature reaction chamber volume (3 μl) used in our cytokine sensing experiments, as well as the close proximity of cells to cytokine sensors, our approach is quite sensitive and allows to detect appearance of IFN-γ and TNF-α signals as early as 1h past activation (data not shown). However, we found that IL-2 signal appeared considerable later, requiring 4h activation time. This is likely defined by the signaling/activation mechanisms underlying cytokine production by cells. Therefore, while our microdevices will be further improved in the future by enhancing immunoassay sensitivity and decreasing reaction chamber volume, the response time of cytokine sensors on the chip will depend in large part on the cells used in analysis.
The results presented in Figure 6 are significant as they demonstrate rapid detection of three different cytokines (IFN-γ, IL-2 and TNF-α) from a small population of T-cells captured on the microarray chip. Lensfree on-chip imaging allowed high-throughput optical quantification of the cytokine-sensing Ab microarrays. Furthermore, the same Holographic-LUCAS platform was also used to rapidly image and count T-cell arrays over a large field of view of ∼24 mm2 without the use of any lenses or mechanical scanning. Therefore, as we demonstrated in this work, our lensfree holographic imaging platform is ideally suited for on-chip quantification of both cell and cytokine binding to microarrays.
Conclusions
The need for blood testing in resource-poor settings or at the point of care has spurred the development of simple, compact and cost-effective microfluidic devices.14, 15 In the process of simplifying and miniaturizing blood analysis devices the tendency has been to focus on a single important immune parameter – for example CD4 T-cell counts. Given the complexity of the immune response, detection of multiple immune markers from blood may be required. In a series of previous publications we demonstrated that printed Ab microarrays may be used to both capture multiple pure leukocyte subsets on the same surface 30, 34 and to detect cytokine secretion from a given cell subset.31 However, a simple and high-throughput technology for simultaneous quantification of cell and cytokine binding on Ab microarrays was lacking. In this paper, an on-chip imaging platform (termed Holographic-LUCAS) with large field of view was employed for high-throughput imaging of Ab microarrays without the use of any lenses or mechanical micro-scanners. Holographic-LUCAS allowed to rapidly enumerate CD4 and CD8 T-cells captured on Ab spots and to determine CD4/CD8 ratio in blood of healthy and HIV-infected subjects. In addition, the same imaging technology was also used to detect three different cytokines (IFN-γ, TNF-α and IL-2) that were secreted by T-cells. The future development of a cytometry device integrating Ab microarrays, microfluidic sample delivery and lensfree on-chip imaging will enable low cost yet multiparametric blood analysis at the point of care or in low resource settings.
Acknowledgments
The Ozcan Research Group at UCLA acknowledges the support of the Okawa Foundation, Vodafone Americas Foundation, DARPA DSO (under 56556-MS-DRP), NSF BISH program (under Awards # 0754880 and 0930501), NIH (under 1R21EB009222-01 and the NIH Director's New Innovator Award - Award Number DP2OD006427 from the Office of The Director, National Institutes of Health), AFOSR (under Project # 08NE255) and ONR (under Young Investigator Award 2009). Revzin group acknowledges financial support from NSF (EFRI Award), UC Davis Point-of-Care Technologies Center grant and Autism Research Institute.
References
- 1.Turgeon ML. Clinical Hematology. 3rd. Lippincott Williams & Wilkins; 1999. [Google Scholar]
- 2.Alimonti JB, Ball TB, Fowke KR. J Gen Virology. 2003;84:1649–1661. doi: 10.1099/vir.0.19110-0. [DOI] [PubMed] [Google Scholar]
- 3.Douek DC, Brenchley JM, Betts MR, Ambrozak DR, Hill BJ, Okamoto Y, Casazza JP, Kuruppu J, Kunstman K, Wolinsky S, Grossman Z, Dybul M, Oxenius A, Price DA, Connors M, Koup RA. Nature. 2002;417:95–98. doi: 10.1038/417095a. [DOI] [PubMed] [Google Scholar]
- 4.Brenchley JM, Schacker TW, Ruff DA, Price JH, Taylor GJ, Beilman PL, Nguyen PL, Khoruts A, Larson M, Haase AT, Douek DC. J Exp Med. 2004;200:749–759. doi: 10.1084/jem.20040874. [DOI] [PMC free article] [PubMed] [Google Scholar]
- 5.Pantaleo G, Harari A. Nature Rev Immun. 2006;6:417–423. doi: 10.1038/nri1840. [DOI] [PubMed] [Google Scholar]
- 6.Pantaleo G, Koup RA. Nature Med. 2004;10:806–810. doi: 10.1038/nm0804-806. [DOI] [PubMed] [Google Scholar]
- 7.Rosenberg ES, Billingsley JM, Caliendo AM, Boswell SL, Sax PE, Kalams SA, Walker BD. Science. 1997;278:1447–1450. doi: 10.1126/science.278.5342.1447. [DOI] [PubMed] [Google Scholar]
- 8.Brando B, Barnett D, Janossy G, Mandy F, Autran B, Rothe G, Scarpati B. Cytometry. 2000;42:327–346. doi: 10.1002/1097-0320(20001215)42:6<327::aid-cyto1000>3.0.co;2-f. [DOI] [PubMed] [Google Scholar]
- 9.Karlsson AC, Martin JN, Younger SR, Bredt BM, Epling L, Ronquillo R, Varma A, Deeks SC, McCune JM, Nixon DF, Sinclair E. J Immun Methods. 2003;283:141–153. doi: 10.1016/j.jim.2003.09.001. [DOI] [PubMed] [Google Scholar]
- 10.Toner M, Irimia D. Annu Rev Biomed Eng. 2005;7:77–103. doi: 10.1146/annurev.bioeng.7.011205.135108. [DOI] [PMC free article] [PubMed] [Google Scholar]
- 11.Cheng XH, Irimia D, Dixon M, Sekine K, Demirci U, Zamir L, Tompkins RG, Rodriguez W, Toner M. Lab Chip. 2007;7:170–178. doi: 10.1039/b612966h. [DOI] [PMC free article] [PubMed] [Google Scholar]
- 12.Sethu P, Moldawer LL, Mindrinos MN, Scumpla PO, Tannahill CL, Wilhelmy J, Efron PA, Brownstein BH, Tompkins RG, Toner M. Anal Chem. 2006;78:5453–5461. doi: 10.1021/ac060140c. [DOI] [PubMed] [Google Scholar]
- 13.Cheng XH, Gupta A, Chen CC, Tompkins RG, Rodriguez W, Toner M. Lab Chip. 2009;9:1357–1364. doi: 10.1039/b818813k. [DOI] [PMC free article] [PubMed] [Google Scholar]
- 14.Rodriguez WR, Christodoulides N, Floriano PN, Graham S, Mohanty S, Dixon M, Hsiang M, Peter T, Zavahir S, Thior I, Romanovicz D, Bernard B, Goodey AP, Walker BD, McDevitt JT. PLoS Medicine. 2005;2:0663–0672. doi: 10.1371/journal.pmed.0020182. [DOI] [PMC free article] [PubMed] [Google Scholar]
- 15.Cheng X, Liu YS, Irimia D, Demirci U, Yang LJ, Zamir L, Rodriguez WR, Toner M, Bashir R. Lab Chip. 2007;7:746–755. doi: 10.1039/b705082h. [DOI] [PMC free article] [PubMed] [Google Scholar]
- 16.Wang YN, Kang YJ, Xu DY, Chon CH, Barnett L, Kalams SA, Li DY, Li DQ. Lab Chip. 2008;8:309–315. doi: 10.1039/b713932b. [DOI] [PubMed] [Google Scholar]
- 17.Ozcan A, Demirci U. Lab On A Chip. 2008;8:98–106. doi: 10.1039/b713695a. [DOI] [PubMed] [Google Scholar]
- 18.Seo S, Su TW, Erlinger A, Ozcan A. Cell Mol Bioeng. 2008;1:146–156. [Google Scholar]
- 19.Su T, Seo S, Erlinger A, Ozcan A. Biotech Bioeng. 2008 doi: 10.1002/bit.22116. [DOI] [Google Scholar]
- 20.Moon S, Keles HO, Ozcan A, Khademhosseini A, Haeggstrom E, Kuritzkes D, Demirci U. Biosens Bioelectron. 2009;24:3208–3214. doi: 10.1016/j.bios.2009.03.037. [DOI] [PMC free article] [PubMed] [Google Scholar]
- 21.Seo S, Su TW, Tseng DK, Erlinger A, Ozcan A. Lab Chip. 2009;9:777–787. doi: 10.1039/b813943a. [DOI] [PMC free article] [PubMed] [Google Scholar]
- 22.Mudanyali O, Erlinger A, Seo S, Su T, Tseng D, Ozcan A. JoVE. 2010 doi: 10.3791/1650. [DOI] [PMC free article] [PubMed] [Google Scholar]
- 23.Oh C, Isikman SO, Khademhosseinieh B, Ozcan A. Optics Express. 2010;18:4717–4726. doi: 10.1364/OE.18.004717. [DOI] [PMC free article] [PubMed] [Google Scholar]
- 24.Isikman SO, Sencan O, Mudanyali O, Bishara W, Oztoprak C, Ozcan A. Lab Chip. 2010 doi: 10.1039/C001200A. [DOI] [PMC free article] [PubMed] [Google Scholar]
- 25.Isikman SO, Seo S, Sencan A, Erlinger A, Ozcan A. IEEE Photonics Society Annual Fall Meeting. 2009:404–405. [Google Scholar]
- 26.Belov L, de la Vega O, dos Remedios CG, Mulligan SP, Christopherson RI. Canc Res. 2001;61:4483–4489. [PubMed] [Google Scholar]
- 27.Chen DS, Soen Y, Stuge TB, Lee PP, Weber JS, Brown PO, Davis MM. Plos Medicine. 2005;2:1018–1030. doi: 10.1371/journal.pmed.0020265. [DOI] [PMC free article] [PubMed] [Google Scholar]
- 28.Soen Y, Chen DS, Kraft DL, Davis MM, Brown PO. PLOS Biology. 2003;1:429–438. doi: 10.1371/journal.pbio.0000065. [DOI] [PMC free article] [PubMed] [Google Scholar]
- 29.Bailey RC, Kwong GA, Radu CG, Witte ON, Heath JR. J Am Chem Soc. 2007;129:1959–1967. doi: 10.1021/ja065930i. [DOI] [PMC free article] [PubMed] [Google Scholar]
- 30.Zhu H, Macal M, George MD, Dandekar S, Revzin A. Anal Chim Acta. 2008;608:186–196. doi: 10.1016/j.aca.2007.12.021. [DOI] [PubMed] [Google Scholar]
- 31.Zhu H, Stybayeva GS, Macal M, George MD, Dandekar S, Revzin A. Lab Chip. 2008;8:2197. doi: 10.1039/b810244a. [DOI] [PubMed] [Google Scholar]
- 32.Zhu H, Stybayeva GS, Silangcruz J, Yan J, Ramanculov E, Dandekar S, George MD, Revzin A. Anal Chem. 2009;81:8150–8156. doi: 10.1021/ac901390j. [DOI] [PMC free article] [PubMed] [Google Scholar]
- 33.Jones CN, Lee JY, Stybayeva GS, Zern MA, Revzin A. Anal Chem. 2008;80:6351–6357. doi: 10.1021/ac8007626. [DOI] [PubMed] [Google Scholar]
- 34.Sekine K, Revzin A, Tompkins RG, Toner M. J Immunol Methods. 2006;313:96–109. doi: 10.1016/j.jim.2006.03.017. [DOI] [PubMed] [Google Scholar]
- 35.Whitesides GM, Ostuni E, Takayama S, Jiang X, Ingber DE. Annu Rev Biomed Eng. 2001;3:335–373. doi: 10.1146/annurev.bioeng.3.1.335. [DOI] [PubMed] [Google Scholar]
- 36.Tilles AW, Baskaran H, Roy P, Yarmush ML, Toner M. Biotech Bioeng. 2001;73:379–389. doi: 10.1002/bit.1071. [DOI] [PubMed] [Google Scholar]
- 37.Marr D, Ullman S. Proc R Soc. 1981;B211:151–180. doi: 10.1098/rspb.1981.0001. [DOI] [PubMed] [Google Scholar]
- 38.Ullman S. IEEE Computer. 1981;14:57–69. [Google Scholar]
- 39.Vincent L, Soille P. IEEE Trans Pattern Anal Machine Intell. 1991;6:583–598. [Google Scholar]
- 40.Clerici M, Hakim FT, Venzon DJ, Blatt S, Hendrix CW, Wynn TA, Shearer GM. J Clin Invest. 1993;91:759–765. doi: 10.1172/JCI116294. [DOI] [PMC free article] [PubMed] [Google Scholar]
- 41.Clerici M, Shearer GM. Immunol Lett. 1996;51:69–73. doi: 10.1016/0165-2478(96)02557-6. [DOI] [PubMed] [Google Scholar]