Abstract
Differential mobility spectrometry or field asymmetric waveform ion mobility spectrometry (FAIMS) is gaining broad acceptance for analyses of gas-phase ions, especially in conjunction with largely orthogonal separation methods such as mass spectrometry (MS) and/or conventional (drift tube) ion mobility spectrometry. In FAIMS, ions are filtered while passing through a gap between two electrodes that may have planar or curved (in particular, cylindrical) geometry. Despite substantial inherent advantages of the planar configuration and its near-universal adoption in current stand-alone FAIMS devices, commercial FAIMS/MS systems have employed curved FAIMS geometries that could be interfaced to MS more effectively. Here we report a new planar (p-) FAIMS design with slit-shaped entrance and exit apertures that substantially increase ion transmission in and out of the analyzer. The front slit interface effectively couples p-FAIMS to multi-emitter electrospray ionization (ESI) sources, improving greatly the ion current introduced to the device and allowing liquid flow rates up to ~50 μL/min. The back slit interface increases the transmission of ribbon-shaped ion beams output by the p-FAIMS to downstream stages such as a MS. Overall, the ion signal in ESI/FAIMS/MS analyses increases by over an order of magnitude without affecting FAIMS resolution.
Keywords: Electrospray Ionization, ESI Emitter Array, FAIMS, Differential Mobility Spectrometry, Inlet Capillary
Introduction
Field asymmetric waveform ion mobility spectrometry (FAIMS) is increasingly recognized as a powerful separation technique that can process ions in gases in milliseconds at ambient conditions1–6 and is readily combined with other common analytical tools, including liquid chromatography (LC)7–9 and/or mass spectrometry (MS).9–13 The operation of FAIMS has been understood fundamentally2, 5, 14 and modeled mathematically and in simulations.10, 15–17 Briefly, the mobility of an ion in a gas mainly depends on E/N, where E is the electric field intensity and N is the gas number density:18
| (1) |
where K(0) is the mobility in zero-field limit and f(E/N) is a function of field strength. This allows sorting ions by the difference of their mobility at high and low E/N [that is, the form of f(E/N)], regardless of K(0). On the contrary, the conventional drift tube ion mobility spectrometry (DTIMS) separates ions by absolute mobility, and the field is commonly weak enough to equate K(E/N) to K(0). In FAIMS, ions experience alternating strong and weak fields of opposite polarity, generated by a periodic asymmetric waveform1 applied in the gap between two electrodes in the direction perpendicular to a gas flow. Ions carried through FAIMS by the flow are displaced toward one of the electrodes in each waveform cycle and would eventually get discharged. To prevent this for species with a certain difference between mobility at high and low E/N and keep them stable in the gap, the net displacement induced by the waveform is offset by adding to it an appropriate dc potential (the compensation voltage, CV).2, 14 Then each ion species passes FAIMS at a CV that is unique for a given waveform peak amplitude (the dispersion voltage, DV). The proper value for any ion can be found by scanning CV over a broad range while monitoring the ions emerging from FAIMS by some detector, for example a charge collector or a following MS stage. For easier data comparison across different FAIMS geometries, CV is converted to the compensation field, EC, by dividing over the gap width.
The FAIMS separation by mean derivative of K(E/N) function is largely independent of methods employing other physical principles such as DTIMS or LC based on adsorption properties. Hence integrating FAIMS with LC and/or DTIMS significantly increases selectivity and helps isolating and identifying trace components in complex samples. In particular, inserting FAIMS into the LC/ESI/MS pipeline raises the separation peak capacity, improving the spectral quality and removing isobaric interferences.8, 9, 19–24
All commercial ESI/FAIMS/MS platforms employ coaxial cylindrical FAIMS electrodes, where ions traverse the annular gap either parallel to the axis25, 26 or (in the “side-by-side” arrangement) along the circumference.27 In either case, inhomogeneous electric field in curved gaps focuses ions to the median, which enhances ion transmission through FAIMS. However, focusing limits the resolving power R by rendering species with differing CVs stable at different radial positions in the gap, and, by calculations,28 the optimum resolution/sensitivity balance at any R is provided by planar FAIMS. Further, the focusing strength is controlled by the shape of K(E/N), causing discrimination in FAIMS against poorly focusing species that complicates quantification and compresses the dynamic range.16 Species that are focused with one waveform polarity [also decided by the form of K(E/N)] are defocused with the opposite polarity. Covering both polarities means duplication of analyses, which halves the experimental duty cycle. The homogeneous field in planar FAIMS does not focus ions, and all species can be analyzed simultaneously without discrimination by focusing properties. Those advantages are widely recognized and most stand-alone FAIMS analyzers have employed the planar (p-) geometry.29–32 Though p-FAIMS/MS coupling has been demonstrated, its broad adoption has been impeded by poor sensitivity ensuing from unrestrained ion beam expansion in the gap and large losses at the interface. This problem can be addressed by replacing the standard circular orifice at the MS inlet by a slit aperture that better captures ribbon-like beams exiting p-FAIMS,28 followed by electrodynamic ion funnel for their re-focusing into tight circular beams for MS analysis.33 Here we explore this solution in depth, looking at the merits of various slit geometries.
Another path to more sensitive ESI/FAIMS/MS analyses is increasing the ion flux generated by ESI and its transmission into the FAIMS stage. The ionization efficiency of ESI is boosted by reducing the liquid flow rate (Q) to yield smaller, more readily desolvated charged droplets.34 For a fixed flow of infused analyte35–37 or eluent from LC separation, the reduction can be achieved by partitioning the flow over an array of ESI emitters.35, 37, 38 Multi-ESI sources have previously been coupled to MS using multi-inlet/ion funnel interfaces that can collect ions from a large area.39 Present ESI/FAIMS interfaces using a curtain plate/orifice with a single circular inlet cannot efficiently sample the ion current from an ESI emitter array because of geometric mismatch and perhaps charge-capacity constraints: a multi-aperture FAIMS inlet is clearly in need.
Penetration of ESI solvent vapors into FAIMS causes large CV shifts that preclude reproducible analyses. The gas counterflow through the curtain plate prevents this penetration and ensures stable CVs at lower Q, but the amount of vapors (proportional to Q) apparently overcomes that counterflow at higher Q and CVs drift, depending on Q.40 Emitter arrays reduce the production of vapors per unit volume, which should make repelling them from the FAIMS gap easier and thus permit greater liquid flows with ESI/FAIMS analyses.
Here we report a p-FAIMS with multi-aperture slit front and back interfaces that enable in-plane processing of ion beams generated by linear ESI emitter arrays through FAIMS and into downstream stages. The ion transmission efficiencies both into and out of p-FAIMS improve significantly, raising the final ion signal by an order of magnitude compared to ESI/FAIMS/MS systems with standard circular interfaces. These FAIMS devices are compatible with ESI liquid flows up to (at least) 50 μL/min.
Experimental Section
Sample
Measurements used the 10 μM solution of reserpine and the solution of 4 peptides [1 μM each of bradykinin (Bk), angiotensin I (Ang), fibrinopeptide a (Fib), and neurotensin (Neu)] in 50:49:1 water/methanol (HPLC grade)/acetic acid mixture, with water purified through a Barnstead Nanopure Infinity system (Dubuque, IA).
ESI sources
We evaluated ESI arrays comprising 5, 9, and 19 emitters spread over a 10-mm linear segment versus a single emitter benchmark. Thus emitters were spaced by >0.5 mm, sufficing to avoid undue mutual interference in the ESI operation.41 Emitters with 20 μm i.d. were made by chemical etching of fused-silica capillaries,42 with arrays fabricated as previously described.36 The ESI voltage (2.9 KV to ground) was generated by a Bertan 205B-03R power supply (Hicksville, NY) and loaded on a stainless steel union holding the emitter. The sample was infused by a KD Scientific syringe pump (Holliston, MA) at Q = 0.5 – 50 μL/min, using 0.5 μL/min unless specified otherwise.
New p-FAIMS design
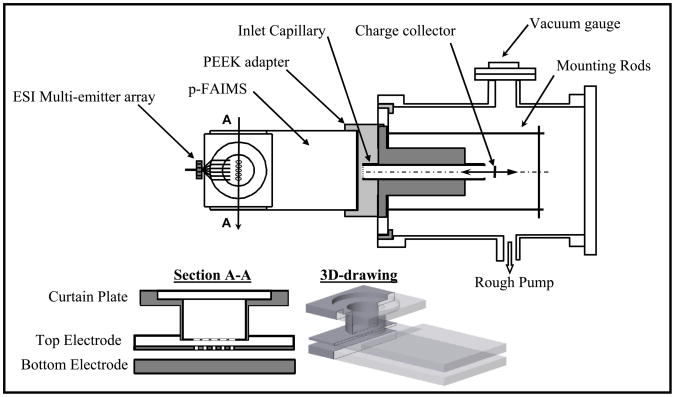
The FAIMS unit is a modified high-resolution planar FAIMS developed at PNNL.28 The front interface now features five circular apertures with diameters of 1.60 mm in the curtain plate and 0.96 mm in the orifice, equally spaced over superposed segments of 10 mm to match the length of ESI emitter arrays (Figure 1). Thus, the ratio of curtain plate and orifice aperture areas remains 2:1 as in the single-aperture design,28 keeping the same flow split between the curtain gas for desolvation of ESI droplets (2/3) and carrier gas pulling ions through FAIMS (1/3). A bisinusoidal asymmetric waveform with 750 kHz frequency and DV = 4.0 kV was applied to one electrode while the other was connected to a programmable dc power supply for the CV scan.28 The gap between FAIMS exit and following inlet capillary was fixed at 2 mm by a PEEK adapter. Experiments used high-purity nitrogen (99.998 %) with the total flow set to 2 L/min by mass flow controller (1479A metal-sealed mass flow controller, MKS Instruments, Andover, Ma). Under these conditions, the protonated reserpine (m/z = 609) has a distinctive peak28 at EC = −15 V/cm, where all transmission data were collected.
Figure 1.
Experimental setup: scheme of p-FAIMS analyzer coupled to a vacuum chamber that contains a charge collector via an inlet capillary (top) and new FAIMS unit with a slit front interface (bottom).
Inlet capillary
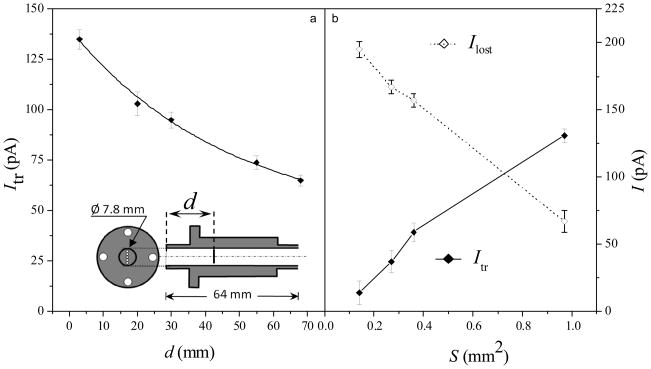
The steel inlet capillary comprises an aperture cut in a 0.25 mm thick plate, followed by a bore of 7.8 mm diameter and 64 mm length (Figure 2a). The aperture is a string of 11 equally-spaced circular holes with diameters of 0.127, 0.178, and 0.203 mm spaced over 4 – 5 mm, or a rectangular (4.8 mm × 0.203 mm) slit, termed below designs I, II, III, and IV, respectively. Relative to the cross-section of heated capillary at the MS inlets of our benchmark FAIMS/MS instrument28 (i.d. of 0.43 mm and length of 78 mm), those apertures have areas of 1 (I), 2 (II), 2.6 (III), and 7 (IV). The conductance of a capillary decreases with increasing length because of viscous friction. The capillary in commercial FAIMS/MS systems (Thermo Fisher) is slightly wider (i.d. = 0.5 mm) but also longer (140 mm) than that in our benchmark, and its conductance is close to that of design I. The gap of p-FAIMS matches the orientation of elongated inlet.
Figure 2.
Ion currents incident on the charge collector (“transmitted current”, Itr) and inlet capillary block (“lost current”, Ilost) depending on (a) the axial position of collector in the capillary and (b) the inlet entrance area. All measurements use five ESI emitters and slit front FAIMS interface, results in (b) include the data for slit inlet designs I – IV (discussed in the text).
Charge detector
In a test platform, ions passing the inlet enter a joined vacuum chamber.34 Briefly, it is constructed from a 6-in. diameter four-way reducing stainless steel cross and pumped by an E1M18 rough pump (BOC Edwards, Wilmington, MA). The inside pressure ranges from 2 Torr with design I to ~20 Torr with design IV, as measured by a strain gauge (BOC Edwards). The ion current is collected on a stainless steel disk of 6 mm diameter, held on a rod and translated along the axis of inlet capillary to measure the current at various positions. A fraction of the ions exiting the p-FAIMS was not transmitted into the chamber, but lost on the capillary. To allow measuring that fraction, the capillary was electrically insulated from the chamber using a PEEK sleeve. The transmitted (Itr) and lost (Ilost) currents were measured by a picoammeter (model No. 6485, Keithley, Cleveland, OH) connected to the charge collector and capillary, respectively, via a BNC vacuum feed through. The current for each setup was acquired 3 times, in each case averaging 100 consecutive points within the picoammeter.
FAIMS/MS platform
Some experiments were performed using FAIMS/MS systems, where ions filtered by FAIMS enter an ion trap MS (Thermo Fisher LCQ) via a standard heated capillary or a triple quadrupole MS (Thermo Fisher TSQ Vantage) via the slit inlet of design IV, followed by tandem ion funnels. Here, no heating is necessary and the capillary was maintained at 70 °C while the slit aperture was at ambient temperature. The ESI voltage was 3.5 kV, the MS inlet was at 35 V (LCQ) and ~405 V (TSQ) to ground, and FAIMS was biased at 35 V with respect to the inlet.
Results and Discussion
The heated capillary in some ESI/MS interfaces desolvates ions generated by ESI via solvent evaporation due to heating. This process takes a finite time, and prolonging the ion residence in a capillary makes it more complete. However, the expansion of ion beams in a capillary by diffusion and Coulomb repulsion causes significant ion loss to the walls, worsening at longer residence times.34 The balance of these considerations determines the optimum ion residence time in a capillary and thus its desired length.
In FAIMS/MS, ions are desolvated at the front FAIMS interface and/or by field heating upon injection into the analytical gap.43 Therefore, a heated capillary at the MS inlet is redundant and, to avoid ion losses inside, can be replaced by a non-heated thin aperture.28 The benefits of such substitution are characterized here by obtaining Itr as a function of the charge collector position along the capillary of design IV (with five ESI emitters and slit front FAIMS interface). Moving the collector away from the aperture decreases the current, from 135 pA at the distance of 3 mm to 65 pA at 66 mm that is close to the capillary length in our benchmark28 (Figure 2a). In a regular heated capillary with the i.d. of ~0.5 mm, the loss would likely exceed the present ~50% because of greater diffusional losses in a narrower passage. So, to emulate FAIMS/MS coupling by an aperture only,28 the current in subsequent studies was measured at 3 mm distance.
The total ESI current (Itr + Ilost) with designs I – IV is consistently ~210 pA, but the transmitted portion scales roughly with the aperture area, increasing from 7% for design I to ~70% for design IV (Figure 2b). Thus, the open slit in IV captures most ions exiting present p-FAIMS, versus just ~3% for the standard circular MS inlet (which is ~40% that in design I).28 Though the pumping limitations of commercial MS systems preclude a ~1 mm2 conductance limit from the atmospheric pressure, that is possible with tandem ion funnel interfaces44 where the first funnel runs at relatively high pressure (~25 Torr).
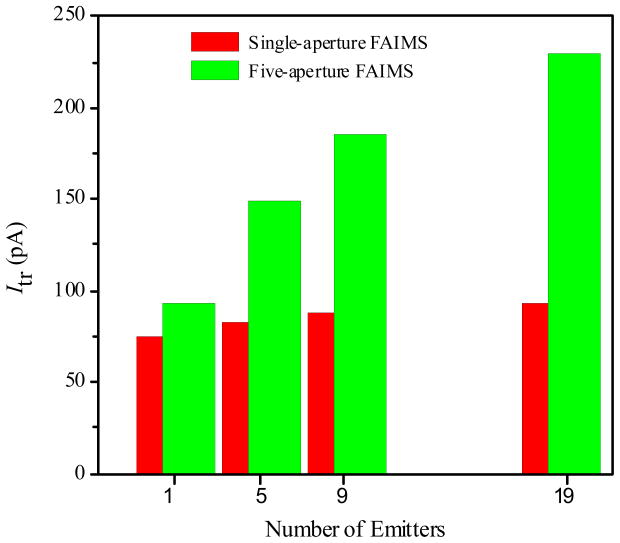
The transmitted current can be raised further by transitioning to multi-ESI sources (Figure 3). With the circular ESI/FAIMS interface, changing from 1 to 19 emitters increases Itr (for the inlet design IV) by just ~25%, from ~75 to ~93 pA. Such modest gain has been expected, as only one emitter can be close enough to the center of single aperture in the curtain plate to contribute much. Changing to a slit interface with a single emitter raises Itr by a similar amount (Figure 3): similarly, all holes except one in the 5-hole slit are too far from the emitter to make much difference. However, combining the 19-emitter array and the slit increases the transmitted current to ~230 pA, or 3 times compared to the benchmark single emitter/circular interface configuration.
Figure 3.
Transmitted ion current with the circular and slit ESI/FAIMS interface, depending on the number of ESI emitters.
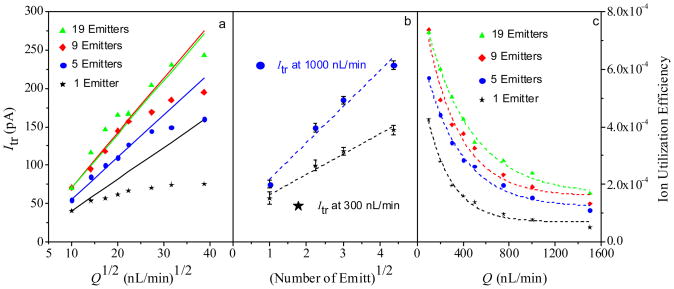
The ion current generated by ESI normally scales45 as Q1/2. With present system (adopting the design IV), the Itr values for various ESI emitter array/front FAIMS interface combinations are proportional to Q1/2 at low Itr but fall below that trend at higher currents (Figure 4a), suggesting a saturation of the FAIMS ion current capacity. This happens at Itr ~50 pA for the single emitter/circular interface but ~150 – 250 pA for the multiemitter/slit interface configurations, showing that the ion current is limited by the front (ion introduction) FAIMS interface. The raise of saturation current by 3 – 5 times upon the transition to a slit interface is consistent with the five-fold increase of aperture area. At any flow rate, Itr scales as the square root of the number of ESI emitters (Figure 4b). This behavior is a hallmark of multi-emitter ESI in the cone-jet mode,35, 46 confirming that the emitters in present arrays do not unduly obstruct each other’s operation.
Figure 4.
Transmitted ion current for different emitter/front FAIMS interface configurations as a function of the square root of the sample flow rate (a) and number of emitters (b); the ion utilization efficiency depending on the sample flow rate (c).
As the measured ESI/FAIMS spectra exhibit a sharp peak for H+reserpine, the ion current exiting FAIMS at the CV of peak apex is dominated by those species. Thus, we can estimate the ion utilization efficiency for any emitter configuration assuming that all detected current reflects reserpine ions. Typical of ESI arrangements47, 48, the ion utilization increases as the liquid flow to the ESI drops (Figure 4c). The efficiency at a given total flow increases for a larger number of ESI emitters, again demonstrating the advantage of multi-emitter ESI/FAIMS designs.
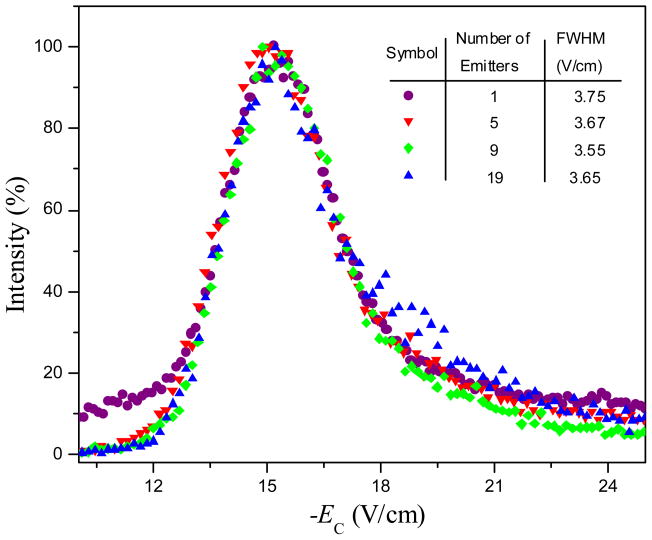
A concern is whether increase in ion current upon the use of multi-emitter ESI and/or slit front interface affects FAIMS resolution. To investigate that, we obtained FAIMS spectra over the range bracketing the reserpine ion peak for all four emitter configurations using the LCQ platform (Figure 5). The normalized spectra in all cases are identical, except for higher baseline in the single-emitter arrangement that is due to lower signal and thus lower signal/noise ratio. This is consistent with simulations showing that peaks in FAIMS do not broaden at higher ion currents.16 Hence the ESI emitter arrays and slit interfaces may be used in front of FAIMS without compromising resolution.
Figure 5.
Mass-selected FAIMS spectra for protonated reserpine (obtained at the scan speed of 1 V/min), depending on the number of emitters. The full peak width at half maximum in each case is listed.
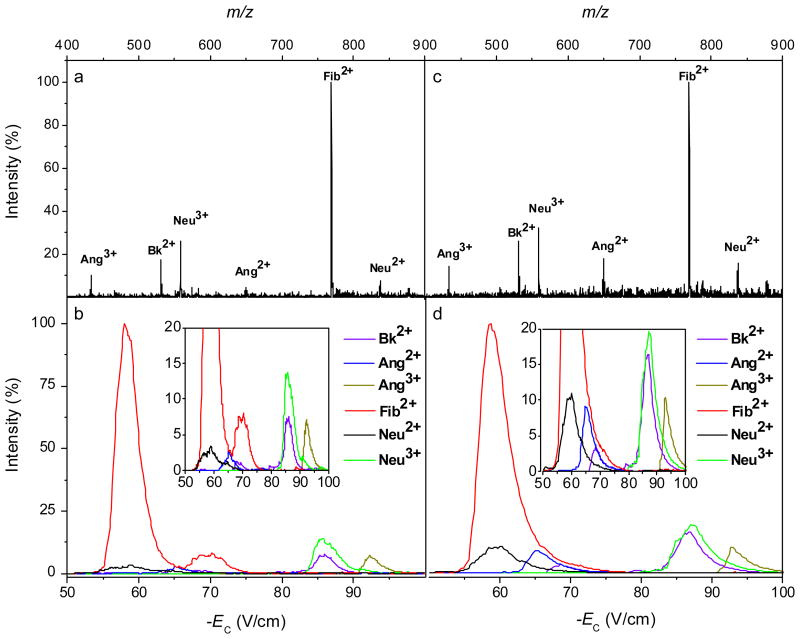
To gauge the performance of FAIMS analyzers with slit front interface at higher ESI liquid flows, we increased Q by 100-fold and analyzed peptide mixtures that were closer to real samples (using the TSQ platform). The solution of Bk (1060 Da), Ang (1296 Da), Fib (1536 Da), and Neu (1672 Da) gave off six major ions (protonated Bk2+, Ang2+ and Ang3+, Fib2+, and Neu2+ and Neu3+), Figure 6a. Four of them (Bk2+, Ang2+, Ang3+, and Neu2+) were fully resolved by FAIMS at Q = 1 μL/min, the other two “co-eluting” with some of these four (Figure 6b). The multiple features for Bk2+ and Fib2+ indicated the presence of conformers, in line with previous data28 for Bk2+. Increasing Q to 50 μL/min did not substantially affect the number or position of features in MS (Figure 6c) or FAIMS (Figure 6d) spectra, though the peaks for two Fib2+ isomers merged. The relative intensities of many features have changed, but this is common upon a 100-fold increase of ESI flow rate and is not particular to FAIMS.49 These results show the utility of slit ESI/FAIMS interface at liquid flows at least no lower than the maximum Q = 20 – 40 μL/min found in some studies40 using the single-aperture design (though others reported satisfactory performance up to 500 μL/min).7 While opening the front FAIMS aperture likely facilitates penetration of ESI solvent vapors into the gap, a lower vapor concentration at equal Q (due to vapor production spread over greater volume in multiemitter arrays) offsets that effect at least in part.
Figure 6.
MS (a, c) and mass-selected FAIMS (b, d) spectra for peptides measured at ESI liquid flow rates of 1 μL/min (a, b) and 50 μL/min (c, d).
Conclusion
We have developed a planar FAIMS design with front and back interfaces featuring slit orifices shaped as a contiguous opening or string of circular apertures. The present device can handle ribbon-shaped ion beams with widths up to 10 mm from a source to a subsequent stage, such as a MS or drift tube IMS. The slit front interface effectively captures large ion currents generated by ESI emitter arrays comprising up to 19 emitters spread over 10 mm, while a slit back interface transmits up to 70% of filtered ions to the next stage. Compared to conventional ESI/FAIMS/MS platforms with single ESI emitter and circular apertures at the FAIMS entrance and exit, the ion utilization improves by over an order of magnitude. For example, the analyte ion current delivered to the first MS stage increases from ~6 pA in previous systems to ~250 pA. This gain is achieved without degrading FAIMS resolution. The enlarged front interface does not appear to cause a problematic penetration of ESI solvent vapors into the FAIMS gap, allowing robust operation with ESI liquid flow rates up to 50 μL/min, at least. This work makes planar FAIMS, with its substantial advantages over the cylindrical geometries in terms of resolution, uniform separation power, quantification accuracy, and duty cycle, more attractive for FAIMS/MS and FAIMS/IMS/MS analyses.
Acknowledgments
We thank Dr. Jason S. Page and Bill Danielson for major help with hardware and software development, Dr. Yehia M. Ibrahim for useful comments, and the National Center for Research Resources for support (RR018522). Portions of this work were performed in the Environmental Molecular Sciences Laboratory, a DOE national scientific user facility located at PNNL. PNNL is a multiprogram national laboratory operated by Battelle for the DOE under Contract DE-AC05-76RLO 1830.
References
- 1.Buryakov IA, Krylov EV, Nazarov EG, Rasulev UK. A new method of separation of multi-atomic ions by mobility at atmospheric-pressure using a high-frequency amplitude-asymmetric strong electric-field. Int J Mass Spectrom Ion Process. 1993;128:143–148. [Google Scholar]
- 2.Guevremont R, Purves RW. Atmospheric pressure ion focusing in a high-field asymmetric waveform ion mobility spectrometer. Rev Sci Instrum. 1999;70:1370–1383. [Google Scholar]
- 3.Guevremont R, Purves RW, Barnett DA, Ding LY. Ion trapping at atmospheric pressure (760 Torr) and room temperature with a high-field asymmetric waveform ion mobility spectrometer. Int J Mass Spectrom. 1999;193:45–56. [Google Scholar]
- 4.Guevremont R, Ding LY, Ells B, Barnett DA, Purves RW. Atmospheric pressure ion trapping in a tandem FAIMS-FAIMS coupled to a TOFMS: Studies with electrospray generated gramicidin S ions. J Am Soc Mass Spectrom. 2001;12:1320–1330. doi: 10.1016/S1044-0305(01)00321-X. [DOI] [PubMed] [Google Scholar]
- 5.Guevremont R. High-field asymmetric waveform ion mobility spectrometry: A new tool for mass spectrometry. Journal of Chromatography A. 2004;1058:3–19. [PubMed] [Google Scholar]
- 6.Guevremont R, Makowski B. Using FAIMS to increase selectivity for LC-MS analyses. Am Lab. 2005;37:11. [Google Scholar]
- 7.Wu ST, Xia YQ, Jemal M. High-field asymmetric waveform ion mobility spectrometry coupled with liquid chromatography/electrospray ionization tandem mass spectrometry (LC/ESI-FAIMS-MS/MS) multi-component bioanalytical method development, performance evaluation and demonstration of the constancy of the compensation voltage with change of mobile phase composition or flow rate. Rapid Commun Mass Spectrom. 2007;21:3667–3676. doi: 10.1002/rcm.3264. [DOI] [PubMed] [Google Scholar]
- 8.Canterbury JD, Yi XH, Hoopmann MR, MacCoss MJ. Assessing the dynamic range and peak capacity of nanoflow LC-FAIMS-MS on an ion trap mass spectrometer for proteomics. Anal Chem. 2008;80:6888–6897. doi: 10.1021/ac8004988. [DOI] [PMC free article] [PubMed] [Google Scholar]
- 9.Venne K, Bonneil E, Eng K, Thibault P. Improvement in peptide detection for proteomics analyses using nanoLC-MS and high-field asymmetry waveform ion mobility mass spectrometry. Anal Chem. 2005;77:2176–2186. doi: 10.1021/ac048410j. [DOI] [PubMed] [Google Scholar]
- 10.Tang KQ, Li FM, Shvartsburg AA, Strittmatter EF, Smith RD. Two-dimensional gas-phase separations coupled to mass Spectrometry for analysis of complex mixtures. Anal Chem. 2005;77:6381–6388. doi: 10.1021/ac050871x. [DOI] [PMC free article] [PubMed] [Google Scholar]
- 11.Robinson EW, Garcia DE, Leib RD, Williams ER. Enhanced mixture analysis of poly(ethylene glycol) using high-field asymmetric waveform ion mobility spectrometry combined with Fourier transform ion cyclotron resonance mass spectrometry. Anal Chem. 2006;78:2190–2198. doi: 10.1021/ac051709x. [DOI] [PMC free article] [PubMed] [Google Scholar]
- 12.Sultan J, Gabryelski W. Structural identification of highly polar nontarget contaminants in drinking water by ESI-FAIMS-Q-TOF-MS. Anal Chem. 2006;78:2905–2917. doi: 10.1021/ac060384x. [DOI] [PubMed] [Google Scholar]
- 13.Robinson EW, Williams ER. Multidimensional separations of ubiquitin conformers in the gas phase: Relating ion cross sections to H/D exchange measurements. J Am Soc Mass Spectrom. 2005;16:1427–1437. doi: 10.1016/j.jasms.2005.04.007. [DOI] [PMC free article] [PubMed] [Google Scholar]
- 14.Purves RW, Guevremont R, Day S, Pipich CW, Matyjaszczyk MS. Mass spectrometric characterization of a high-field asymmetric waveform ion mobility spectrometer. Rev Sci Instrum. 1998;69:4094–4105. [Google Scholar]
- 15.Shvartsburg AA, Tang K, Smith RD. Optimization of the design and operation of FAIMS analyzers. J Am Soc Mass Spectrom. 2005;16:2–12. doi: 10.1016/j.jasms.2004.09.009. [DOI] [PubMed] [Google Scholar]
- 16.Shvartsburg AA, Tang KQ, Smith RD. Modeling the resolution and sensitivity of FAIMS analyses. J Am Soc Mass Spectrom. 2004;15:1487–1498. doi: 10.1016/j.jasms.2004.06.018. [DOI] [PubMed] [Google Scholar]
- 17.Shvartsburg AA, Tang KQ, Smith RD. FAIMS operation for realistic gas flow profile and asymmetric waveforms including electronic noise and ripple. J Am Soc Mass Spectrom. 2005;16:1447–1455. doi: 10.1016/j.jasms.2005.04.003. [DOI] [PubMed] [Google Scholar]
- 18.Mason EA, McDaniel EW. Transport Properties of Ions in Gases. Wiley; New York: 1988. [Google Scholar]
- 19.Kapron JT, Jemal M, Duncan G, Kolakowski B, Purves R. Removal of metabolite interference during liquid chromatography/tandem mass spectrometry using high-field asymmetric waveform ion mobility spectrometry. Rapid Commun Mass Spectrom. 2005;19:1979–1983. [Google Scholar]
- 20.Ells B, Froese K, Hrudey SE, Purves RW, Guevremont R, Barnett DA. Detection of microcystins using electrospray ionization high-field asymmetric waveform ion mobility mass spectrometry/mass spectrometry. Rapid Commun Mass Spectrom. 2000;14:1538–1542. doi: 10.1002/1097-0231(20000830)14:16<1538::AID-RCM61>3.0.CO;2-I. [DOI] [PubMed] [Google Scholar]
- 21.Kolakowski BM, Mester Z. Review of applications of high-field asymmetric waveform ion mobility spectrometry (FAIMS) and differential mobility spectrometry (DMS) Analyst. 2007;132:842–864. doi: 10.1039/b706039d. [DOI] [PubMed] [Google Scholar]
- 22.Xia YQ, Wu ST, Jemal M. LC-FAIMS-MS/MS for quantification of a peptide in plasma and evaluation of FAIMS global selectivity from plasma components. Anal Chem. 2008;80:7137–7143. doi: 10.1021/ac8010846. [DOI] [PubMed] [Google Scholar]
- 23.Hatsis P, Kapron JT. A review on the application of high-field asymmetric waveform ion mobility spectrometry (FAIMS) in drug discovery. Rapid Commun Mass Spectrom. 2008;22:735–738. doi: 10.1002/rcm.3416. [DOI] [PubMed] [Google Scholar]
- 24.O’Donnell RM, Sun XB, Harrington PD. Pharmaceutical applications of ion mobility spectrometry. Trac-Trends in Analytical Chemistry. 2008;27:44–53. [Google Scholar]
- 25.Purves RW, Barnett DA, Guevremont R. Separation of protein conformers using electrospray-high field asymmetric waveform ion mobility spectrometry-mass spectrometry. Int J Mass Spectrom. 2000;197:163–177. [Google Scholar]
- 26.Guevremont R, Purves R. Comparison of experimental and calculated peak shapes for three cylindrical geometry FAIMS prototypes of differing electrode diameters. J Am Soc Mass Spectrom. 2005;16:349–362. doi: 10.1016/j.jasms.2004.11.013. [DOI] [PubMed] [Google Scholar]
- 27.Barnett DA, Belford M, Dunyach JJ, Purves RW. Characterization of a temperature-controlled FAIMS system. J Am Soc Mass Spectrom. 2007;18:1653–1663. doi: 10.1016/j.jasms.2007.06.009. [DOI] [PubMed] [Google Scholar]
- 28.Shvartsburg AA, Li FM, Tang KQ, Smith RD. High-resolution field asymmetric waveform ion mobility spectrometry using new planar geometry analyzers. Anal Chem. 2006;78:3706–3714. doi: 10.1021/ac052020v. [DOI] [PMC free article] [PubMed] [Google Scholar]
- 29.Eiceman GA, Tadjikov B, Krylov E, Nazarov EG, Miller RA, Westbrook J, Funk P. Miniature radio-frequency mobility analyzer as a gas chromatographic detector for oxygen-containing volatile organic compounds, pheromones and other insect attractants. Journal of Chromatography A. 2001;917:205–217. doi: 10.1016/s0021-9673(01)00656-2. [DOI] [PubMed] [Google Scholar]
- 30.Miller RA, Eiceman GA, Nazarov EG, King AT. A novel micromachined high-field asymmetric waveform-ion mobility spectrometer. Sensors and Actuators B-Chemical. 2000;67:300–306. [Google Scholar]
- 31.Kendler S, Lambertus GR, Dunietz BD, Coy SL, Nazarov EG, Miller RA, Sacks RD. Fragmentation pathways and mechanisms of aromatic compounds in atmospheric pressure studied by GC-DMS and DMS-MS. Int J Mass Spectrom. 2007;263:137–147. [Google Scholar]
- 32.Eiceman GA, Nazarov EG, Miller RA, Krylov EV, Zapata AM. Micro-machined planar field asymmetric ion mobility spectrometer as a gas chromatographic detector. Analyst. 2002;127:466–471. doi: 10.1039/b111547m. [DOI] [PubMed] [Google Scholar]
- 33.Shaffer SA, Prior DC, Anderson GA, Udseth HR, Smith RD. An ion funnel interface for improved ion focusing and sensitivity using electrospray ionization mass spectrometry. Anal Chem. 1998;70:4111–4119. doi: 10.1021/ac9802170. [DOI] [PubMed] [Google Scholar]
- 34.Page JS, Kelly RT, Tang K, Smith RD. Ionization and transmission efficiency in an electrospray ionization-mass spectrometry interface. J Am Soc Mass Spectrom. 2007;18:1582–1590. doi: 10.1016/j.jasms.2007.05.018. [DOI] [PubMed] [Google Scholar]
- 35.Tang KQ, Lin YH, Matson DW, Kim T, Smith RD. Generation of multiple electrosprays using microfabricated emitter arrays for improved mass spectrometric sensitivity. Anal Chem. 2001;73:1658–1663. doi: 10.1021/ac001191r. [DOI] [PubMed] [Google Scholar]
- 36.Kelly RT, Page JS, Tang KQ, Smith RD. Array of chemically etched fused-silica emitters for improving the sensitivity and quantitation of electrospray ionization mass spectrometry. Anal Chem. 2007;79:4192–4198. doi: 10.1021/ac062417e. [DOI] [PubMed] [Google Scholar]
- 37.Kelly RT, Page JS, Marginean I, Tang KQ, Smith RD. Nanoelectrospray emitter arrays providing interemitter electric field uniformity. Anal Chem. 2008;80:5660–5665. doi: 10.1021/ac800508q. [DOI] [PMC free article] [PubMed] [Google Scholar]
- 38.Kelly RT, Page JS, Zhao R, Qian WJ, Mottaz HM, Tang K, Smith RD. Capillary-based multi nanoelectrospray emitters: Improvements in ion transmission efficiency and implementation with capillary reversed-phase LC-ESI-MS. Anal Chem. 2008;80:143–149. doi: 10.1021/ac701647s. [DOI] [PMC free article] [PubMed] [Google Scholar]
- 39.Kim T, Tang KQ, Udseth HR, Smith RD. A multicapillary inlet jet disruption electrodynamic ion funnel interface for improved sensitivity using atmospheric pressure ion sources. Anal Chem. 2001;73:4162–4170. doi: 10.1021/ac010174e. [DOI] [PubMed] [Google Scholar]
- 40.Kolakowski BM, McCooeye MA, Mester Z. Compensation voltage shifting in high-field asymmetric waveform ion mobility spectrometry-mass spectrometry. Rapid Commun Mass Spectrom. 2006;20:3319–3329. doi: 10.1002/rcm.2739. [DOI] [PubMed] [Google Scholar]
- 41.Deng WW, Klemic JF, Li XH, Reed MA, Gomez A. Increase of electrospray throughput using multiplexed microfabricated sources for the scalable generation of monodisperse droplets. J Aerosol Sci. 2006;37:696–714. [Google Scholar]
- 42.Kelly RT, Page JS, Luo QZ, Moore RJ, Orton DJ, Tang KQ, Smith RD. Chemically etched open tubular and monolithic emitters for nanoelectrospray ionization mass spectrometry. Anal Chem. 2006;78:7796–7801. doi: 10.1021/ac061133r. [DOI] [PMC free article] [PubMed] [Google Scholar]
- 43.Shvartsburg AA, Li FM, Tang KQ, Smith RD. Distortion of ion structures by field asymmetric waveform ion mobility spectrometry. Anal Chem. 2007;79:1523–1528. doi: 10.1021/ac061306c. [DOI] [PubMed] [Google Scholar]
- 44.Ibrahim Y, Tang KQ, Tolmachev AV, Shvartsburg AA, Smith RD. Improving mass spectrometer sensitivity using a high-pressure electrodynamic ion funnel interface. J Am Soc Mass Spectrom. 2006;17:1299–1305. doi: 10.1016/j.jasms.2006.06.005. [DOI] [PMC free article] [PubMed] [Google Scholar]
- 45.Delamora JF, Loscertales IG. The current emitted by highly conducting Taylor cones. Journal of Fluid Mechanics. 1994;260:155–184. [Google Scholar]
- 46.Bocanegra R, Galan D, Marquez M, Loscertales IG, Barrero A. Multiple electrosprays emitted from an array of holes. J Aerosol Sci. 2005;36:1387–1399. [Google Scholar]
- 47.Wilm M, Mann M. Analytical properties of the nanoelectrospray ion source. Anal Chem. 1996;68:1–8. doi: 10.1021/ac9509519. [DOI] [PubMed] [Google Scholar]
- 48.Marginean I, Kelly RT, Prior DC, LaMarche BL, Tang K, Smith RD. Analytical characterization of the electrospray ion source in the nanoflow regime. Anal Chem. 2008;80:6573–6579. doi: 10.1021/ac800683s. [DOI] [PMC free article] [PubMed] [Google Scholar]
- 49.Tang KQ, Page JS, Smith RD. Charge competition and the linear dynamic range of detection in electrospray ionization mass spectrometry. J Am Soc Mass Spectrom. 2004;15:1416–1423. doi: 10.1016/j.jasms.2004.04.034. [DOI] [PMC free article] [PubMed] [Google Scholar]


