Abstract
We introduce a method for optical characterization of hollow-core optical waveguides. Radiation pressure exerted by the waveguide modes on dielectric microspheres is used to analyze salient properties such as propagation loss and waveguide mode profiles. These quantities were measured for quasi-single-mode and multimode propagation in on-chip liquid-filled hollow-core antiresonant reflecting optical waveguides. Excellent agreement with analytical and numerical models is found, demonstrating that optically induced particle transport provides a simple, inexpensive, and nondestructive alternative to other characterization methods.
Hollow-core waveguides have become increasingly important in many applications [1–4]. Optofluidic waveguides [5] are of particular interest as they promise device miniaturization, optical component integration, and low fabrication costs. As for all waveguides, the propagation loss and the mode profile play critically important roles in their operation. Many techniques have been used to characterize the loss or mode profile of a waveguide, and among these the cutback [6] and optical time-domain reflectometry methods [7] have been used to characterize hollow-core loss [8]. These methods are either destructive or require sophisticated setups and relatively long sample lengths (greater than a few millimeters) due to cleaving or detector bandwidth limits. Most optofluidic devices will rely on hollow–solid waveguide interfaces to confine the sample liquids while providing optical access. In this case, direct access to the hollow-core mode is limited. Thus, as hollow-core waveguide devices continue to decrease in size and increase in component complexity, it becomes necessary to characterize these devices with more accurate and accessible means. Optically induced motion of particles in hollow-core waveguides provides a solution. Radiation pressure has been used extensively for over three decades for trapping and manipulation of particles and atoms [9] with applications such as optical tweezers [10] and optical transport of particles through hollow-core waveguides [11,12]. In this work, we introduce and experimentally demonstrate a simple, inexpensive, and nondestructive method for characterization of liquid- and hollow-core waveguides, both stand-alone and integrated within miniaturized device structures. Optically induced motion of dielectric particles is used to measure waveguide properties such as propagation loss and mode profiles using integrated liquid-filled hollow-core antiresonant reflecting optical waveguides (ARROWs).
The forces involved in optically induced particle motion through a hollow-core waveguide are the scattering Fs, drag FStokes, and gradient Fg forces. The optical forces arise from the photon momentum transfer as the beam in the waveguide interacts with the particles. The scattering force, in the direction of light propagation z, in a waveguide with loss coefficient αWG can be expressed as [9]
| (1) |
with Q a dimensionless factor describing the efficiency of photon momentum transfer, medium refractive index n, vacuum speed of light c, and initial incident power P0. Additional axial gradient and pressure-induced forces can be neglected for typical experimental conditions. For steady-state particle motion in a liquid-core waveguide, the Stokes–Navier viscous drag force in the z direction must be balanced by the axial scattering force or,
| (2) |
where r is the particle radius and η′ is an average dynamic viscosity that takes into account the increase of the viscosity near the waveguide walls using Faxen’s law [13]. The equation of motion in Eq. (2) can be solved with Eq. (1) for the particle trajectory to give
| (3) |
where v0=QP0n/(6πη′rc) and z0 are the initial particle velocity and axial position, respectively, when optically induced transport begins. Thus, z(t) can be used to extract αWG and v0 by Eq. (3).
Another important parameter of waveguide operation is the lateral intensity distribution I(x), which results from the excitation and interference of different guided modes. The particle tends to move toward intensity maxima owing to the gradient force Fg, providing a mode profile probe. The potential associated with this force governs the motion of the diffusing particle. Using Boltzmann statistics at thermal equilibrium, the probability density p(x) of the particle location, within potential U(x), is related to the lateral gradient force by [14]
| (4) |
with Boltzmann constant k, absolute temperature T, permittivity ε, effective particle polarizability γ, and incident light intensity I. Therefore, the particle distribution p(x) is explicitly related to the mode profile I(x) by Eq. (4).
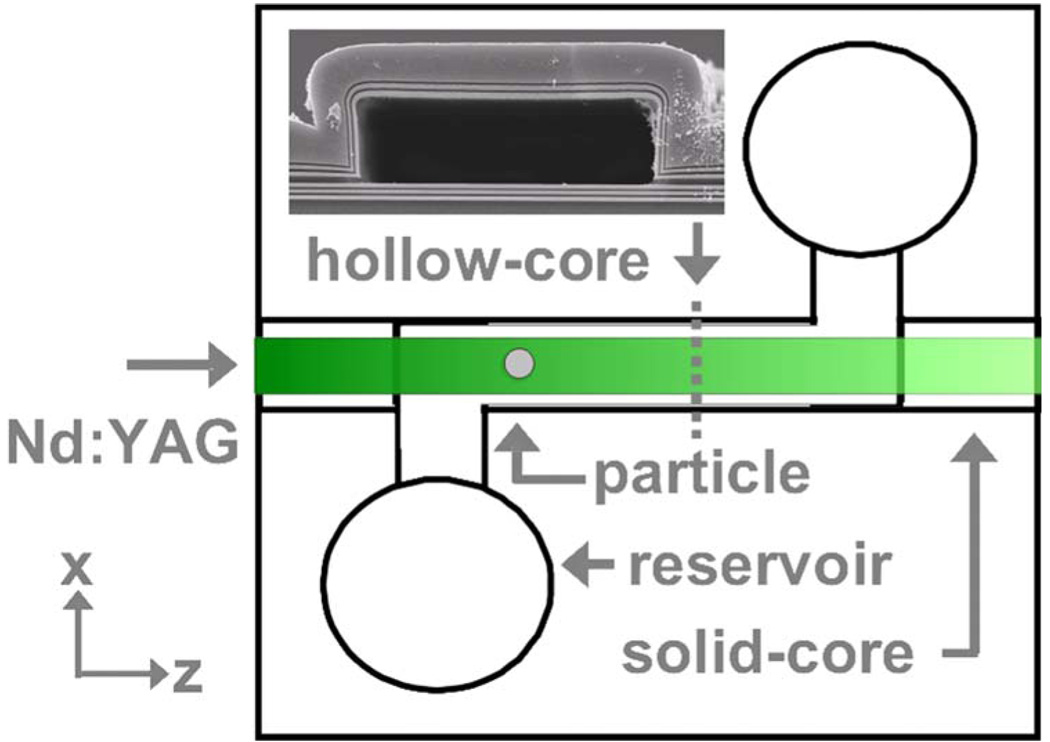
To demonstrate this characterization method, αWG and I(x) are determined for liquid-filled hollow-core ARROW waveguides. Hollow-core ARROWs consist of high-index dielectric layers, whose thicknesses are chosen to satisfy optical guidance [5] in an enclosed low-index hollow core (Fig. 1 inset). Samples are constructed using standard silicon microfabrication techniques of plasma-enhanced chemical vapor deposition and a sacrificial core process [15]. The waveguides characterized here consisted of liquid-core ARROWs connected with solid-core ARROWs (Fig. 1) to form optofluidic devices for single particle analysis [5]. Two types of liquid-core ARROWs were tested. Type S (quasi-single-mode) had liquid-core dimensions of 5 µm high by 12 µm wide and solid-core waveguide dimensions of 5 µm high by 22 µm wide—defined by a 5 µm high pedestal by adding a pre-etch fabrication step [15]. Type M (multimode) had the same dimensions but with different solid-core rib waveguide dimensions of 3 µm high by 6 µm wide—defined with 1 µm etch depths. Reservoirs of 10 µL were attached to the chip surface (Fig. 1) and filled with a solution of ultrapure water (n=1.33), Triton X [16], and 1 µm diameter polystyrene spheres (n=1.59 index, Duke Scientific) with a concentration of 0.4 particles/nL, corresponding to less than one particle in the waveguide volume. Frequency doubled Nd:YAG laser light (532 nm) was coupled into a single-mode fiber and aligned to the input solid core of the ARROW device. Particle motion was observed through a microscope setup from above (0.45 NA 50X objective) with a 540 nm long-pass filter and imaged onto a charge-coupled device camera. Images of the particle trajectory were recorded with a temporal resolution of 50 ms and a localization accuracy of less than 200 nm. The images were calibrated, and the particle trajectory was determined through a particle finding algorithm. The entire coupling setup was mounted on a translation stage and moved in the image plane for particle tracking. Prior to laser light irradiation, a single particle was introduced into the optical volume of the waveguide using pressure induced flow. The pressure was then balanced until there was negligible drift. After particle passage, the waveguide was inspected to ensure only one particle was involved.
Figure 1.
(Color online) Hollow-core waveguide device and ARROW cross section along dotted line (inset).
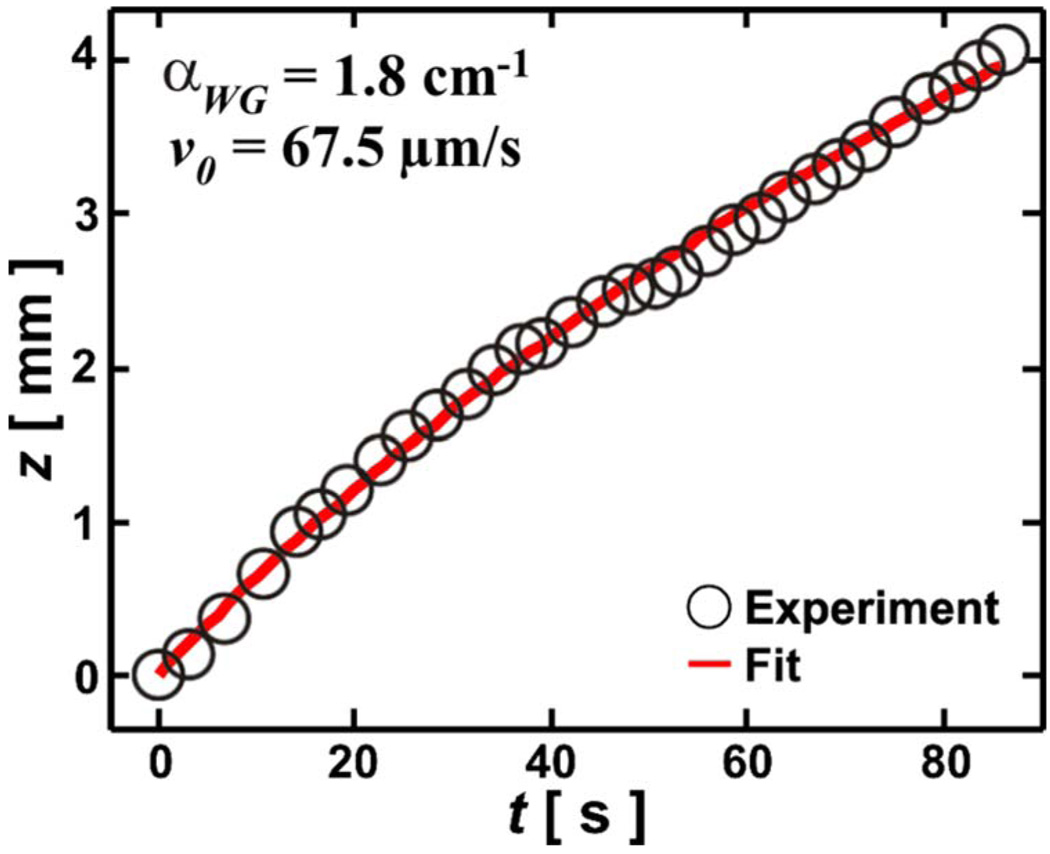
The loss of a liquid-core ARROW waveguide can be extracted by observing z(t) as shown by Eq. (3). In Fig. 2 (P0 ≈ 12 mW), z(t) is graphed for a type-M waveguide (note only 30 out of 1687 points are shown for clarity). Least-squares fitting of the parameters v0 and αWG, using Eq. (3) shows excellent agreement (Fig. 2, curve). The measurement was carried out seven times on one sample, using the same alignment. From the seven measured trajectories, a propagation loss of αWG=1.8±0.2 cm−1 was extracted, which agrees with the loss of 1.7 cm−1 calculated with a 2 X 2 matrix formalism [5] for operation away from the design wavelength of 633 nm. This accuracy is better than that of other methods for similar sample lengths. The slight oscillation around the fitted curve in Fig. 2 is caused by the deviation of the particle from the waveguide center in the transverse directions. These deviations result in a varying Q in v0 [Eq. (3)]. As long as P(z) does not change drastically during one period or the deviation amplitude is not large, an average Q can be used. Similarly, type-S waveguides were measured yielding excellent fitted curves and losses consistent with 2 X 2 matrix formalism calculations.
Figure 2.
(Color online) Type-M waveguide particle axial trajectory (circles) and fitted curve (curve).
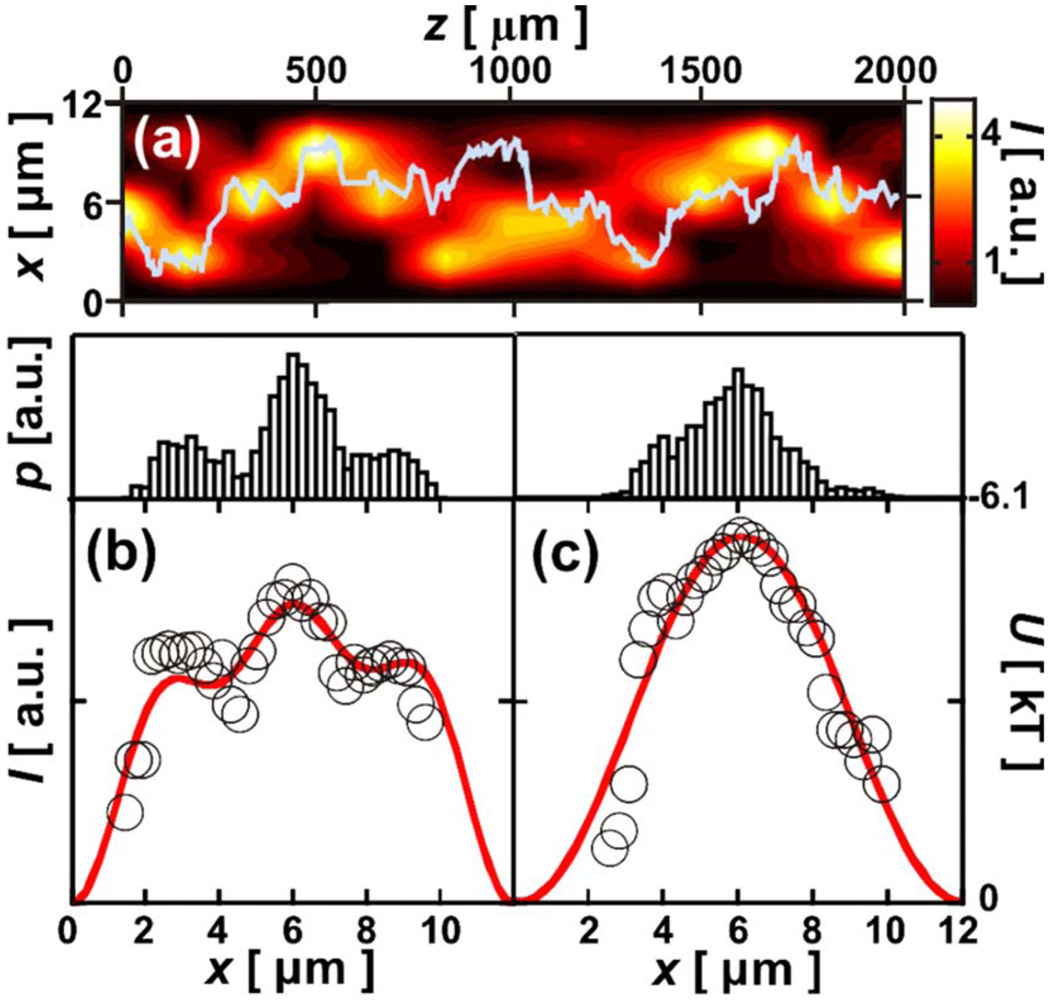
To obtain the mode profile from the particle trajectory x(t), the particle lateral position histogram is constructed. The gray curve in Fig. 3(a) shows the particle trajectory as it travels through a type-M waveguide. A lateral position histogram can be extracted from this curve and is shown as an inset in Fig. 3(b) (Δx=0.25 µm binning width). In the type-M waveguide, several waveguide modes are excited, which subsequently interfere to yield a beating intensity pattern. If the waveguide is long enough, a single particle trajectory contains enough sampling points for reconstruction of the lateral mode profile. Figure 3(b) shows good agreement of the deduced intensity (circles) using Eq. (4) and the mode profile (curve), calculated using a commercial mode solver (Photon Design). This curve is the axial average over the intensity profile coupled into the first three modes of the liquid core with (fitted) efficiencies of 46%, 27%, and 27%. When averaged over a sufficient distance, the mode profile shows three peaks. A comparison of the particle trajectory with the calculated two-dimensional intensity profile I(x,z) [Fig. 3(a)] shows that the particle tends to move within the high-intensity regions of the beat pattern and good agreement between experiment and computation is found. A deviation from this rule can be observed at z=0.8 mm where the particle is temporarily caught in a local intensity maximum but then returns to the global maximum of I(x). Figure 3(b) also shows the depth of the horizontal gradient force potential of 4.8 kT, corresponding to a trap depth sufficient to concentrate the particle near intensity maxima (note the y-direction potential is even deeper owing to the physically thinner dimension).
Figure 3.
(Color online) (a) Type-M calculated intensity distribution and measured particle trajectory (curve); (b) type-M averaged intensity–potential (circles), particle x histogram (inset), and mode superposition (line); (c) type-S extracted intensity–potential (circles), particle x histogram (inset), and simulated fundamental mode (curve).
Single-mode (type-S) hollow-core waveguide profiles were also measured using the radiation pressure method. Figure 3(c) shows the corresponding particle histogram and extracted mode profile (circles), showing excellent agreement with the simulation (curve) assuming single-mode coupling. The calculated I(x,z) and measured trajectory for the type-S waveguides was also compared (not shown) yielding good agreement as implied by Fig. 3(c).
The radiation pressure method for hollow-core waveguide characterization can be used on very short sample lengths, is nondestructive, relatively inexpensive, and does not require contaminating the waveguide. Simple cleaning steps can be taken to remove residual particles from the core. Compared to other hollow-core loss measurement methods, the radiation pressure method is more accurate for short sample lengths. The ability to extract the mode profile is very useful, for example, for directly measuring excitation volumes and determining the distribution of light into the waveguide modes, thereby providing valuable feedback for waveguide design. Despite the good agreement with multimode ARROW waveguides, the radiation pressure method is best suited for single-mode waveguides. The frequency of particle wall adhesion increases with the number of excited modes, which prevents reliable loss measurements. Measurements with lateral histograms exhibiting this effect were excluded from the analysis.
In summary, we have introduced and experimentally demonstrated a simple, inexpensive, and nondestructive method for hollow-core characterization using radiation pressure induced transport of dielectric particles applicable to liquid- and hollow-core waveguides.
Acknowledgments
The authors gratefully acknowledge the financial support of the National Science Foundation under grant ECS-0528730 and the National Institutes of Health–National Institute of Biomedical Imaging and BioEngineering (NIBIB) under grant 5-RO1-EB006097.
Footnotes
OCIS codes: 130.3120, 230.7390, 350.4855.
References
- 1.Verdaasdonk RM, van Swol CFP. Phys. Med. Biol. 1997;42:869. doi: 10.1088/0031-9155/42/5/010. [DOI] [PubMed] [Google Scholar]
- 2.Yang W, Conkey DB, Wu B, Yin D, Hawkins AR, Schmidt H. Nat. Photonics. 2007;1:331. [Google Scholar]
- 3.Temelkuran B, Hart SD, Benoit G, Joannopoulos JD, Fink Y. Nature. 2002;420:650. doi: 10.1038/nature01275. [DOI] [PubMed] [Google Scholar]
- 4.Bernini R, Campopiano S, de Boer C, Sarro PM, Zeni L. IEEE Sens. J. 2003;3:652. [Google Scholar]
- 5.Schmidt H, Hawkins AR. Microfluid. Nanofluid. 2008;4:3. doi: 10.1007/s10404-007-0199-7. [DOI] [PMC free article] [PubMed] [Google Scholar]
- 6.Hunsperger RG. Integrated Optics—Theory and Technology. 5th ed. Springer; 2002. [Google Scholar]
- 7.Barnoski MK, Jensen SM. Appl. Opt. 1976;15:2112. doi: 10.1364/AO.15.002112. [DOI] [PubMed] [Google Scholar]
- 8.Hansen TP, Broeng J, Jakobsen C, Vienne G, Simonsen HR, Nielsen MD, Skovgaard PMW, Folkenberg JR, Bjarklev A. J. Lightwave Technol. 2004;22:11. [Google Scholar]
- 9.Ashkin A. Phys. Rev. Lett. 1970;24:156. [Google Scholar]
- 10.Neuman KC, Block S. Rev. Sci. Instrum. 2004;75:2787. doi: 10.1063/1.1785844. [DOI] [PMC free article] [PubMed] [Google Scholar]
- 11.Renn MJ, Pastel R, Lewandowski HJ. Phys. Rev. Lett. 1999;82:1574. [Google Scholar]
- 12.Mandal S, Erickson D. Appl. Phys. Lett. 2007;90:184103. [Google Scholar]
- 13.Happel J, Brenner H. Low Reynolds Number Hydrodynamics, with Special Applications to Particulate Media. Prentice-Hall; 1965. [Google Scholar]
- 14.Florin E-L, Pralle A, Stelzer EHK, Hörber JKH. Appl. Phys. A. 1998;66:S75. [Google Scholar]
- 15.Hawkins AR, Schmidt H. Microfluid. Nanofluid. 2008;4:17. doi: 10.1007/s10404-007-0194-z. [DOI] [PMC free article] [PubMed] [Google Scholar]
- 16.C14H22O(C2H4O)n nonionic surfactant (trace amounts used.


