Abstract
Experienced users of the Clarion cochlear implant were tested acutely with the HiResolution (HiRes) and HiRes Fidelity120 (F120) processing strategies. Three psychophysically-based tests were used including spectral-ripple discrimination, Schroeder-phase discrimination and temporal modulation detection. Three clinical outcome measures were used including consonant-nucleus-consonant (CNC) word recognition in quiet, word recognition in noise and the clinical assessment of music perception (CAMP). Listener's spectral-ripple discrimination ability improved with F120, but Schroeder-phase discrimination was worse with F120 than with HiRes. Listeners who had better than average acuity showed the biggest effects. There were no significant effects of the processing strategy on any of the clinical abilities nor on temporal modulation detection. Additionally, the listeners' day-to-day clinical strategy did not appear to influence the result suggesting that experience with the strategies did not play a significant role. The results underscore the value of acoustic psychophysical measures through the sound processor as a tool in clinical research, because these measures are more sensitive to changes in the processing strategies than traditional clinical measures, e.g. speech understanding. The measures allow for the evaluation of sensitivity to specific acoustic attributes revealing the extent to which different processing strategies affect these basic abilities and could thus improve the efficiency of the development of processing strategies.
1. Introduction
In cochlear implant listeners, the ability to hear changes in an acoustic spectral ripple has been shown to be a good predictor of speech understanding (Henry et al., 2003; Henry et al., 2005a; Won et al., 2007). Thus, it is possible that improving spectral ripple discrimination ability would improve clinical abilities with cochlear implants. One approach to address this uses current steering (Litvak et al., 2003). In traditional cochlear implant sound processing, the theoretical maximum number of independent points of excitation available to the implantee is equal to the number of active electrodes. The effective number of independent channels is also limited by channel interactions. Current steering employs simultaneous stimulation of electrodes in which the current on neighboring electrodes is adjusted or “steered” to generate pitch percepts between electrodes known as “virtual channels” (Wilson et al., 1993; Wilson et al., 2006). Current steering has been shown to generate many more pitch percepts than the number of electrodes on the array (Firszt et al., 2007; Koch et al., 2007), although there was a large range of individual differences. Estimates for the number of possible pitch percepts averaged 63 with a range of 8 to 451.
If the processor provided improved spectral detail to the listeners, it might be expected that speech and music perception abilities would improve. Speech understanding is closely related to spectral-ripple discrimination ability, and it would be expected that more pitch percepts would yield better musical pitch discrimination. However, initial results from clinical studies have not demonstrated any significant improvement in speech understanding (Brendel et al., 2008; Buechner et al., 2008). The more specific question of whether current steering improves spectral ripple discrimination ability has not yet been addressed. Spectral ripple discrimination ability has been shown to relate to the sharpness of psychophysical tuning curves in cochlear implant listeners, suggesting that it provides a measure of spectral resolving power (Anderson et al., 2009).
The present study employs two processing strategies administered acutely: HiResolution (HiRes) and the Fidelity HiResolution 120 (F120). HiRes uses a traditional processing approach in which channel-specific temporal envelopes are extracted and delivered with interleaved, high-rate pulse trains. HiRes operates in real time in which the temporal envelope is updated at the pulse rate, usually about 2000 Hz. F120 utilizes a Fast Fourier Transform (FFT) with a 14.7 ms time window and recalculates the FFT in real time every 1.1 ms. Thus, it takes a “look” at the spectrum every 1.1 ms (Nogueira et al., 2009). It operates as a sliding window which can act as a low-pass filter, smearing the temporal envelopes. The frequency limit of temporal envelope information that is transmitted in a given channel depends on the window size, the repetition rate and the number of FFT bins. F120 uses the output of the FFT bins to estimate peaks in each channel, adjusting the current levels on pairs of electrodes up and down in order to find the best place for the peak. This ongoing adjustment to current on individual electrodes generates an ongoing fluctuation in level that is unrelated to the input temporal envelopes, but driven by spectral changes. The smearing, and fluctuations affect temporal modulation and could influence clinical outcome, because the ability to perceive temporal modulation has been shown to be important for speech understanding (Fu, 2002). The perception of fine-timing cues has been investigated in CI users with Schroeder-phase discrimination (Drennan et al., 2008), and it has been shown to be predictive of speech understanding ability independent of spectral-ripple discrimination. Through a speech processor, Schroeder-phase stimuli provide envelopes cues in which temporal envelope peaks either move quickly up or down in frequency, moving rapidly across the electrode array. Such cues might be reduced in F120.
Using F120 and HiRes, listeners were tested with three psychophysical tasks evaluating spectral-ripple discrimination ability, Schroeder-phase discrimination ability and modulation detection and with three clinical tests evaluating speech perception in quiet and in noise, and music perception skills. This experiment tests two hypotheses: 1) Current steering applied in a sound processor using F120 improves spectral ripple discrimination ability, and 2) Psychophysical measures of cochlear implant hearing abilities are more sensitive to processor changes than traditional speech or music outcome measures.
2. Methods
2.1. Listeners and Fitting
Ten experienced Advanced Bionics cochlear implant users participated in this study. All users had at least 12 months' experience with cochlear implants. Their ages range from 25 to 78 with 4 females and 6 males. Information about the specific listeners and their maps is shown in Table 1. F120 uses two electrodes simultaneously to form one channel. The reported pulse rate on one F120 channel is 2 times that of each pulse on a single electrode reported with HiRes. Listeners used either HiRes or F120 clinically. An experienced cochlear implant audiologist fit the listeners acutely with the processing strategy that they did not regularly use, thus they had no experience with the new strategy. HiRes users were fit with F120 and F120 users were fit with HiRes. All listeners were tested with both strategies using a laboratory-owned, body worn PSP processor. Two listeners were part of a clinical study using an experimental strategy called conditioned CIS or “CCIS”. This is an 8-channel CIS strategy with a low, constant-level biphasic pulse train near the threshold continuously running on every other electrode. These two listeners (L34 and L48) were previous users of HiRes and had used HiRes for 13 and 7 months respectively prior to being switched to CCIS. They were tested with their original HiRes maps with minor, global adjustment made for comfort levels.
Table 1.
Table shows listener and the parameters for their experimental maps. “S” and “P” indicated sequential or paired stimulation. Sequential stimulation sweeps all electrodes at the pulse rate; paired stimulation sweeps with one apical location and one basal location active at one time. “Rate” is the pulse rate. “PW” is the pulse width, and “IDR” is input dynamic range.
| Listener | Clinical Strategy | Age | Sex | Years implanted | HiRes Setting | F120 Setting | ||||||
|---|---|---|---|---|---|---|---|---|---|---|---|---|
| S/P | Rate | PW | IDR | S/P | Rate | PW | IDR | |||||
| 34 | CCIS | 57 | M | 3 | S | 1740 | 18 | 60 | S | 3712 | 18 | 60 |
| 48 | CCIS | 69 | F | 2 | P | 5156 | 11.7 | 60 | P | 3712 | 18 | 60 |
| 52 | F120-S | 77 | M | 1 | S | 1740 | 18 | 60 | S | 3712 | 18 | 60 |
| 54 | HiRes-P | 25 | M | 2 | P | 5156 | 10.8 | 60 | P | 3712 | 18 | 60 |
| 58 | F120-P | 64 | M | 6 | P | 2784 | 22.4 | 70 | P | 2970 | 22.4 | 70 |
| 59 | F120-S | 47 | M | 2 | S | 1740 | 18 | 60 | S | 3712 | 18 | 60 |
| 61 | F120-S | 78 | M | 1.1 | S | 1071 | 35.9 | 60 | S | 1856 | 35.9 | 60 |
| 62 | F120-S | 32 | F | 1 | S | 892 | 35 | 80 | S | 1904 | 35 | 80 |
| 65 | HiRes-S | 56 | F | 7 | S | 1450 | 21.6 | 50 | S | 3094 | 12.6 | 50 |
| 66 | F120-S | 66 | F | 1.2 | S | 1582 | 19.8 | 60 | S | 3712 | 18 | 60 |
The fitting simulated a clinically feasible cochlear implant fitting. In fitting, the current steering option was turned on or off as needed. Minimal changes were made to the processing parameters. Listeners using sequential (S) stimulation clinically, remained on sequential stimulation, and listeners using paired (P) stimulation clinically, continued to use paired stimulation. The pulse rates and widths used were default rates provided in the clinical software, unless the users used fixed rates clinically, in which case, the rates remained fixed. Clinical mapping details are shown in Table 1. The methods were approved by the University of Washington Institutional Review Board.
2.2. Listening Tasks
Each listener was evaluated using 3 psychophysically-based tests and 3 clinical outcome measures with each processing strategy. The testing procedures were the same for both processing strategies, and the order of all test conditions was randomized. All stimuli were presented in the free field in a double-walled, sound-treated booth (IAC). Stimuli were presented using custom MATLAB programs via a Macintosh G5 computer and a Crown D45 amplifier. A single loudspeaker (B&W DM303), positioned 1 m from the listener, presented the stimuli at an average level of 65 dBA unless otherwise noted. The speaker had a flat response characteristic +/− 2 dB across the audiometric frequency range, exceeding ANSI standards. The phase response of the speaker was smooth. Listeners responded using a mouse with a custom computer interface.
2.2.1. Psychophysical tests
2.2.1.1. Spectral-ripple discrimination
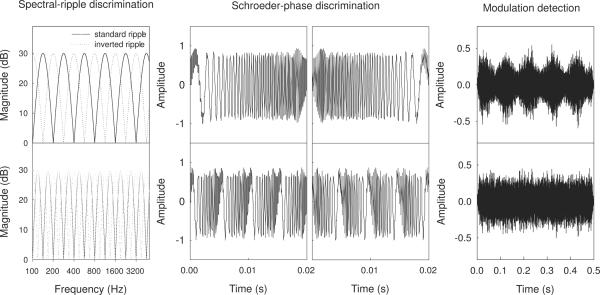
The spectral discrimination methods used were similar to those of Henry et al. (2005b) and the same as those of Won et al. (2007). Two hundred pure-tone frequency components were summed to generate the rippled noise stimuli. The amplitudes of the components were determined by a full-wave rectified sinusoidal envelope on a logarithmic amplitude scale. The ripple peaks were spaced equally on a logarithmic frequency scale. The stimuli had a bandwidth of 100–5,000 Hz and a peak-to-valley ratio of 30 dB. The starting phases of the components were randomized for each presentation. The ripple stimuli were generated with 14 different densities, measured in ripples per octave. Standard (reference stimulus) and inverted (ripple phase-reversed) stimuli were generated. For standard ripples, the phase of the full-wave rectified sinusoidal spectral envelope was set to zero radians, and for inverted ripples, it was set to π / 2. The stimuli had 500 ms total duration and were ramped with 150 ms rise/fall times. Stimuli were filtered with a long-term, speech-shaped filter (Byrne et al., 1994). Ripple stimuli with 2 ripples/octave and 2.828 ripples/octave are also shown in the left panel of Figure 1. The ripple resolution threshold was determined using a three-interval forced-choice, two-up and one-down tracking procedure, converging on 70.7% correct (Levitt, 1971). Each test run started with 0.176 ripples per octave and increased in equal ratio steps of 1.414. The presentation level was roved within trials (8 dB range in 1 dB steps) to minimize level cues. Listeners were asked to click on an onscreen button that was labeled 1, 2 or 3 after each stimulus presentation. One stimulus (i.e., inverted ripple sound, test stimulus) was different from two others (i.e., standard ripple sound, reference stimulus). The listener's task was to discriminate the test stimulus from the reference stimuli. Feedback was not provided. The threshold was estimated by averaging the ripple spacing (the number of ripples/octave) for the final 8 of 13 reversals. A 9×2 design was used which included 9 repeated runs for each processing strategy. Thus, listeners completed 18 total runs. The runs were done 3 at a time, with the selection of strategy randomized for each group of 3 runs. A 9×2 repeated-measures ANOVA was used to analyze results. Ten listeners participated in these tests.
Figure 1.
The figure shows the acoustic stimuli used in the psychophysical experiments. The left panel shows a representation of the standard and inverted ripple stimuli for the spectral-ripple tests in the frequency domain; the middle panel shows a 20 ms sample of the positive (middle right) and negative (middle left) Schroeder-phase stimuli, and the right panel shows the modulated and unmodulated stimuli used for the modulation detection experiment
2.2.1.2. Schroeder-phase discrimination
The methods for Schroeder-phase discrimination were similar to those of Dooling et al.(2002) and identical to those of Drennan et al. (2008). The method of constant stimuli was used. A 4-interval 2-alternative forced choice (2AFC) paradigm was used. The training block contained eight trials, four for each fundamental frequency (50 and 200 Hz). In each of 6 test blocks, a total of 48 randomly ordered trials were presented, with each of the two fundamental frequencies presented 24 times. Four 500-ms stimuli were presented interleaved with 100 ms of silence, including three presentations of the negative Schroeder-phase stimuli and one positive-phase stimulus that randomly occurred in either the second or third interval. A 20 ms sample of the stimuli is shown in the middle panels of Figure 1. Listeners were asked to identify the sound that was different by choosing either the second or third interval. Visual feedback of the correct answer was given after each presentation. The percent correct was calculated for each fundamental frequency. Nine listeners participated. The details of the creation of the stimuli are described in Drennan et al. (2008). Both strategies were tested in a randomly selected order and all 6 test blocks were completed for each strategy, thus each listener heard 144 trials of each frequency for each strategy.
2.2.1.3. Temporal modulation detection
Temporal modulation detection was evaluated using constant stimuli with a constant modulation depth of 10 dB and modulation frequencies of 10, 50, 75, 100, 150, 200 and 300 Hz. Each frequency was presented 60 times. The order of frequencies was randomized. A three-interval, 3AFC paradigm was used in which listeners selected which of the last two intervals contained modulation. The duration of the stimuli was 500 ms, using 10 ms rise/fall ramps on the beginning and end of each stimulus. Data were analyzed as percent correct as a function of the modulation frequency. The modulated and unmodulated parts were matched for rms amplitude. Both strategies were tested in a randomized order. Five listeners participated. The stimuli were similar to those used by Bacon and Viemeister (1985).
2.2.2. Clinical outcome measures
2.2.2.1. Speech perception in quiet
Consonant–Nucleus–Consonant (CNC) words (Peterson et al., 1962) were used to evaluate speech perception in quiet. CNC words are open set. One hundred CNC words were presented using two lists selected at random. Stimuli were presented at 62 dBA. The order of testing was randomized among listeners.
2.2.2.2. Speech perception in noise
The speech perception in noise procedure was similar to those of Turner et al. (2004) and the same as the procedures of Won et al. (2007) for speech perception in steady noise. Listeners were asked to identify one randomly chosen spondee word out of a closed set of 12 equally difficult spondees (Harris, 1991). The spondees, two-syllable words with equal emphasis on each syllable, were recorded by a female talker (fundamental frequency range: 212–250 Hz). A speech-shaped, steady state noise was used. The same background noises were used on every trial, and the onset of the spondees was 500 ms after the onset of the background noise. The steady-state noise had duration of 2.0 s. The 12-alternative forced-choice task used one-up, one-down adaptive tracking, converging on 50% correct (Levitt, 1971). The noise level was varied with a step size of 2 dB. Feedback was not provided. The threshold was estimated by averaging the signal-to-noise ratio (SNR) for the final 10 of 14 reversals. Listeners completed 6 repeated tracking histories for each processing strategy. The tracking histories were executed in groups of 3 and the processing strategies were selected in a random order for each listener.
2.2.2.3. Music perception
The Clinical Assessment of Music Perception was administered (Nimmons et al., 2007; Kang et al., 2008). This test consisted of an evaluation of pitch-direction discrimination ability, isochronous melody discrimination and timbre discrimination. The details of stimulus creation, the melodies used and implementation of all three music tests are described in Nimmons et al. (2007). Each music test had a short training period in which listeners could practice a few pitch discrimination trials with feedback. In training, listeners were required to listen to each melody or hear the instrument (timbre) two times. During subsequent testing, no feedback was given. The order of the tested strategies was selected randomly among listeners.
2.2.2.3.1. Pitch-direction discrimination
The pitch-direction discrimination task was a two-alternative forced-choice (2AFC) task administered using synthesized complex, piano-like tones. The test required users to identify which of two complex tones had the higher fundamental frequency. The dependent variable was the just-noticeable difference of the F0 measured in semitones. This was determined using a one-up, one-down tracking procedure converging on 50% correct (Levitt, 1971). Complex tones of three fundamental frequencies (262, 330 and 392 Hz) were used. Three tracking procedures were completed and the threshold was estimated using the mean of the last 6 of 8 reversals.
2.2.2.3.2. Isochronous Melody Identification
The melody identification test required listeners to identify isochronous melodies from a closed set of 12 popular melodies. Rhythm cues were removed such that notes of a longer duration were repeated in an eighth-note pattern. Rhythm discrimination ability is generally quite good in implant listeners, and this test therefore was designed to evaluate the harmonic progression of a melody, not rhythm. The test used synthesized piano-like tones with identical temporal envelopes. A total percent correct score was calculated after 36 melody presentations, including 3 presentations of each melody.
2.2.2.3.3. Timbre discrimination
The timbre recognition task required listeners to identify musical instruments from a closed set of 8 instruments that played an identical melodic contour. Listeners discriminated live recordings of instruments with moderate, uniform tempo playing a simple five-note pattern. The instruments were the piano, trumpet, clarinet, saxophone, flute, violin, cello and guitar. A total percent correct score was calculated after 24 presentations including 3 presentations of each instrument.
3. Results
3.1 Psychophysical tests
3.1.1. Spectral Ripple Discrimination
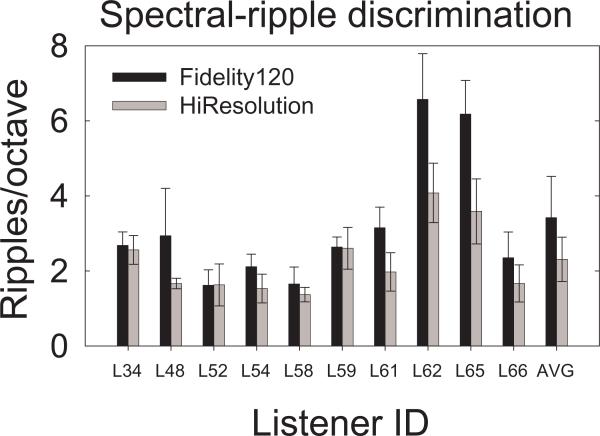
For the 10 listeners, spectral resolution was better with F120. The individual and mean results from spectral ripple discrimination are shown in Figure 2. The mean spectral ripple threshold for F120 was 3.42 ripples per octave, whereas the mean threshold for HiRes was 2.31 ripples per octave. Examination of Figure 2 reveals that the magnitude of the effect was not consistent across listeners. For example, listeners 34, 52 and 59 showed little effect of the processing strategy. Listeners 48, 62 and 65 showed large effects. Listeners 62 and 65 also had the best sensitivity to spectral ripple changes and also had CNC word scores above 80% correct. The other 3 listeners showed moderate effects. A 9×2 repeated measures ANOVA (9 repetitions and 2 processing strategies) showed a significant main effect of processing strategy (F1,9 = 13.8, p < 0.005) but no effect of repetition or interaction between the two. The lack of learning effect is consistent with the results of Won et al.(2007), which show the results of the spectral discrimination test are stable over time. Also, there was no apparent effect of the clinical processing strategy on this test. For example, listeners 48, 54 and 65 had no prior experience with F120 but showed better spectral discrimination ability with F120. Thus, the spectral ripple discrimination test was not only sensitive to changes in the processing; it also revealed differences between processing strategies with acute testing.
Figure 2.
Individual and average thresholds for spectral-ripple discrimination
3.1.2. Schroeder-phase discrimination
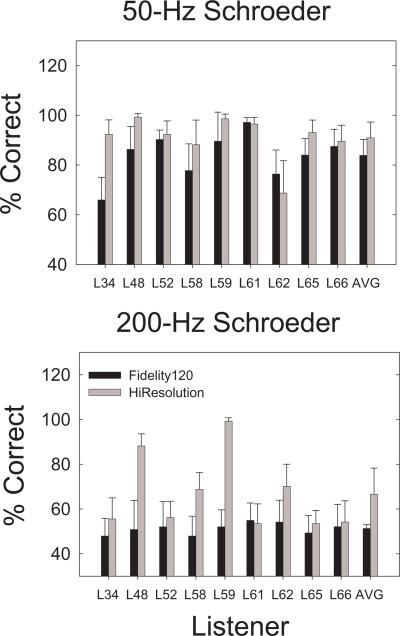
For the 9 listeners tested, 200-Hz Schroeder-phase discrimination was better with HiRes. The results are shown in Figure 3. A 6×2 repeated-measures ANOVA (6 repetitions, 2 processing types) revealed that Schroeder-phase discrimination was significantly better for HiRes at 200 Hz (F1,8 = 7.376, p < 0.026). For 50-Hz Schroeder-phase stimuli, a trend was observed in the same direction (F1,8 = 4.785, p < 0.060). The 50-Hz effect might have been reduced by a ceiling effect. There were no significant effects of repetition or any interactions for either frequency. Examination of the 200-Hz Schroeder-phase data showed that for F120, all 9 listeners were at chance levels, but for HiRes, listeners 34, 48, 58, 59 and 62 could discriminate a 200-Hz Schroeder-phase stimuli at above chance levels. For the group, this result was the exact opposite of the results seen for spectral ripple discrimination ability.
Figure 3.
Percent correct scores for individual and average data for 50- and 200-Hz Schroeder phase discrimination.
3.1.3 Modulation Detection
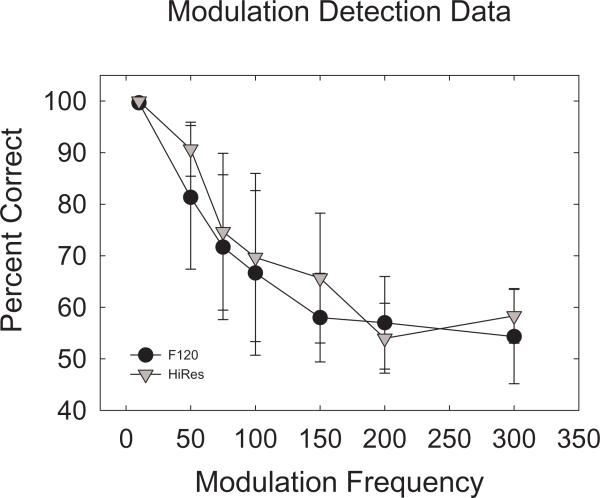
Figure 4 shows the results of modulation detection discrimination. No significant differences were observed between strategies. Only 5 listeners (48, 52, 58, 65 and 66) participated in this test. Individual results also showed few differences except for one listener who had better modulation detection using HiRes. No interaction was observed between modulation frequency and processing strategy, although the set size (N) was small.
Figure 4.
Shows average percent-correct scores at each frequency of modulation detection (N = 5).
3.2. Clinical outcome measures
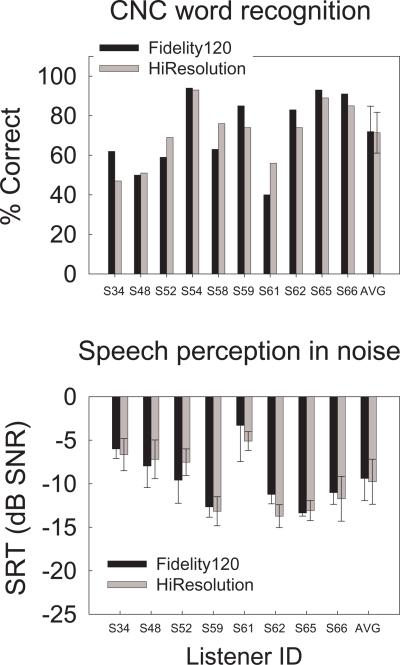
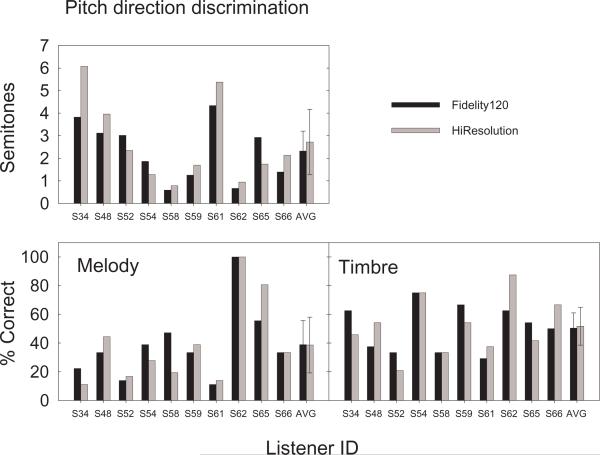
Figure 5 shows the speech test results. None of the tests revealed any differences between the two strategies. Results were not consistent among listeners with most showing no difference in performance. Figure 6 shows the music tests results. There were no significant differences between strategies with any of the music tests.
Figure 5.
The top panel shows individual and average scores for CNC-word tests. The bottom panel shows individual and average speech reception thresholds in noise.
Figure 6.
Shows the results for each component of the clinical assessment of music perception.
4. Discussion
F120 improved spectral resolution supporting the first hypothesis, but F120 also created worse temporal resolution as measured with Schroeder-phase discrimination. For the speech and music tests, no differences between the strategies were observed. Consequently, the results also support the second hypothesis that psychophysical measures of cochlear implant performance are more sensitive to processor changes than traditional clinical measures.
There are a number of potential reasons for the lack of clinical effects seen. First, the improved spectral-ripple discrimination ability with F120 might have been offset by reduced temporal discrimination ability. Spectral ripple discrimination ability and Schroeder-phase discrimination ability have been shown to be independently correlated with speech understanding (Drennan et al., 2008). Pitch perception is also based on both spectral and temporal elements (Licklider, 1956), which could affect pitch-direction and melody discrimination. Timbre is also known to have spectral and temporal elements (Handel, 1995). Thus, a spectral-temporal tradeoff could yield a null clinical result.
There are two possible reasons why F120 provides poorer temporal detail than HiRes: temporal smearing due to the FFT window, and extraneous temporal modulations due to the implementation of current steering. Litvak et al. (2003) implemented current steering clinically using a fast Fourier transform (FFT). F120 takes a “look” at the spectrum every 1.1. ms using a 14.7 ms sliding window (a block). When only using a limited number of FFT bins in each channel, this window acts as a low pass filter for temporal envelope information, smearing the temporal envelopes that would be available with HiRes. HiRes does not use an FFT but uses real-time filters, so spectral updating occurs at the pulse rate which ranged from 0.2 to 1.1 ms for the implantees tested and HiRes has no spectral smearing because there is no sliding window. Additionally, current steering creates a moving spectral peak. Green et al. (2004) found that sensitivity to temporal modulations were better when there were no dynamic spectral variations. This suggests that temporal resolution is better when the point of electrical stimulation is fixed on a specific location. If this point is moved regularly via current steering, it might interfere with the ability to discriminate temporal changes. In HiRes, single electrode amplitude modulations occur in accordance with the band-limited output for that electrode. In F120, there is a continuous balancing on each pair of electrodes to create or “steer” the spectral peak between electrodes. This will create some element of amplitude modulation on a single electrode that is not related to the actual band-limited amplitude modulation in the input, but rather, it is related to dynamic spectral changes. This spectral movement could be a significant factor affecting temporal resolution for F120 and could influence the ultimate clinical utility of the strategy.
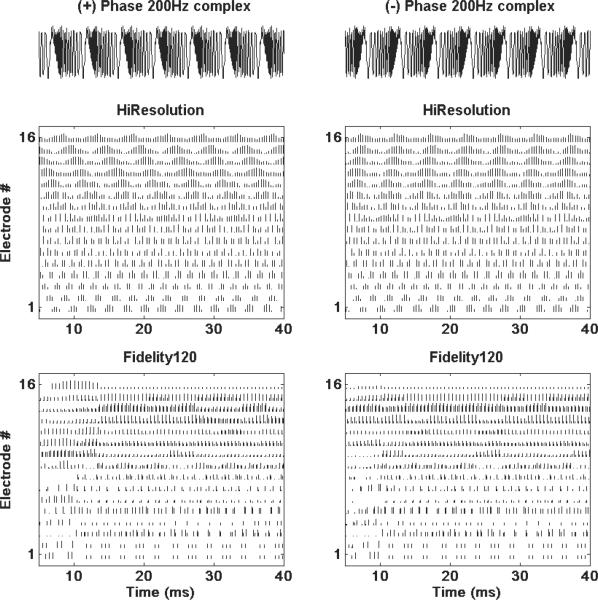
The pulsatile outputs in response to the 200-Hz Schroeder stimuli are shown in Figure 7 for HiRes and F120. A repeating frequency sweep in the envelopes of the electric pulses can be seen in the higher frequency channels 11–16 of the HiRes electrodograms. The sweep moves from high to low frequency for the positive Schroeder-phase stimuli, and from low to high frequency for the negative Schroeder-phase stimuli. In the F120 electrodograms, the sweep does not appear. It appears that the temporal weaknesses inherent in the F120 signal processing eliminate the cues necessary to discriminate 200-Hz Schroeder phase stimuli. It might be possible to shorten the time window of the F120, but this would require either decreasing spectral resolution or increasing the sampling rate, which would increase the number of computations and power consumption.
Figure 7.
The figure shows electrodograms for the positive and negative Schroeder-phase stimuli for HiRes and F120 processing.
One possible reason that F120 did not appear to yield clinical differences is that the accuracy of the spectral information it provides is not evenly distributed across the electrodes. F120 is implemented with a linear FFT using channels which are spaced logarithmically in the frequency domain. The linear FFT creates bins which are linearly spaced in frequency. Since the cochlear implant channels are spaced evenly on a logarithmic scale, there are more FFT bins in the high-frequency range (Nogueira et al., 2009). F120 then uses the levels in the FFT bins to estimate the spectral peak in each of 15 channels (15 pairs of electrodes), selecting the peak from one of 8 possible positions. Thus, F120 provides 120 possible “virtual” channels, but in the low frequency regions there are only 1 or 2 bins per channel, so these estimates could be inaccurate. The most accurate estimation of spectral peaks is in the high-frequency channels which have more FFT bins. The midfrequency regions are known to be important for speech. Thus, F120 might provide more accurate spectral information in frequency ranges that are useful for the spectral ripple discrimination task but not for speech understanding. In the low-frequency and mid-frequency channels which are most important for vowel discrimination, little or no additional spectral information is provided compared with HiRes. It might be possible to implement a non-linear FFT such that spectral information is provided equally in all frequency regions, but this would require substantially more computations and processing power. Advanced Bionics' Harmony device is currently not capable of increasing the number of computations per unit time although it might be possible on the current PSP body-worn processor or with future technology.
Finally, it is possible that for people who showed improved spectral-ripple discrimination, F120 improvements would be seen if listeners had extended experience with the F120 processing. However, similar outcomes were observed whether the listeners used F120 or HiRes clinically. Additionally, the current literature has demonstrated little or no advantage to F120 over HiRes after more experience with the processing. This literature has been inconsistent, however, perhaps owing to the small number of listeners in the studies. Some reports showed that there were no objective differences in speech understanding despite months of experience with the strategy (Brendel et al., 2008; Buechner et al., 2008), but Firszt et al., 2009 showed small but significant improvements with F120 after 3 months. Firszt et al., however, did not present individual data. With more detailed study, it would be possible to determine if the listeners who showed spectral-ripple discrimination benefit also developed a clinical benefit after a period of experience of 3 months or more.
Berenstein et al. (2008) investigated the effects of current steering on spectral ripple discrimination using an early version of F120 called “vchan” which is short for virtual channels. Their results differed from the present results in two respects: 1) They did not find a significant effect of vchan on spectral ripple discrimination when comparing the result to HiRes performance; and 2) The current results showed better overall performance. There were many differences between the studies. The differences between vchan and F120 are not known exactly, although Advanced Bionics reports the two processing schemes are similar and the differences are minor. The ripples used were similar in spectral shape but had many differences. The ripple stimuli in this study were shaped according to the speech spectrum and cut off at 5 KHz, whereas Berenstein et al ripples were flat from 100 Hz to 8 KHz and then taper in level above and below those frequencies. Acoustic energy from 5.5 KHz to 8 KHz, however, is all mapped to channel 16, providing no spectral information. No acoustic energy above 8 KHz is processed by the devices. The stimuli in this study had spectral shapes that were sinusoidal in log dB of amplitude; Berenstein et al. stumuli had spectral shapes that were sinusoidal in log dB of power. The stimuli in the present study have 30 dB dips in the spectral modulation, while Berenstein et al. stimuli had 100% modulation. Finally, the present stimuli were created by summing sinusoids with random starting phases, and the Berenstein et al. stimuli were created with noise.
To determine if the differences between F120 and HiRes might have been greater with our ripples than with Berenstein et al.'s, a quantitative analysis was conducted in which original stimuli from both studies (2 ripples per octave) were passed through a program which created electrodogram outputs for HiRes and F120. Standard and inverted ripple stimuli were used and electrodograms were generated for HiRes and F120 output. The average output level was found for each electrode, for each stimulus, for each processing strategy and for the standard and inverted ripple. The absolute values of the difference between the standard and inverted ripples were determined for each electrode in all conditions. These differences were summed across electrodes for each condition (HiRes and F120 with Berenstein et al. stimuli and with the present stimuli). This provided a measure of the electrical difference between the stimuli after they are passed through processing. For both the Berenstein et al. stimuli and the stimuli used in this study, the standard vs. inverted ripple difference was larger for F120 than for HiRes. Thus, nothing in this analysis suggested that the differences in performance would be smaller for the Berenstein stimuli than for our stimuli.
It might be that the listeners are not using the cues born out in this analysis, or, more likely, it might be that the listeners in the present study had better sensitivity than average. This study showed that the listeners with better sensitivity have the largest difference in spectral ripple discrimination ability between F120 and HiRes. The group tested here had an average ripple threshold for HiRes of 2.3 ripples per octave whereas Won et al. (2007) reported an average as 1.7 ripples per octave using a substantially larger group of listeners (N = 31). The exact same methods and stimuli were used for both studies; the only difference was the set of listeners. Thus, if our group had several exceptionally sensitive listeners while the Berenstein et al. group had more average listeners, the different result could be explained by the fact that F120 advantages might only occur in the most sensitive listeners.
The results of this study underscore the potential utility of the psychophysically-based methods used to evaluate performance with different processing strategies. The results demonstrate, in support of the second hypothesis, that these tests are more sensitive to processor changes than the clinical tests. Further, the tests demonstrated differences in the processing even when tested acutely so that they might provide a rapid indication of how hearing abilities are influenced by novel signal processing. As observed here, however, creating a processing strategy that improves one dimension of hearing might not improve clinical outcomes. Although, it remains to be seen if those who benefit using F120 on the spectral ripple task might also benefit clinically with extended experience. Improved understanding of what effects different cochlear implant processing strategies have on basic hearing abilities could nevertheless lead to viable strategies for improved sound processing design.
Acknowledgements
The authors are grateful for the dedicated efforts and sacrifice of all of our listeners, for the helpful comments from three anonymous reviewers and for the support of NIH grants R01-DC007525 and P30-DC004661 and the Advanced Bionics Corporation. We also thank Carlo Berenstein for providing some his stimuli for analysis.
Abbreviations
- HiRes
HiResolution™
- F120
HiResolution Fidelity 120™
- CNC
consonant nucleus consonant
- CAMP
clinical assessment of music perception
- S
sequential
- P
paired
- SNR
signal-to-noise ratio
- 2 AFC
2-alternative forced choice
- FFT
fast Fourier transform
Footnotes
Publisher's Disclaimer: This is a PDF file of an unedited manuscript that has been accepted for publication. As a service to our customers we are providing this early version of the manuscript. The manuscript will undergo copyediting, typesetting, and review of the resulting proof before it is published in its final citable form. Please note that during the production process errors may be discovered which could affect the content, and all legal disclaimers that apply to the journal pertain.
References
- Anderson ESC, Kreft HA, Oxenham AJ, Nelson DA. Comparing spatial tuning curves with local and global measures of spectral ripple resolution. 2009 Conference on Implantable Auditory Prostheses; Tahoe City, CA. 2009. [Google Scholar]
- Bacon SP, Viemeister NF. Temporal modulation transfer functions in normal-hearing and hearing-impaired listeners. Audiology. 1985;24:117–134. doi: 10.3109/00206098509081545. [DOI] [PubMed] [Google Scholar]
- Berenstein CK, Mens LHM, Mulder JJS, Vanpoucke FJ. Current steering and current focusing in cochlear implants: comparison of monopolar, tripolar and virtual channel electrode configurations. Ear Hear. 2008;29:250–260. doi: 10.1097/aud.0b013e3181645336. [DOI] [PubMed] [Google Scholar]
- Brendel M, Buechner A, Krueger B, Frohne-Buechner C, Lenarz T. Evaluation of the Harmony sound processor in combination with the speech coding strategy HiRes120. Otol. Neurotol. 2008;29:199–202. doi: 10.1097/mao.0b013e31816335c6. [DOI] [PubMed] [Google Scholar]
- Buechner A, Brendel M, Krueger B, Frohne-Buechner C, Nogueira W, Edler B, Lenarz T. Current steering and results from novel speech coding strategies. Otol. Neurotol. 2008;29:203–207. doi: 10.1097/mao.0b013e318163746. [DOI] [PubMed] [Google Scholar]
- Dooling RJ, Leek MR, Gleich O, Dent ML. Auditory temporal resolution in birds: Discrimination of harmonic complexes. J. Acoust. Soc. Am. 2002;112:748–759. doi: 10.1121/1.1494447. [DOI] [PubMed] [Google Scholar]
- Drennan WR, Longnion J, Ruffin C, Rubinstein JT. Discrimination of Schroeder-phase harmonic complexes by normal-hearing and cochlear implant listeners. J. Assoc. Res. Otolarygol. 2008;9:138–149. doi: 10.1007/s10162-007-0107-6. [DOI] [PMC free article] [PubMed] [Google Scholar]
- Firszt JB, Koch DB, Downing M, Litvak L. Current steering creates additional pitch percepts in adult cochlear implant recipients. Otol. Neurotol. 2007;5:629–636. doi: 10.1097/01.mao.0000281803.36574.bc. [DOI] [PubMed] [Google Scholar]
- Fu Q-J. Temporal processing and speech recognition in cochlear implant users. NeuroReport. 2002;13:1635–1639. doi: 10.1097/00001756-200209160-00013. [DOI] [PubMed] [Google Scholar]
- Green T, Faulkner A, Rosen S. Enhancing temporal cues to voice pitch in continuous interleaved sampling cochlear implants. J. Acoust. Soc. Am. 2004;116:2298–2310. doi: 10.1121/1.1785611. [DOI] [PubMed] [Google Scholar]
- Handel S. Timbre perception and auditory object formation. In: Moore BCJ, editor. Hearing. 2nd ed. Academic Press; San Diego, CA: 1995. pp. 425–461. [Google Scholar]
- Harris RW. Speech audiometry materials compact disk. Brigham Young University; Provo, UT: 1991. [Google Scholar]
- Henry BA, Turner CW. The resolution of complex spectral patterns by cochlear implant and normal-hearing listeners. J. Acoust. Soc. Am. 2003;113:2861–2873. doi: 10.1121/1.1561900. [DOI] [PubMed] [Google Scholar]
- Henry BA, Turner CW, Behrens A. Spectral peak resolution and speech recognition in quite: normal hearing, hearing impaired and cochlear implant listeners. J. Acoust. Soc. Am. 2005a;118:1111–1121. doi: 10.1121/1.1944567. [DOI] [PubMed] [Google Scholar]
- Henry BA, Turner CW, Behrens A. Spectral peak resolution and speech recognition in quiet: normal hearing, hearing impaired and cochlear implant listeners. J. Acoust. Soc. Am. 2005b;118:1111–1121. doi: 10.1121/1.1944567. [DOI] [PubMed] [Google Scholar]
- Koch DB, Downing M, Osberger MJ, Litvak L. Using current steering to increase spectral resolution in CII and HiRes90K users. Ear Hear. 2007;28(2 suppl):38S–41S. doi: 10.1097/AUD.0b013e31803150de. [DOI] [PubMed] [Google Scholar]
- Levitt H. Transformed Up-down methods in psychoacoustics. J. Acoust. Soc. Am. 1971;49:467–477. [PubMed] [Google Scholar]
- Licklider JCR. Auditory frequency analysis. In: Cherry C, editor. Information Theory. Academic Press; New York: 1956. pp. 253–268. [Google Scholar]
- Litvak LM, Krubsack DA, Overstreet EH. Method and system to convey the within-channel fine structure with a cochlear implant. Advanced Bionics Corporation; United States: 2003. p. 17. [Google Scholar]
- Nimmons G, Kang R, Drennan W, Longnion J, Ruffin C, Worman T, Yueh B, Rubinstein J. Clinical assessment of music perception in cochlear implant listeners. Otology and NueroOtology. 2007;29:149–155. doi: 10.1097/mao.0b013e31812f7244. [DOI] [PMC free article] [PubMed] [Google Scholar]
- Nogueira W, Litvak L, Edler B, Ostermann J, Buechner A. Signal processing strategies for cochlear implants using current steering. EURASIP Journal on Applied Signal Processing. 2009 in press. [Google Scholar]
- Peterson GE, Lehiste I. Revised CNC lists for auditory tests. J. Speech Hear. Disord. 1962;27:62–70. doi: 10.1044/jshd.2701.62. [DOI] [PubMed] [Google Scholar]
- Turner CW, Gantz BJ, Vidal C, Behrens A, Henry BA. Speech recognition in noise for cochlear implant listeners: Benefits of residual acoustic hearing. J. Acoust. Soc. Am. 2004;115:1729–1735. doi: 10.1121/1.1687425. [DOI] [PubMed] [Google Scholar]
- Wilson BS, Zerbi M, Lawson DT. Third Quarterly Progress Report, NIH project N01-DC-2-2401, Neural Prosthesis Program. National Institutes of Health; Bethesda, MD: 1993. Speech processors for auditory prostheses: identification of virtual channels on the basis of pitch. [Google Scholar]
- Wilson BS, Schatzer R, Lopez-Poveda EA. Possibilities for a closer mimicking of normal auditory functions with cochlear implant. In: Waltzman SB Jr., J.T.R., editors. Cochlear Implants. Second ed. Thieme Medical Publishers, Inc.; New York, NY: 2006. pp. 48–56. [Google Scholar]
- Won JH, Drennan WR, Rubinstein JT. Spectral-ripple resolution correlates with speech reception in noise in cochlear implant users. J. Assoc. Res. Otolarygol. 2007;8:384–392. doi: 10.1007/s10162-007-0085-8. [DOI] [PMC free article] [PubMed] [Google Scholar]


