

Abstract
We demonstrate the depth-resolved and detailed ocular perfusion maps within retina and choroid can be obtained from an ultrahigh sensitive optical microangiography (OMAG). As opposed to the conventional OMAG, we apply the OMAG algorithm along the slow scanning axis to achieve the ultrahigh sensitive imaging to the slow flows within capillaries. We use an 840nm system operating at an imaging rate of 400 frames/sec that requires 3 sec to complete one 3D scan of ~3x3 mm2 area on retina. We show the superior imaging performance of OMAG to provide functional images of capillary level microcirculation at different land-marked depths within retina and choroid that correlate well with the standard retinal pathology.
Better assessment of the ocular perfusion within retina and choroid of human eye is important not only in the diagnosis, but also in the treatment and management of a number of pathological conditions in ophthalmology, e.g., age related macular degeneration, diabetic retinopathy and glaucoma. Currently in clinic, the preferred methods to visualize the ocular perfusion are fluorescein angiography and indocyanine green angiography that have proven useful in clinical decision making. However, the requirement for injection of necessary dyes with their possible side effects is often undesirable. Moreover, they cannot provide depth-resolved visualization of the vasculatures. Therefore, a noninvasive technique capable of visualizing the retinal and choroidal blood perfusion in depth would be a significant advance.
As a variation of optical coherence tomography technology[1,2], optical microangiography (OMAG) is a new imaging modality capable of generating 3D images of dynamic blood perfusion distribution within micro-circulatory tissue beds [3–5]. OMAG produces imaging contrast via endogenous light scattering from moving particles (e.g., flowing blood cells), thus, no exogenous contrast agents are necessary. The basic physics behind this type of imaging is the well-known Doppler effect. The light backscattered from a moving particle carries a beating frequency that can be used to distinguish scattering signals by the moving elements from those by the static elements. To do this, the current OMAG uses high pass filtering applied in the B scan frames (obtained in the fast scanning axis) to isolate the optical scattering signals between the static and moving scatters [5]. Thus, the detectable flow velocity is determined by the time spacing, ΔtA, between the adjacent A scans, i.e., v = λ/2nΔtA, where λ is the central wavelength of the light source, and n is the refractive index of the sample. If a red blood cell moves along the probe beam direction at a speed of v ≤ 200 µm/s, then it would require ΔtA ≥ ~1.5 ms for the system (assuming λ= 840nm and n=1.35) to sample this moving blood cell. This time spacing translates into a scanning speed of ~643 A scans/sec. Therefore, the total imaging time to acquire a 3D capillary flow image of a tissue volume would be prohibitively long. Unfortunately, in the case of imaging the posterior segment of human eye, the probe beam is almost perpendicular to most of the blood flows in the retina and choroid, which makes the effective blood flow that is probed by the OMAG system very slow because the Doppler angle approaches 900. Due to this reason, the conventional OMAG often fails to image the capillary blood flows in the retina. To solve this problem, in this letter, we propose an ultrahigh sensitive OMAG (US-OMAG) system to image the slow blood flows within capillary vessels.
The system setup used to achieve US-OMAG is shown in Fig.1, similar to that used in our previous work [6]. Briefly, the system used a light source, centered at 842 nm with a bandwidth of 46 nm that provided a ~8 µm axial resolution in air. In the sample arm, the light was delivered onto the human eye by a collimator, an objective lens and an ocular lens. In the reference arm, a 20 mm water cell was used to compensate the dispersion caused by the eye. The interferogram between the reference light and the light backscattered from the sample was sent to a home-built ultrafast spectrometer via an optical circulator. The spectrometer consisted of a transmission grating (1200 lines/mm), a camera lens with a focal length of 100mm, and 1024 element line scan CMOS detector capable of 140 kHz line scan rate. The spectral resolution of the designed spectrometer was ~0.055 nm, which provided an imaging depth of ~3 mm in air. The system sensitivity was ~90 dB measured with ~900 µW power of light incident at the object and an exposure time of 6.9 µs with ΔtA=7.4 µs.
Figure 1.
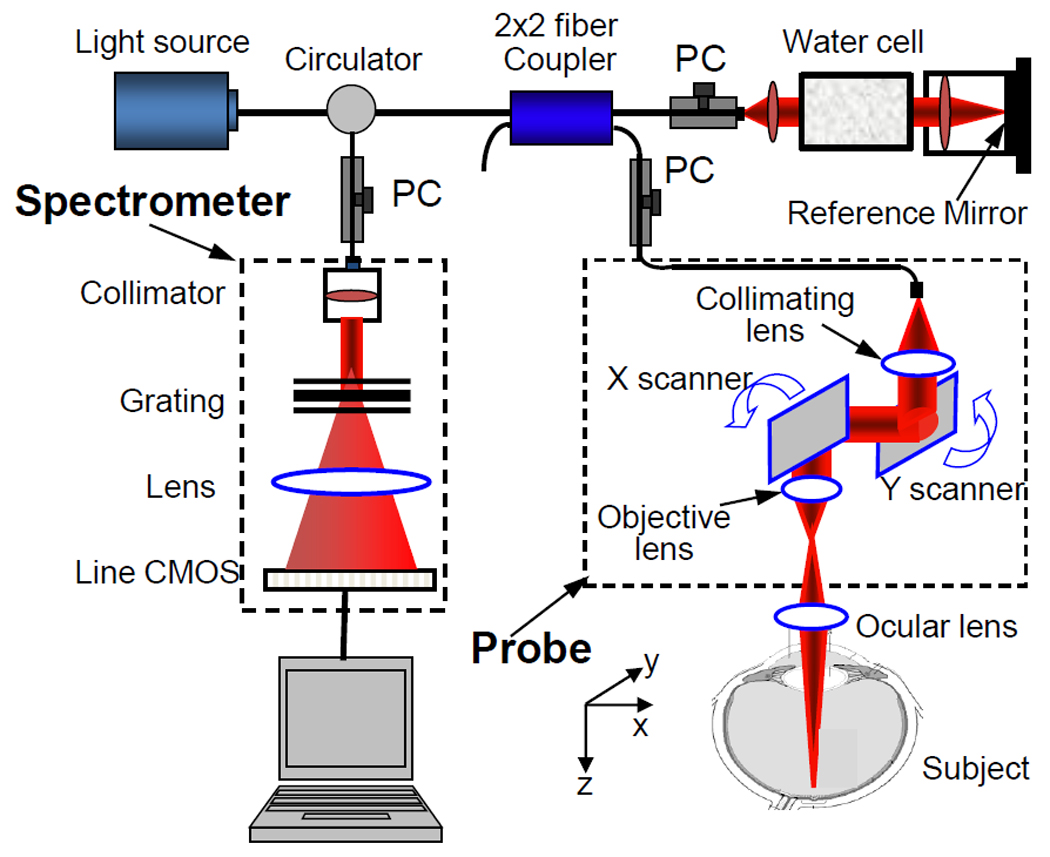
(Color online) Schematic system diagram, where PC denotes the polarization controller.
To achieve ultrahigh sensitive imaging to the flow, we applied a new scanning protocol. Firstly, the x-scanner was driven by a 400 Hz sawtooth waveform, meaning that the imaging rate is 400 frames/sec (fps). The duty cycle for acquiring each B scan (i.e. x-direction scan) was ~75%, in which we acquired 256 A-lines with a spacing of ~12 µm between adjacent lines that covered a size of ~3 mm on the retina. Secondly, the y-scanner was driven by a step function, and the entire C scan consists of 150 steps, with a spacing between adjacent steps of ~20 µm. In each step, we acquired 8 repeated B scans. Accordingly, it required 3 sec to acquire one 3D OMAG dataset, covering an area of ~3x3 mm2 on the retina. We then applied the OMAG algorithm at each step along the C scan direction. In this case, the detectable flow velocity is determined by the time spacing, ΔtB, between adjacent B scans. Because the imaging speed was 400 fps, ΔtB = 2.5 ms, which would be sufficient to image the slow flows in capillaries (see above). Finally, the calculated OMAG signals at each step were collapsed into one B scan through ensemble-averaging, resulting in 150 B scans to form the final C scan image, i.e. 3D OMAG blood flow distribution.
To demonstrate the performance of the US-OMAG system, we carried out imaging on healthy volunteers. To reduce the eye and head movement, the volunteer was asked to steer at a fixed position during the experiment. Figure 2 shows the in vivo imaging results produced by one volume dataset captured at the macular region towards the optic nerve head. Figure 2(A) shows one typical cross-sectional image (B scan) within the OMAG structural volume, which is identical to the conventional OCT image where the typical morphological features within retina and choroid are visualized. Figure 2(B) gives the corresponding blood flow image obtained from OMAG algorithm, where the capillary flows within the cross-section of retina are abundant (pointed by arrows, for example), as well as the blood flow signals in the choroid. Because of the depth-resolved nature, we are able to separate the blood flows in the retina from those in the choroid. To do this, we first used the segmentation algorithm described in [6] to identify the retinal pigment epithelium (RPE) layer. We then treated the OMAG flow signals 50µm above the RPE layer (to exclude the signals from photoreceptor inner and outer segments) as the flow signals from the retinal vessels, while those below the RPE layer from the choroidal vessels. The segmentation resulted in two volumetric flow images, one for retina and another for choroid, which are annotated in Fig. 2(B) by the labels of R and C, respectively. Finally, the maximum amplitude projection (MAP) was performed on each segmented retinal and choroidal volumes, giving the blood flow distribution maps shown in Figs. 2(C) (retina) and 2(D) (choroid), respectively. From Fig.2(C), there is seen as a ring of blood vessels in the macular area around an avascular zone ~800µm in diameter, denoting the fovea. This observation is in excellent agreement with the standard retinal pathology [7].
Figure 2.
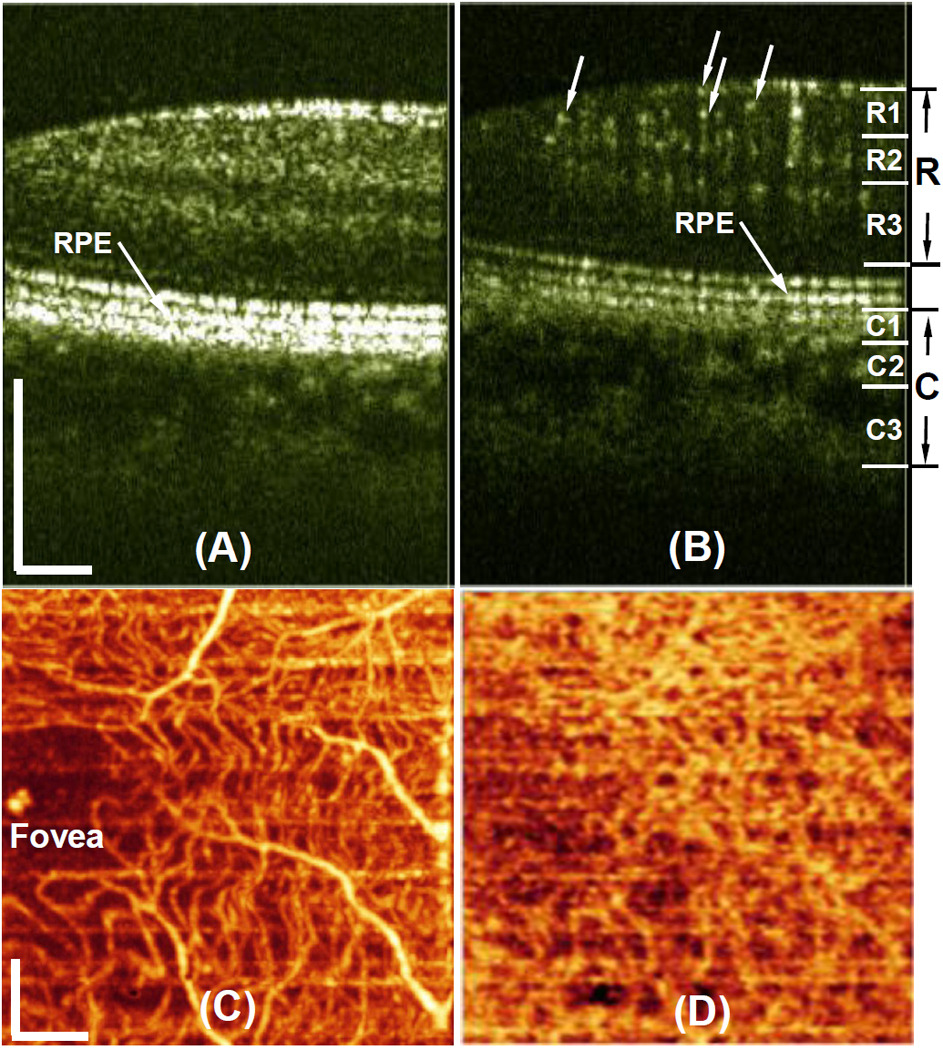
(Color online)Typical in vivo OMAG imaging of the posterior segment of eye near the macular region towards optic nerve head. (A), one typical OMAG B scan of microstructures showing morphological features, and (B) the corresponding OMAG blood flow image. The projection maps of blood flow distribution within (C) retina and (D) choroid, obtained from one 3D scan of an area of ~3x3 mm2 near macular region. White bar = 500µm
According to the well known reference [7], the retina consists of three layers of capillary networks: the radial peripapillary capillaries (RPCs, R1) and an inner (R2) and an outer layer of capillaries (R3). The RPCs are the most superficial layer of capillaries lying in the inner part of the nerve fiber layer. The inner capillaries lie in the ganglion cell layers under and parallel to the RPCs. The outer capillary network runs from the inner plexiform to the outer plexiform through the inner nuclear layers. However, the choroidal vessels in the macular region are not specialized like those in the retina. The arteries pierce the sclera around the optic nerve and fan out to form three vascular layers in the choroid: inner capillary bed (near RPE layer, C1), medial arterioles and venules (C2) and outer arteries and veins (C3). With these descriptions as the reference, we then further segmented the OMAG blood flow signals obtained from the retinal and choroidal layers, with respect to the RPE layer. The segmentation is pictorially illustrated in the left of Fig.2(B), with the labels of R1 (~425µm above RPE), R2 (between 300 and 425µm above RPE) and R3 (between 50 and 300µm above RPE) for retina, and C1 (from 0 to 70µm below RPE), C2 (from 70 to 200µm below RPE) and C3 (beyond 200µm below RPE) for choroid, respectively. After segmentation, the blood flow MAPs within each land-marked depth are shown in Fig.3 (top row for retina and bottom row for choroid). The excellent results are correlated well with the descriptions found in the standard textbook [7].
Figure 3.
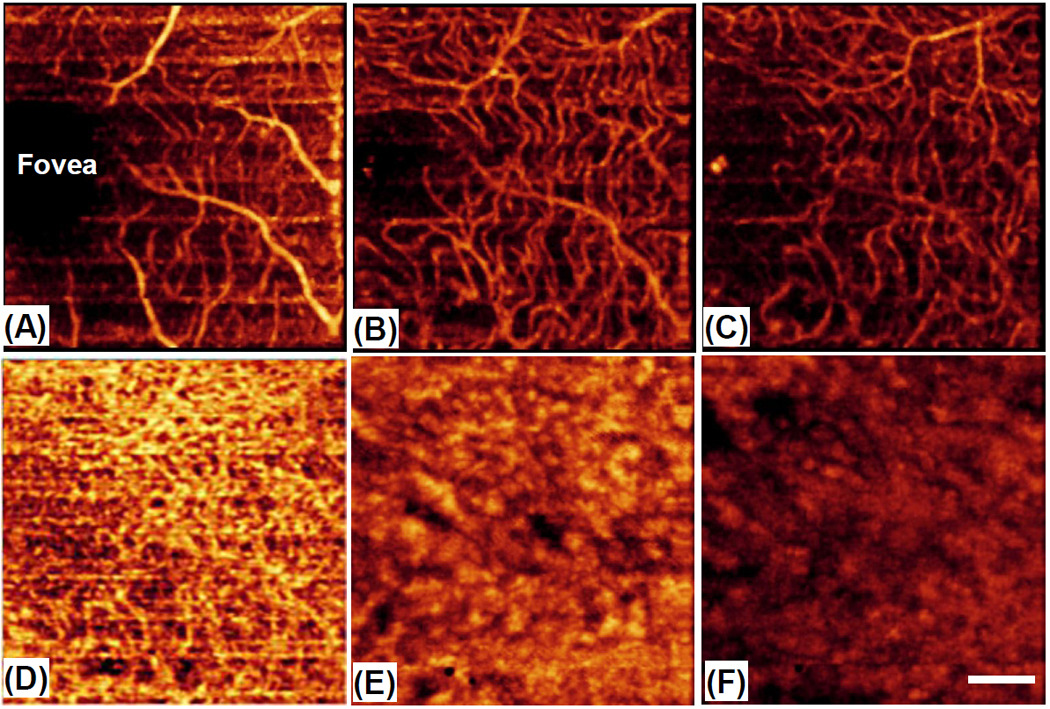
(Color online) Depth-resolved images of patent blood vessels within the retina (top row) and choroid (bottom row) at the land-marked depths annotated in the left of Fig. 2(B): (A) R1 — beyond 425µm above RPE; (B) R2 — between 300 and 425µm above RPE; (C) R3 —between 50 and 300µm above RPE; (D) C1 — between 0 to 70µm below RPE; (B) C2 — between 70 to 200µm below RPE and (F) C3 — beyond 200µm below RPE. White bar = 500µm.
The current OMAG system running at 400fps requires ~3sec to acquire one 3D blood flow image representing ~3x3 mm2 area on the retina. At this speed, the effects of subject movement on the final results are clearly noticeable (the horizontal lines in Figs. 2 & 3 are the motion artifacts). There may be two solutions to amend this problem. 1), the phase compensation algorithm developed in [6] may be used to minimize the motion artifacts before the OMAG algorithm is applied. In doing so, however, it would inevitably increase the computational load required to obtain the meaningful 3D blood flow images because of the complexity of the compensation algorithms. 2), the imaging speed is further increased to minimize the motion artifacts. The current system speed is limited by the CMOS camera used in the spectrometer with a maximum line rate at 140 kHz. Report has shown that 4096 element CMOS camera is capable of up to 240 kHz line rate [8]. Therefore, it would be expected that if this newer CMOS camera is used in the system, the motion artifacts can be mitigated.
In conclusion, we have presented an US-OMAG system capable of imaging detailed ocular perfusion distributions within retina and choroid. Applying the OMAG algorithm on the slow scanning axis, we have shown that the proposed system is sensitive to the ocular capillary flows. In addition, due to the depth-resolved nature, the system was able to provide detailed micro-circulation within different land-marked depths, the results of which are in an excellent agreement with those described in the standard textbook. The demonstrated superior imaging results promise the future clinical applications for OMAG in ophthalmology.
Acknowledgments
This work was supported in part by research grants from the National Institutes of Health (R01HL093140, R01EB009682, and R01DC010201), and an unlimited grant from Research to Prevent Blindness. R.K. Wang has a financial interest in OptoVue, Inc. which however did not support this work.
Footnotes
OCIS codes: (170.4460) Ophthalmic optics and devices; 170.3880 (medical and biological imaging); 999.999 (Optical microangiography)
Reference
- 1.Fercher AF, Drexler W, Hitzenberger CK, Lasser T. Rep. Prog. Phys. 2003;66:239–303. [Google Scholar]
- 2.Tomlins PH, Wang RK. J Phys. D: Appl. Phys. 2005;38:2519–2535. [Google Scholar]
- 3.Wang RK, Jacques S, Ma Z, Hurst S, Hanson S, Gruber A. Optics Express. 2007;15:4083–4097. doi: 10.1364/oe.15.004083. [DOI] [PubMed] [Google Scholar]
- 4.Wang RK, Hurst S. Optics Express. 2007;15:11402–11412. doi: 10.1364/oe.15.011402. [DOI] [PubMed] [Google Scholar]
- 5.Wang RK. IEEE Sel. Topics Quant. Electron. Digital Object Identifier: 10.1109/JSTQE.2009.2033609 (in press). [Google Scholar]
- 6.An L, Wang RK. Optics Express. 2008;16:11438–11452. doi: 10.1364/oe.16.011438. [DOI] [PubMed] [Google Scholar]
- 7.Henkind P, Hansen RI, Szalay J. Ocular circulation. In: Records RE, editor. Physiology of the human eye and visual system. New York: Harper & Row; 1979. pp. 98–155. [Google Scholar]
- 8.Schmoll T, Kolbitsch C, Leitgeb RA. Opt. Express. 2009;17:4166–4176. doi: 10.1364/oe.17.004166. [DOI] [PubMed] [Google Scholar]