

Abstract

The recent determination of X-ray structures of pharmacologically relevant GPCRs has made these targets accessible to structure-based ligand discovery. Here we explore whether novel chemotypes may be discovered for the A2A adenosine receptor, based on complementarity to its recently determined structure. The A2A adenosine receptor signals in the periphery and the CNS, with agonists explored as anti-inflammatory drugs and antagonists explored for neurodegenerative diseases. We used molecular docking to screen a 1.4 million compound database against the X-ray structure computationally and tested 20 high-ranking, previously unknown molecules experimentally. Of these 35% showed substantial activity with affinities between 200 nM and 9 μM. For the most potent of these new inhibitors, over 50-fold specificity was observed for the A2A versus the related A1 and A3 subtypes. These high hit rates and affinities at least partly reflect the bias of commercial libraries toward GPCR-like chemotypes, an issue that we attempt to investigate quantitatively. Despite this bias, many of the most potent new ligands were novel, dissimilar from known ligands, providing new lead structures for modulation of this medically important target.
Introduction
G-protein-coupled receptors (GPCRsa) are a large family of transmembrane proteins that signal intracellularly after binding an extracellular ligand. These receptors share a similar topology, with seven transmembrane helices, but recognize a wide range of different signaling molecules. GPCRs have been intensely studied as pharmaceutical targets, and over 40% of marketed drugs act through them.(1) Until recently, a missing link to deeper understanding of GPCRs has been a lack of atomic resolution structural information. With the recent advent of several X-ray crystal structures of pharmacologically relevant GPCRs2−5 it has for the first time become possible to leverage high-resolution structures for ligand discovery against these targets.(6)
Among the new GPCR structures is that of the A2A adenosine receptor (AR).(5) There are four subtypes of the AR (A1, A2A, A2B, and A3), and they are activated by extracellular adenosine in response to organ stress or tissue damage. The A2A AR signals in both the periphery and the CNS, with agonists explored as anti-inflammatory drugs and antagonists explored for neurodegenerative diseases, e.g., Parkinson’s disease.7−11 Although access to high resolution structural data is a crucial step toward atomic-level understanding of GPCRs, the lack of structures has certainly not been an obstacle for successful ligand discovery. For several decades, classical ligand-based medicinal chemistry approaches have been used to identify thousands of AR ligands. Almost all known AR agonists are derivatives of the cognate ligand (1−3, Chart 1), whereas antagonists are more diverse. Two large classes of AR antagonists are xanthines, with members such as caffeine (4) and theophylline (5), and adenine derivates such as 6 (ZM241385(12)), which is bound to the A2A AR binding site in the crystallographic structure (Chart 1, Figure 1A). Despite considerable medicinal chemistry efforts and the wide range of possible therapeutic applications for AR ligands, there are only a few approved drugs targeting this receptor.8,11 Consequently, there remains an ongoing need for new subtype selective agonists and antagonists of this target.
Chart 1. Structures of Known Agonists (1−3) and Antagonists (4−6) of the A2A Adenosine Receptor.

Figure 1.

Binding mode of the cocrystallized ligand 6 (A) and the predicted binding modes of the seven ligands discovered in the docking screen (B−H). The A2A AR binding site is shown in white ribbons with the side chains of Glu169 and Asn253 in sticks. In (A) the cocrystallized ligand 6 is shown using orange carbon atoms. In (B−H), the crystallographic ligand is shown using blue lines and the docking poses for the ligands are depicted with orange carbon atoms. Black dotted lines indicate hydrogen bonds. The compounds are (B) 7, (C) 8, (D) 9, (E) 10, (F) 11, (G) 12, and (H) 13.
Here, we wished to investigate whether we could find new A2A AR ligand chemotypes by using structure-based molecular docking to screen a large and putatively unbiased library of small molecules, looking for those that complement the receptor structure. Docking evaluates the complementarity of small molecules to a receptor binding site of known structure13−18 and can in principle discover new chemotypes, dissimilar to previous ligands, that nevertheless fit the binding site well. Such chemotypes might provide new routes for modulation of this key target. Methodologically, we wanted to explore what the hit rate of a structure-based (docking) screen against the A2A AR might be. In docking screens against the β2 adrenergic GPCR, a hit rate of 24% had been observed.19−23 A docking “hit” is a molecule that binds to the target at a relevant concentration, and a docking “hit rate” is the number of compounds that bind divided by the number of compounds experimentally tested. For the β2 adrenergic receptor, where the affinity of the best docking hit was 9 nM, both were unusually high. We wished to understand whether this would be true for this second GPCR and why this might be so. To investigate this, we docked a library of 1.4 million small molecules to the crystal structure of the A2A AR. From the top-scoring molecules, 20 were selected on the basis of their fit to the binding site and chemical diversity. Here, we present the experimental evaluation of these molecules and assess why GPCRs appear to be particularly suitable targets for structure-based ligand discovery.
Methods
Preparation of the Molecular Docking Screen
All docking calculations were carried out with the program DOCK 3.5.5416,17,24 using a 2.6 Å crystallographic structure of the A2A adenosine receptor in complex with an antagonist (6)(12) (PDB accession code 3EML(5)). The receptor structure was prepared by removing all non-protein atoms and the intracellular T4-lysozyme insertion. The protonation states of ionizable residues were set to the most probable in aqueous solution at pH 7.
The flexible-ligand sampling algorithm in DOCK3.5.54 superimposes atoms of the docked molecule onto binding site matching spheres, which indicate putative ligand atom positions.16,17 In the case of the A2A AR, 45 matching spheres were used, and these were either based on the atoms of the crystallographic ligand or positioned manually. The spheres were also labeled for chemical matching based on the local receptor environment.(25) The degree of ligand sampling is determined by the bin size, bin size overlap, and distance tolerance. These three parameters were set to 0.4, 0.3, and 1.5 Å, respectively, for both the binding site matching spheres and the docked molecules. For ligand conformations passing an initial steric filter, a physics-based scoring function is used to evaluate the fit to the receptor binding site. For the best scoring conformation of each docked molecule, 100 steps of rigid-body minimization are carried out. The score for each conformation is calculated as the sum of the receptor−ligand electrostatic and van der Waals interaction energy, corrected for ligand desolvation. These three terms are evaluated from precalculated grids. The three-dimensional map of the electrostatic potential in the binding site was prepared using the program Delphi.(26) In this calculation, partial charges from the united atom AMBER force field(27) were used for all receptor atoms except the side chain amide of Asn253, for which the dipole moment was increased to favor hydrogen bonding to this residue (we have adopted this technique of increasing local dipoles on a few polar residues in the active site without changing their formal charges extensively in past studies).28,29 The program CHEMGRID was used to generate a van der Waals grid, which is based on a united atom version of the AMBER force field.(30) The desolvation penalty for a ligand conformation is estimated from a precalculated transfer free energy of the molecule between solvents of dielectrics 78 and 2. The desolvation energy is obtained by weighting the transfer free energy with a scaling factor that reflects the degree of burial of the ligand in the receptor binding site.31,32
The ZINC leadlike set was prepared by filtering a large library of commercially available compounds using the criteria log P < 3.5, molecular weight of <350, and number of rotatable bonds of ≤7.(33) Each molecule has been prepared for docking by pregenerating up to 1000 conformations using the program OMEGA.(34) Partial atomic charges and transfer free energies have been calculated using AMSOL,35,36 and van der Waals parameters have been derived from an all-atom AMBER potential.(37)
Similarity and Library Bias Calculations
Similarity calculations were carried out with the program Pipeline Pilot(38) using the Tanimoto coefficient and ECFP4 fingerprints. For each of the docking-discovered ligands, the Tanimoto similarity to all annotated A1, A2A, A2B, and A3 AR ligands with Ki ≤ 10 μM in the World of Molecular Bioactivity (WOMBAT 2006.2)(39) and ChEMBL (a StARlite 2009 prerelease version)(40) databases was calculated. The number of molecules in the ZINC leadlike database that are similar to known ligands of the ARs, adrenergic receptors, adenylyl cyclases, and AmpC β-lactamase was predicted with the similarity ensemble approach (SEA) using ECFP4 fingerprints.(41) Ligands (Ki ≤ 10 μM) that are annotated to ARs, adrenergic receptors, and adenylyl cyclases were extracted from the WOMBAT database. Ligands for AmpC β-lactamase were extracted from refs (28), (29), and (42). For each ligand set, the number of leadlike molecules in ZINC that have a SEA P value better than 10−10 was calculated. The predicted compounds were then postfiltered for molecules that match the molecular weight and formal charge ranges of the known ligands.
A2A AR Receptor Binding and Functional Assay
Binding assays at three hAR subtypes were carried out using standard radioligands43−45 and membrane preparations from Chinese hamster ovary (CHO) cells (A1 and A3) or human embryonic kidney (HEK293) cells (A2A) stably expressing a hAR subtype.46,47 A functional assay at the A2AAR consisted of stimulation of cAMP production48,49 in A2AAR-expressing HEK293 cells. [3H]R-N6-(2-phenylisopropyl)adenosine ([3H]R-PIA, 42.6 Ci/mmol) was obtained from Moravek Biochemicals (Brea, CA). [3H](2-[p-(2-Carboxyethyl)phenylethylamino]-5′-N-ethylcarboxamidoadenosine) ([3H]CGS21680, 40.5 Ci/mmol) and [125I]N6-(4-amino-3-iodobenzyl)adenosine-5′-N-methyluronamide ([125I]I-AB-MECA, 2200 Ci/mmol) were purchased from Perkin-Elmer Life and Analytical Science (Boston, MA). Test compounds were prepared as 5 mM stock solutions in DMSO and stored frozen at −20 °C.
Cell Culture and Membrane Preparation
CHO cells stably expressing the recombinant hA1 and hA3Rs, and HEK-293 cells stably expressing the hA2AAR were cultured in Dulbecco’s modified Eagle medium (DMEM) and F12 (1:1) supplemented with 10% fetal bovine serum, 100 units/mL penicillin, 100 μg/mL streptomycin, and 2 μmol/mL glutamine. In addition, 800 μg/mL Geneticin was added to the A2A media, while 500 μg/mL hygromycin was added to the A1 and A3 media. After being harvested, cells were homogenized and suspended in PBS. Cells were then centrifuged at 240g for 5 min, and the pellet was resuspended in 50 mM Tris-HCl buffer (pH 7.5) containing 10 mM MgCl2. The suspension was homogenized and was then ultracentrifuged at 14330g for 30 min at 4 °C. The resultant pellets were resuspended in Tris buffer and incubated with adenosine deaminase (3 units/mL) for 30 min at 37 °C. The suspension was homogenized with an electric homogenizer for 10 s, pipetted into 1 mL vials, and then stored at −80 °C until the binding experiments were conducted. The protein concentration was measured using the BCA protein assay kit from Thermo Scientific Pierce Protein Research Products (Rockford, IL).(50)
Binding Assays
The tested compounds were purchased from six different vendors (Enamine, ChemDiv, ChemBridge, Vitas-M, Pharmeks, and Asinex). The vendors had verified that each compound had ≥95% purity by liquid chromatography−mass spectrometry (LC−MS) or nuclear magnetic resonance (NMR) experiments. Into each tube in the binding assay was added 50 μL of increasing concentrations of the test ligand in Tris-HCl buffer (50 mM, pH 7.5) containing 10 mM MgCl2, 50 μL of the appropriate agonist radioligand, and finally 100 μL of membrane suspension. For the A1AR (22 μg of protein/tube) the radioligand used was [3H]R-PIA (final concentration of 3.5 nM). For the A2AAR (20 μg/tube) the radioligand used was [3H]CGS21680 (10 nM). For the A3AR (21 μg/tube) the radioligand used was [125I]I-AB-MECA (0.34 nM). Nonspecific binding was determined using a final concentration of 10 μM unlabeled 5′-N-ethylcarboxamidoadenosine (NECA, 2) diluted with the buffer. The mixtures were incubated at 25 °C for 60 min in a shaking water bath. Binding reactions were terminated by filtration through Brandel GF/B filters under a reduced pressure using a M-24 cell harvester (Brandel, Gaithersburg, MD). Filters were washed three times with 3 mL of 50 mM ice-cold Tris-HCl buffer (pH 7.5). Filters for A1 and A2AAR binding were placed in scintillation vials containing 5 mL of Hydrofluor scintillation buffer and counted using a Perkin Elmer liquid scintillation analyzer (Tri-Carb 2810TR). Filters for A3AR binding were counted using a Packard Cobra II γ-counter. The Ki values were determined using GraphPad Prism for all assays.
Cyclic AMP Accumulation Assay
Intracellular cyclic AMP (cAMP) levels were measured with a competitive protein binding method.48,49 CHO293 cells that expressed the recombinant human A2AAR were harvested by trypsinization. After centrifugation and resuspension in medium, cells were planted in 24-well plates in 1.0 mL of medium. After 24 h, the medium was removed and cells were washed three times with 1 mL of DMEM containing 50 mM HEPES, pH 7.4. Cells were then treated with the test compound in the presence of rolipram (10 μM) and adenosine deaminase (3 units/mL), and incubation was continued for an additional 1 h. The reaction was terminated by removing the supernatant, and cells were lysed upon the addition of 200 μL of 0.1 M ice-cold HCl. The cell lysate was resuspended and stored at −20 °C. For determination of cyclic AMP production, protein kinase A (PKA) was incubated with [3H]cyclic AMP (2 nM) in K2HPO4/EDTA buffer (K2HPO4, 150 mM; EDTA, 10 mM), 20 μL of the cell lysate, and 30 μL of 0.1 M HCl or 50 μL of cyclic AMP solution (0−16 pmol/200 μL for standard curve). Bound radioactivity was separated by rapid filtration through Whatman GF/C filters and washed once with cold buffer. Bound radioactivity was measured by liquid scintillation spectrometry.
Counterscreen for Colloidal Inhibition
To control for artifactual inhibition by colloidal aggregation, we looked for particle formation by Dynamic Light Scattering (DLS) and by inhibition of two counterscreen enzymes, cruzain and AmpC β-lactamase. Concentrated DMSO stocks of compounds were diluted with filtered 50 mM KPi, pH 7.0. Measurements were made using a DynaPro MS/X (Wyatt Technology) with a 55 mW laser at 826.6 nm. The laser power was 100%, and the detector angle was 90°. Cruzain assays were performed in 100 mM sodium acetate, pH 5.5, containing 5 mM DTT with and without 0.1% Triton X-100. Compounds were incubated with 0.8 nM cruzain for 5 min, and reactions were initiated by adding the fluorogenic substrate Z-Phe-Arg-aminomethylcoumarin (Z-FR-AMC). The final reaction volume was 200 μL with cruzain at 0.4 nM and ZF-R-AMC at 2.5 μM. Final DMSO concentrations were 0.5%. To measure enzyme inhibition, the increase in fluorescence (excitation wavelength of 355 nm, emission wavelength of 460 nm) was recorded for 5 min in a microtiter plate spectrofluorimeter (Molecular Devices, FlexStation). Assays were performed in duplicate in 96-well plates, with controls measuring enzyme activity in the presence of DMSO. Activity was measured for seven different concentrations for each compound. Inhibition of AmpC β-lactamase was measured for the two best compounds identified here, compounds 9 and 11, to complement the cruzain assay results. Assays were performed in 50 mM potassium phosphate, pH 7.0. Compounds were incubated with 1 nM β-lactamase for 5 min, and reactions were initiated by adding the substrate CENTA to a final concentration 92 μM. The final reaction volume was 1 mL. To measure enzyme inhibition, the increase in absorbance at 405 nm was recorded for 5 min in a UV−vis spectrophotometer (Agilent). Assays were performed in duplicate in 1 mL cuvettes, with controls measuring enzyme activity in the presence of DMSO. Activity was measured at 10 μM, 0.1% DMSO.
Results and Discussion
Molecular Docking Screen and Compound Selection
The program DOCK3.5.5416,17 was used to screen 1.4 million commercially available “leadlike” molecules from the ZINC(33) database against the orthosteric site of the A2A AR. On average, each molecule was sampled in 5000 orientations and, for each that fit, an average of 16 500 conformations; the receptor was held rigid. Each molecule was scored for electrostatic and van der Waals complementarity corrected for ligand desolvation. Molecules typically overlapped with the geometry of the crystallized antagonist, making a mixture of polar and hydrophobic interactions, packing deeply into the site (Figure 1). The 500 top-ranking molecules (Table S1, Supporting Information), 0.035% of the docking prioritized library, were analyzed visually for features that are not taken into account in the docking calculation. This is a standard procedure for all our docking screens in which each of the molecules is inspected for novelty, physical properties, and binding energy contributions that are not included in the docking scoring function. For example, compound 9 (Table 1) was chosen both because it complemented the site well and because there were several molecules with the same scaffold in the top 500 list of compounds (e.g., the molecules ranked 7, 31, 59, 104, 115, 135, 137, 172, 184, 199, and 278 in Table S1, Supporting Information). From this evaluation, 20 compounds representing diverse molecules (within the context of the top 500-ranking molecules) were prioritized for experimental testing.
Table 1. Ligand Structures and Experimental Data for the Seven Hits from the Docking Screen against the A1, A2A, and A3 ARs.
 |
Radioligand Displacement Assays and Docking Hit Rate
The 20 compounds selected from the docking screen were tested for binding in a radioligand displacement assay. Seven of these molecules inhibited binding by ≥40% at 20 μM, corresponding to a “hit rate” of 35%. Subsequent dose−response curves were well-behaved, with Ki values varying from 200 nM to 8.8 μM (Table 1 and Figure 2). Four of the ligands, 9, 10, 11 and 13, were counterscreened for colloidal aggregation, a common mechanism of artifactual inhibition.(51) No colloidal particles were observed at 10 μM, by dynamic light scattering, for 9 and 13, nor did they inhibit cruzain at the same concentration. For compounds 10 and 11, particles were observed at 10 μM, but for 10 these appeared to be precipitant rather than colloids and this compound did not inhibit cruzain up to 10 μM. For compound 11 particles were observed at 10 μM, as was enzyme inhibition, but this inhibition was not reversible by detergent, inconsistent with colloidal aggregation. Furthermore, no inhibition of AmpC β-lactamase was observed up to 10 μM for 9 and 11. Taken together with the well-behaved dose−response curves (Figure 2), these results indicate that the molecules are well behaved, classical binding ligands.
Figure 2.
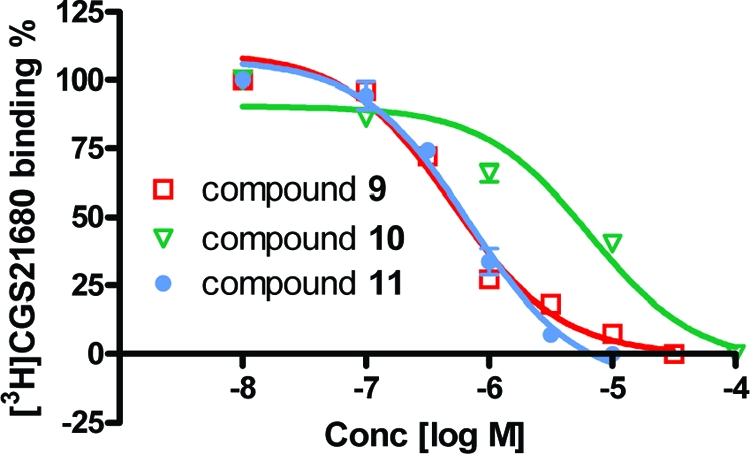
Representative dose−response curves for displacement of binding of the radiolabeled A2A AR agonist 3 by compounds 9, 10, and 11.
All seven docking hits are specific for the A2A AR versus the related A1 and A3 subtypes (Table 1). Notably, our most potent ligand, compound 11, is also the most specific with over 50-fold higher affinity at the A2A AR. We therefore investigated five of its analogues not picked in the first round of docking that also fit well into the site (compounds 14−18, Table 2). Four of the analogues were found to bind to the A2A AR with submicromolar affinities, and these molecules also had an improved A2A/A1 subtype selectivity. From these results, the prospects of identifying specific high-affinity A2A antagonists in this new class of compounds appear promising.
Table 2. Binding Affinities and Structures of Five Analogues to Compound 11 in Radioligand Binding Assays at A1, A2A, and A3 ARs.
 |
Measured in three independent experiments.
To put the results from this docking screen in perspective, our laboratory considers a high-throughput docking screen to be successful if a hit rate of 5% with ligand affinities in the micromolar range can be achieved. For example, we tested 56 compounds from a docking screen against AmpC β-lactamase and found one compound with a Ki value better than 100 μM, corresponding to a hit rate of 2%;(29) this inhibitor had a Ki value of 26 μM (Table 3). In the case of the A2A AR we observe 10-fold higher hit rate and the affinities of the hits are 10- to 100-fold better. Intriguingly, similar results were obtained in two docking screens against the other pharmaceutically relevant GPCR for which a crystallographic structure has been solved, the β2 adrenergic receptor.19,20 Kolb et al. identified six previously unknown ligands of the β2 adrenergic receptor, a 24% hit rate, with affinities as high as 9 nM.(19) It may be that GPCRs are particularly well-suited for structure-based docking screens, a point to which we will return.
Table 3. Target Library Bias and Docking Hit Rates.
| representative DOCK screen |
|||
|---|---|---|---|
| target | no. of ZINC molecules similar to known ligandsa | hit rateb (%) | best potencyc (nM) |
| adenosine receptors | 4240 | 35 | 200 |
| adrenergic receptors | 4146 | 24 | 9(19) |
| adenylyl cyclases | 565 | 4 | 50000(55) |
| AmpC β-lactamase | 545 | 2−5 | 26000(29) |
ZINC leadlike molecules with at least 10−10P values to annotated target ligands in WOMBAT using the similarity ensemble approach (SEA).
(Number of true ligands)/(number of predictions tested experimentally).
The affinity of the ligand with the best potency from the docking screen.
Predicted Binding Modes, Novelty, and Efficacy of the Discovered A2A AR Ligands
All seven of the new ligands are predicted to interact with the key recognition residue Asn253 in transmembrane helix 6 and many also hydrogen-bond with the carboxylate of Glu169 in extracellular loop 2, both in the orthosteric site of the receptor (Figure 1). The importance of interactions with Asn253 was identified early in our docking screens. We found that increasing the dipole moment of the Asn253 side chain amide, a technique we employ frequently, substantially increased the enrichment of known A2A AR ligands among a database of decoys in control calculations. Asn253 is conserved in all four AR receptor subtypes and has also been found to be a crucial interaction partner for both agonists and antagonists in mutagenesis studies.(52)
Whereas all the seven ligands are previously uncharacterized for the A2A AR, some of them bear known chemotypes. To quantify their novelty, or lack of it, we calculated the similarity of each molecule to 7500 known AR ligands from the WOMBAT and ChEMBL databases using pairwise Tanimoto coefficients (Tc, ECFP4 fingerprints) (Table 1). Ligand 12 resembles members of the xanthine class of antagonists, while compound 7 resembles certain quinazoline(53) ligands. Conversely, whereas compounds 10, 11, and 13 do conserve several moieties with known ligands, they also differ substantially from them, with Tc values of 0.3 to the closest annotated ligand. Nevertheless, they complement the site well both sterically and electrostatically (Figure 1). The potency of these molecules suggests that they may merit further study as new lead families for antagonists of the A2A AR.
To determine the efficacy of the compounds, their ability to inhibit intracellular cAMP production induced by agonist 3 was tested. No stimulation of cAMP production was detected for any of the molecules, while a clear displacement of agonist function was observed for the two most potent compounds, 9 and 11 (Figure 3). All seven of the new ligands are thus almost certainly A2A antagonists, as is the cocrystallized ligand. Intriguingly, this efficacy bias was also observed in the docking screens against the β2 adrenergic receptor, where only inverse agonists were found against the structure crystallized with the inverse agonist carazolol. In docking to rigid GPCR structures, the protein conformation may bias the screen toward molecules with the same efficacy as the cocrystallized ligand. This represents a challenge to our ability to exploit these structures for mechanisms of action, such as agonism, not represented in the experimental structure. To further investigate this, we determined the rank of two agonists, 1 and 2 (Chart 1), that were present in the set of commercially available molecules screened against the A2A AR binding site. Whereas multiple known antagonists would have been ranked among the top 500 molecules in the docking screen, these two agonists were ranked 951 057 and 919 993, respectively.
Figure 3.

Functional assay based on measuring the production of cAMP for 3 (control), a potent A2A AR agonist, with or without 10 μM 9 or 11. The dose−response curve is shifted for both compounds, as expected in the case of competitive antagonistic inhibition. The % activation refers to production of cAMP normalized to the effect of 3 at 100 μM.
Is There Library Bias toward GPCR Chemotypes in Chemical Libraries?
Returning to one of the questions that motivated this study, the structure-based screen against the A2A AR returned a diverse set of ligands dissimilar to those previously characterized, as well as several similar to known ligands, and did so with a hit rate of 35%. Not only is this hit rate much higher than we have come to expect for enzyme targets screened with the same approach, but the new antagonists were also close to 100-fold more potent than we have come to expect for our docking “hits”. Furthermore, these results are strikingly similar to those observed in docking screens against the β2 adrenergic GPCR.19,20 To what may these unusually high hit rates and affinities be attributed?
Family A GPCRs like the A2A AR are the targets for a substantial fraction of marketed drugs, and this partly reflects the quality of their sites for specific recognition of small molecules. Largely buried from bulk solvent, these sites can almost completely enclose a “druglike” molecule and can do so with a mixture of nonpolar and polar interactions. Consequently, a large and sustained medicinal chemistry effort has focused on these targets, and by now even putatively unbiased libraries, like ZINC, have become populated with molecules bearing “GPCR-like” chemotypes. This also reflects a bias toward naturally occurring molecules in our screening libraries.(54) Indeed, Kolb et al. estimated that there were 3−12 times as many small molecules that were similar to GPCR ligands in the ZINC leadlike set compared to other common drug targets such as kinases, proteases, and ligand-gated ion channels.(19) To make this comparison more specific and relevant to the adenosine receptor versus other docking targets that we ourselves have worked, we investigated the library bias in ZINC for the adrenergic and adenosine receptors together with two other targets for which we have observed much lower hit rates and affinities19,29,55 (Table 3). The number of molecules in the ZINC leadlike set that are similar to the ligands of these targets was estimated using SEA,(54) insisting on a P value of 10−10 or better; acceptable molecules had also to resemble the annotated ligands in their physical properties (see Methods). Over 4000 small molecules resemble ligands annotated to the ARs and adrenergic receptors in the WOMBAT(39) database, almost 10-fold more than found for the enzymes adenylyl cyclase and AmpC β-lactamase, against which, correspondingly, our docking hit rates and affinities have been 10- to 100-fold lower. Thus, it is the convolution of the high “ligand-ability” of the orthosteric sites and the many GPCR-like chemotypes in our libraries that makes the adrenergic and adenosine receptors so fruitful for structure-based techniques.
Note Added after Initial Review of This Paper
After this paper was submitted for review, a paper by Abagyan, Stevens, and colleagues appeared that also targeted the A2A AR for novel inhibitor discovery, also using a molecular docking screen.(56) As here, Abagyan et al. also observed a very substantial hit rate with high affinities (indeed, both the affinities and hit rates were slightly better than those we observe). Whereas the compounds discovered in the two screens were substantially different, the observation of the high hit rates and, by screening standards, high affinity “hits” is consistent with the high “ligand-ability” of the class A GPCRs and the fortuitous library bias toward them, and this is among the important conclusions of this study.
Acknowledgments
This work is supported by NIH Grant GM59957 (to B.K.S.), NIDDK Intramural Research Program (to K.A.J.), and a fellowship from the Knut and Alice Wallenberg Foundation (to J.C.). We thank A. Doak for aggregation assays and members of the Shoichet lab for docking “hit-list” evaluation. We thank Tudor Oprea for access to the WOMBAT database and John Overington for a prerelease version of the ChEMBL database.
Supporting Information Available
Table S1 of structures of the 500 top-ranking molecules from the docking screen. This material is available free of charge via the Internet at http://pubs.acs.org.
Funding Statement
National Institutes of Health, United States
Footnotes
Abbreviations: GPCR, G-protein-coupled receptor; AR, adenosine receptor; CNS, central nervous system; SEA, similarity ensemble approach; PDB, Protein Data Bank; WOMBAT, World of Molecular Bioactivity; CHO, Chinese hamster ovary; DMEM, Dulbecco’s modified Eagle medium; PKA, protein kinase A; DLS, dynamic light scattering.
Supplementary Material
References
- Overington J. P.; Al-Lazikani B.; Hopkins A. L. How many drug targets are there?. Nat. Rev. Drug Discovery 2006, 5, 993–996. [DOI] [PubMed] [Google Scholar]
- Cherezov V.; Rosenbaum D. M.; Hanson M. A.; Rasmussen S. G. F.; Thian F. S.; Kobilka T. S.; Choi H. J.; Kuhn P.; Weis W. I.; Kobilka B. K.; Stevens R. C. High-resolution crystal structure of an engineered human beta(2)-adrenergic G protein-coupled receptor. Science 2007, 318, 1258–1265. [DOI] [PMC free article] [PubMed] [Google Scholar]
- Rosenbaum D. M.; Cherezov V.; Hanson M. A.; Rasmussen S. G. F.; Thian F. S.; Kobilka T. S.; Choi H. J.; Yao X. J.; Weis W. I.; Stevens R. C.; Kobilka B. K. GPCR engineering yields high-resolution structural insights into beta(2)-adrenergic receptor function. Science 2007, 318, 1266–1273. [DOI] [PubMed] [Google Scholar]
- Warne T.; Serrano-Vega M. J.; Baker J. G.; Moukhametzianov R.; Edwards P. C.; Henderson R.; Leslie A. G. W.; Tate C. G.; Schertler G. F. X. Structure of a beta(1)-adrenergic G-protein-coupled receptor. Nature 2008, 454, 486–491. [DOI] [PMC free article] [PubMed] [Google Scholar]
- Jaakola V. P.; Griffith M. T.; Hanson M. A.; Cherezov V.; Chien E. Y. T.; Lane J. R.; IJzerman A. P.; Stevens R. C. The 2.6 angstrom crystal structure of a human A(2A) adenosine receptor bound to an antagonist. Science 2008, 322, 1211–1217. [DOI] [PMC free article] [PubMed] [Google Scholar]
- Congreve M.; Marshall F. The impact of GPCR structures on pharmacology and structure-based drug design. Br. J. Pharmacol. 2010, 159, 986–996. [DOI] [PMC free article] [PubMed] [Google Scholar]
- Moro S.; Gao Z. G.; Jacobson K. A.; Spalluto G. Progress in the pursuit of therapeutic adenosine receptor antagonists. Med. Res. Rev. 2006, 26, 131–159. [DOI] [PMC free article] [PubMed] [Google Scholar]
- Jacobson K. A.; Gao Z. G. Adenosine receptors as therapeutic targets. Nat. Rev. Drug Discovery 2006, 5, 247–264. [DOI] [PMC free article] [PubMed] [Google Scholar]
- Sebastiao A. M.; Ribeiro J. A. Adenosine receptors and the central nervous system. Handb. Exp. Pharmacol. 2009, 471–534. [DOI] [PubMed] [Google Scholar]
- Blackburn M. R.; Vance C. O.; Morschl E.; Wilson C. N. Adenosine receptors and inflammation. Handb. Exp. Pharmacol. 2009, 215–269. [DOI] [PubMed] [Google Scholar]
- Cristalli G.; Muller C. E.; Volpini R. Recent developments in adenosine A2A receptor ligands. Handb. Exp. Pharmacol. 2009, 59–98. [DOI] [PubMed] [Google Scholar]
- Poucher S. M.; Keddie J. R.; Singh P.; Stoggall S. M.; Caulkett P. W. R.; Jones G.; Collis M. G. The in-vitro pharmacology of Zm-241385, a potent, nonxanthine, a(2a) selective adenosine receptor antagonist. Br. J. Pharmacol. 1995, 115, 1096–1102. [DOI] [PMC free article] [PubMed] [Google Scholar]
- Degen J.; Rarey M. FlexNovo: structure-based searching in large fragment spaces. ChemMedChem 2006, 1, 854–868. [DOI] [PubMed] [Google Scholar]
- Jones G.; Willett P.; Glen R. C.; Leach A. R.; Taylor R. Development and validation of a genetic algorithm for flexible docking. J. Mol. Biol. 1997, 267, 727–748. [DOI] [PubMed] [Google Scholar]
- Kairys V.; Fernandes M. X.; Gilson M. K. Screening drug-like compounds by docking to homology models: a systematic study. J. Chem. Inf. Model. 2006, 46, 365–379. [DOI] [PubMed] [Google Scholar]
- Lorber D. M.; Shoichet B. K. Flexible ligand docking using conformational ensembles. Protein Sci. 1998, 7, 938–950. [DOI] [PMC free article] [PubMed] [Google Scholar]
- Lorber D. M.; Shoichet B. K. Hierarchical docking of databases of multiple ligand conformations. Curr. Top. Med. Chem. 2005, 5, 739–749. [DOI] [PMC free article] [PubMed] [Google Scholar]
- Zavodszky M. I.; Kuhn L. A. Side-chain flexibility in protein−ligand binding: the minimal rotation hypothesis. Protein Sci. 2005, 14, 1104–1114. [DOI] [PMC free article] [PubMed] [Google Scholar]
- Kolb P.; Rosenbaum D. M.; Irwin J. J.; Fung J. J.; Kobilka B. K.; Shoichet B. K. Structure-based discovery of beta(2)-adrenergic receptor ligands. Proc. Natl. Acad. Sci. U.S.A. 2009, 106, 6843–6848. [DOI] [PMC free article] [PubMed] [Google Scholar]
- Sabio M.; Jones K.; Topiol S. Use of the X-ray structure of the beta(2)-adrenergic receptor for drug discovery. Part 2: Identification of active compounds. Bioorg. Med. Chem. Lett. 2008, 18, 5391–5395. [DOI] [PubMed] [Google Scholar]
- de Graaf C.; Rognan D. Selective structure-based virtual screening for full and partial agonists of the beta 2 adrenergic receptor. J. Med. Chem. 2008, 51, 4978–4985. [DOI] [PubMed] [Google Scholar]
- Katritch V.; Reynolds K. A.; Cherezov V.; Hanson M. A.; Roth C. B.; Yeager M.; Abagyan R. Analysis of full and partial agonists binding to beta(2)-adrenergic receptor suggests a role of transmembrane helix V in agonist-specific conformational changes. J. Mol. Recognit. 2009, 22, 307–318. [DOI] [PMC free article] [PubMed] [Google Scholar]
- Reynolds K. A.; Katritch V.; Abagyan R. Identifying conformational changes of the beta(2) adrenoceptor that enable accurate prediction of ligand/receptor interactions and screening for GPCR modulators. J. Comput.-Aided Mol. Des. 2009, 23, 273–288. [DOI] [PMC free article] [PubMed] [Google Scholar]
- Kuntz I. D.; Blaney J. M.; Oatley S. J.; Langridge R.; Ferrin T. E. A geometric approach to macromolecule−ligand interactions. J. Mol. Biol. 1982, 161, 269–288. [DOI] [PubMed] [Google Scholar]
- Shoichet B. K.; Kuntz I. D. Matching chemistry and shape in molecular docking. Protein Eng. 1993, 6, 723–732. [DOI] [PubMed] [Google Scholar]
- Nicholls A.; Honig B. A rapid finite-difference algorithm, utilizing successive over-relaxation to solve the Poisson−Boltzmann equation. J. Comput. Chem. 1991, 12, 435–445. [Google Scholar]
- Weiner S. J.; Kollman P. A.; Case D. A.; Singh U. C.; Ghio C.; Alagona G.; Profeta S.; Weiner P. A new force-field for molecular mechanical simulation of nucleic-acids and proteins. J. Am. Chem. Soc. 1984, 106, 765–784. [Google Scholar]
- Babaoglu K.; Simeonov A.; Lrwin J. J.; Nelson M. E.; Feng B.; Thomas C. J.; Cancian L.; Costi M. P.; Maltby D. A.; Jadhav A.; Inglese J.; Austin C. P.; Shoichet B. K. Comprehensive mechanistic analysis of hits from high-throughput and docking screens against beta-lactamase. J. Med. Chem. 2008, 51, 2502–2511. [DOI] [PMC free article] [PubMed] [Google Scholar]
- Powers R. A.; Morandi F.; Shoichet B. K. Structure-based discovery of a novel, noncovalent inhibitor of AmpC beta-lactamase. Structure 2002, 10, 1013–1023. [DOI] [PubMed] [Google Scholar]
- Meng E. C.; Shoichet B. K.; Kuntz I. D. Automated docking with grid-based energy evaluation. J. Comput. Chem. 1992, 13, 505–524. [Google Scholar]
- Shoichet B. K.; Leach A. R.; Kuntz I. D. Ligand solvation in molecular docking. Proteins: Struct., Funct., Genet. 1999, 34, 4–16. [DOI] [PubMed] [Google Scholar]
- Wei B. Q. Q.; Baase W. A.; Weaver L. H.; Matthews B. W.; Shoichet B. K. A model binding site for testing scoring functions in molecular docking. J. Mol. Biol. 2002, 322, 339–355. [DOI] [PubMed] [Google Scholar]
- Irwin J. J.; Shoichet B. K. ZINC—a free database of commercially available compounds for virtual screening. J. Chem. Inf. Model. 2005, 45, 177–182. [DOI] [PMC free article] [PubMed] [Google Scholar]
- Bostrom J.; Greenwood J. R.; Gottfries J. Assessing the performance of OMEGA with respect to retrieving bioactive conformations. J. Mol. Graphics Modell. 2003, 21, 449–462. [DOI] [PubMed] [Google Scholar]
- Chambers C. C.; Hawkins G. D.; Cramer C. J.; Truhlar D. G. Model for aqueous solvation based on class IV atomic charges and first solvation shell effects. J. Phys. Chem. 1996, 100, 16385–16398. [Google Scholar]
- Li J. B.; Zhu T. H.; Cramer C. J.; Truhlar D. G. New class IV charge model for extracting accurate partial charges from wave functions. J. Phys. Chem. A 1998, 102, 1820–1831. [Google Scholar]
- Weiner S. J.; Kollman P. A.; Nguyen D. T.; Case D. A. An all atom force-field for simulations of proteins and nucleic-acids. J. Comput. Chem. 1986, 7, 230–252. [DOI] [PubMed] [Google Scholar]
- http://accelrys.com/products/scitegic/.
- Olah M.; Mracec M.; Ostopovici L.; Rad R.; Bora A.; Hadaruga N.; Olah I.; Banda M.; Simon Z.; Mracec M.; Oprea T. I.. WOMBAT: World of Molecular Bioactivity. In Chemoinformatics in Drug Discovery; Oprea T. I., Ed.; Wiley-VCH: Weinheim, Germany, 2005; pp 221−239. [Google Scholar]
- http://www.ebi.ac.uk/chembl.
- Keiser M. J.; Roth B. L.; Armbruster B. N.; Ernsberger P.; Irwin J. J.; Shoichet B. K. Relating protein pharmacology by ligand chemistry. Nat. Biotechnol. 2007, 25, 197–206. [DOI] [PubMed] [Google Scholar]
- Tondi D.; Morandi F.; Bonnet R.; Costi M. P.; Shoichet B. K. Structure-based optimization of a non-beta-lactam lead results in inhibitors that do not up-regulate beta-lactamase expression in cell culture. J. Am. Chem. Soc. 2005, 127, 4632–4639. [DOI] [PMC free article] [PubMed] [Google Scholar]
- Jarvis M. F.; Schulz R.; Hutchison A. J.; Do U. H.; Sills M. A.; Williams M. [H-3] Cgs-21680, a selective A2 adenosine receptor agonist directly labels A2-receptors in rat-brain. J. Pharmacol. Exp. Ther. 1989, 251, 888–893. [PubMed] [Google Scholar]
- Klotz K. N.; Lohse M. J.; Schwabe U.; Cristalli G.; Vittori S.; Grifantini M. 2-Chloro-N-6-[H-3]cyclopentyladenosine ([H-3]Ccpa), a high-affinity agonist radioligand for A1 adenosine receptors. Naunyn-Schmiedeberg's Arch. Pharmacol. 1989, 340, 679–683. [DOI] [PubMed] [Google Scholar]
- Olah M. E.; Gallorodriguez C.; Jacobson K. A.; Stiles G. L. I-125 4-aminobenzyl-5′-N-methylcarboxamidoadenosine, a high-affinity radioligand for the rat a(3) adenosine receptor. Mol. Pharmacol. 1994, 45, 978–982. [PMC free article] [PubMed] [Google Scholar]
- Englert M.; Quitterer U.; Klotz K. N. Effector coupling of stably transfected human A(3) adenosine receptors in CHO cells. Biochem. Pharmacol. 2002, 64, 61–65. [DOI] [PubMed] [Google Scholar]
- Jacobson K. A.; Park K. S.; Jiang J. L.; Kim Y. C.; Olah M. E.; Stiles G. L.; Ji X. D. Pharmacological characterization of novel A(3) adenosine receptor-selective antagonists. Neuropharmacology 1997, 36, 1157–1165. [DOI] [PMC free article] [PubMed] [Google Scholar]
- Nordstedt C.; Fredholm B. B. A modification of a protein-binding method for rapid quantification of camp in cell-culture supernatants and body-fluid. Anal. Biochem. 1990, 189, 231–234. [DOI] [PubMed] [Google Scholar]
- Post S. R.; Ostrom R. S.; Insel P. A. Biochemical methods for detection and measurement of cyclic AMP and adenylyl cyclase activity. Methods Mol. Biol. 2000, 126, 363–374. [DOI] [PubMed] [Google Scholar]
- Bradford M. M. Rapid and sensitive method for quantitation of microgram quantities of protein utilizing principle of protein−dye binding. Anal. Biochem. 1976, 72, 248–254. [DOI] [PubMed] [Google Scholar]
- McGovern S. L.; Helfand B. T.; Feng B.; Shoichet B. K. A specific mechanism of nonspecific inhibition. J. Med. Chem. 2003, 46, 4265–4272. [DOI] [PubMed] [Google Scholar]
- Kim J. H.; Wess J.; Vanrhee A. M.; Schoneberg T.; Jacobson K. A. Site-directed mutagenesis identifies residues involved in ligand recognition in the human a(2a) adenosine receptor. J. Biol. Chem. 1995, 270, 13987–13997. [DOI] [PMC free article] [PubMed] [Google Scholar]
- Webb T. R.; Lvovskiy D.; Kim S. A.; Ji X. D.; Melman N.; Linden J.; Jacobson K. A. Quinazolines as adenosine receptor antagonists: SAR and selectivity for A(2B) receptors. Bioorg. Med. Chem. 2003, 11, 77–85. [DOI] [PMC free article] [PubMed] [Google Scholar]
- Hert J.; Irwin J. J.; Laggner C.; Keiser M. J.; Shoichet B. K. Quantifying biogenic bias in screening libraries. Nat. Chem. Biol. 2009, 5, 479–483. [DOI] [PMC free article] [PubMed] [Google Scholar]
- Soelaiman S.; Wei B. Q.; Bergson P.; Lee Y. S.; Shen Y.; Mrksich M.; Shoichet B. K.; Tang W. J. Structure-based inhibitor discovery against adenylyl cyclase toxins from pathogenic bacteria that cause anthrax and whooping cough. J. Biol. Chem. 2003, 278, 25990–25997. [DOI] [PubMed] [Google Scholar]
- Katritch V.; Jaakola V. P.; Lane J. R.; Lin J.; Ijzerman A. P.; Yeager M.; Kufareva I.; Stevens R. C.; Abagyan R. Structure-based discovery of novel chemotypes for adenosine A(2A) receptor antagonists. J. Med. Chem. 2010, 53, 1799–1809. [DOI] [PMC free article] [PubMed] [Google Scholar]
Associated Data
This section collects any data citations, data availability statements, or supplementary materials included in this article.