

Abstract
The central pore of a nuclear pore complex (NPC) is filled with unstructured proteins that contain many FG-repeats separated by hydrophilic regions. An example of such protein is nsp1. By simulating an array of nsp1 segments, we identified, in an earlier study, a spontaneously formed brushlike structure that promises to explain selective transport in the NPC channel. Here we report four (350,000 atom, 200 ns) simulations probing this structure via its interaction with transport receptor NTF2 as well as with an inert protein. NTF2 dimers are observed to gradually enter the brush, but the inert protein is not. Both NTF2 and the inert protein are found to bind to FG-repeats, but binding periods lasted more briefly for the inert protein. A simulation also investigated the behavior of a brush made of mutant nsp1 that is known to be less effective in NPC-selective transport, finding that this brush does not attract NTF2.
Introduction
Nuclear pore complexes (NPCs) enable and control the import and export between the cytoplasm and the nucleoplasm of cells. Molecules up to 20–40 KDa can diffuse freely through NPCs (1), whereas larger molecules are excluded unless carried as cargo by transport receptors, a family of proteins that circulate between nucleoplasm and cytoplasm through NPCs. An NPC exhibits a very large total mass, e.g., ∼44 MDa in yeast (2) and ∼60 MDa in vertebrates (3). Despite its large mass and size, the NPC is composed of only ∼30 distinct proteins (nucleoporins/nups) (2–5).
Although yeast and vertebrate NPCs differ in mass and size (2,3), they share a conserved basic architecture with an octagonal radial symmetry and a pseudo-twofold symmetry across the nuclear envelope. As shown in Fig. 1, the central framework of an NPC is sandwiched between a cytoplasmic and a nuclear ring. Eight long filaments extend from the nuclear ring to the nucleoplasmic side of the nucleus. The filaments are linked together at their ends by another ring, forming a basketlike structure. Extending from the cytoplasmic ring are eight long filaments called cytoplasmic filaments, which stretch freely into the cytoplasm. Enclosed by the central framework of the NPC is the central pore, through which materials are transported into and out of the nucleus.
Figure 1.
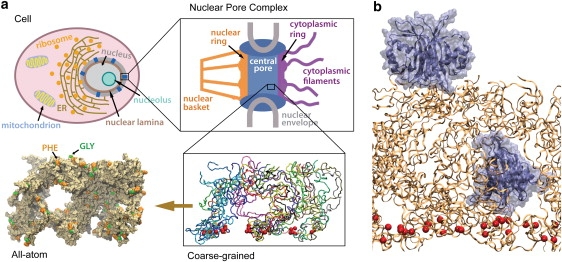
System studied. (a) The top two figures show schematically the cross sections of a typical eukaryotic cell and of the nuclear pore complex. The wild-type brushlike structure of FG-nups adopted in two simulations (ntfm1 and exom6, see text) is shown (bottom right, licorice representation) with each segment depicted in a different color. (Bottom left) The same structure is rendered in surface representation. (b) The initial setup of a molecular dynamics simulation (ntfm1, see text) is shown; a transport receptor (NTF2 dimer) was placed on top of the brush shown in panel a and another one embedded inside. NTF2 dimers are shown in ice blue; the brush segments are colored orange with its constrained Cα atoms (see text) represented by red spheres.
Anchored on the central pore surface are FG-nups, that is, NPC proteins (nups) that include intrinsically unstructured FG-repeat domains rich in phenylalanine and glycine (FG) repeating sequences (FG-repeats) (2,6–10). These domains typically contain FG-repeats as sequence motifs FG, GLFG, or FxFG (x being any amino acid, largely S) separated by linker regions of 10–20 hydrophilic amino acids. FG-repeat domains are very flexible (11–14) and natively unfolded (7–10). Representing ∼1/3 of all nups, FG-nups effectively fill the NPC central pore (2–5). In yeast NPC, there are at least 128 FG-repeat domains, together displaying ∼3500 FG-repeats (11).
The selective transport through NPCs is accomplished by transport receptors. By interacting favorably with FG-nups, transport receptors are able to pass through NPCs along with their cargo. Molecular dynamics simulations have recently shed light on the interaction between transport receptors and FG-nups (15–18). Materials destined to go through the NPC as cargo are labeled by special protein sequences, i.e., the nuclear localization signals for nuclear import (19,20) and the nuclear export signals for nuclear export (21,22). By recognizing the correct signal, a transport receptor binds to the cargo molecule directly or, in some cases, via an adaptor protein, forming a receptor-cargo complex.
During the import cycle, a transport receptor specialized for import binds to its cargo at the cytoplasmic side and carries the cargo through the NPC to the nuclear side, where Ran-GTP binds to the transport receptor and dissociates the receptor-cargo complex (23). The transport receptor, together with Ran-GTP binding to it, then returns through the NPC to the cytoplasmic side, where Ran-GTP hydrolyzes—leaving the transport receptor, which makes it then available for another round of import. The Ran GTPase activating protein (Ran-GAP), localized at the cytoplasmic compartment (24), highly increases the hydrolysis rate of Ran-GTP and, therefore, triggers the dissociation of Ran from the transport receptor (25–27). During the export cycle, a transport receptor specialized for export binds to both Ran-GTP and its cargo at the nuclear side to form the export complex. After navigating through the NPC to the cytoplasmic side, the export complex releases its cargo by hydrolysis of Ran-GTP, also stimulated by Ran-GAP. The empty transport receptor then returns to the nuclear side through the NPC.
As the selective transport takes place, Ran-GTP is transported from the nucleus to the cytoplasm, where it hydrolyzes to Ran-GDP. To maintain the selective transport, Ran-GDP must be returned to the nucleus and converted to its GTP-bound state. NTF2 is the transport receptor that binds to Ran-GDP only (28,29). As a dimer, NTF2 can bind to two Ran-GDP particles simultaneously and escort them to the nucleus. Once arriving at the nucleus, the Ran guanine nucleotide exchange factor (Ran-GEF), which is restricted to the nucleus (30), catalyzes the exchange of GDP for GTP on Ran (31) and releases NTF2. NTF2 then returns to the cytoplasmic compartment empty.
Experiments and simulations have shown that NTF2 has specific hydrophobic binding spots for FG-repeats on its surface. By replacing the large hydrophobic tryptophan side chain with the smaller alanine side chain, the W7A mutation of rat NTF2 resulted in a reduced interaction with FG-nups (32,33). A rat NTF2 W7R mutation was also observed to reduce its NPC passage significantly (34). Similarly, mutations of residues around F5 in yeast NTF2 (corresponding to W7 in rat NTF2) diminished FG-nup binding (35). A yeast NTF2 N77Y mutation increased its affinity for FG-nups apparently too much and yielded NTF2 that was dysfunctional (35); this mutant together with an FG-repeat bound had been characterized crystallographically (36). A D23A mutation of yeast NTF2 also increased the affinity of NTF2 to FG-repeats, but in this case resulted in faster Ran import (37). A thorough nuclear-magnetic resonance study of the interactions between NTF2 and FG-nups suggested on the NTF2 surface a hydrophobic stripe composed of three separate binding spots centered at residues W7, F119, and W112 (33). Simulations of rat NTF2 with numerous short FG-repeat sequences verified the experimental binding spots and proposed two new binding spots (17), suggesting that the NTF2 dimer has six hydrophobic binding spots for FG-repeats per monomer, twelve in total (17).
How does the NPC achieve selective passage for transport receptors, shutting out other large molecules? The deletion of some combinations of FG-repeat domains can lead to cell death, although the cell is still viable when over half of the FG-repeat mass is deleted (15). As pointed out already, transport receptors were observed in both experiment and simulation to interact with FG-nups (16–18,32–47). However, it is generally believed that this interaction by itself does not explain NPC selective gating. Rather it is assumed that FG-nups in the NPC central pore form a particular aggregate structure.
Indeed, a macroscopic hydrogel can be formed by FG-nups free in solution, but only under unphysical conditions (48). The saturated hydrogel can reproduce the permeability barrier of NPCs (49). With experiments that used atomic-force microscopy, Lim et al. (9) observed brushlike properties of FG-nups attached to gold substrates. Addition of the transport receptor importin-β induced a collapse of the brush, the collapse being reversed by adding Ran-GTP particles (50). More recently, an artificial nanopore with FG-nups attached to its inner surface was shown to favor the passage of transport receptors over that of inert molecules (51). Various structural models have been suggested for FG-nup aggregates and the mechanism underlying NPC's selective transport (2,52–54). Although each model has some support from experiments, none of them has yet been verified in detail.
Recently, we have studied, through molecular dynamics simulations, structures of tethered FG-nup segments (55). One FG-nup, namely yeast nsp1, was divided into sequences of 25 overlapping segments, with each sequence containing 100 amino acids (Table 1). As a representative volume of the FG-nup-filled NPC central pore, the 25 segments were tethered onto a planar surface, forming a 5 × 5 array. During the simulations, a disordered dynamic brushlike structure of bundled nsp1 segments spontaneously formed. The resulted brushlike structure displayed two properties that seem to be well adapted to the NPC selective barrier function (Fig. 1 a, bottom): 1), the brush bristles on their surface are dotted with spots of FG-repeats, which are known from both simulation and experiment to bind to transport receptors (16–18,32–47); and 2), the bristles made of bundled nsp1 segments are interconnected, as nsp1 segments frequently switch from one bundle (bristle) to another. The brushlike structure is consistent with experiments in which Lim et al. (9,50) observed brushlike properties of a different FG-nup, namely, human Nup153.
Table 1.
Sequences for the 25 segments of nsp1 that formed the brushlike structure investigated
| Segment name | D1 | D2 | D3 | D4 | D5 |
| Nsp1 sequence | 1–100 | 21–120 | 41–140 | 61–160 | 81–180 |
| Segment name | D6 | D7 | D8 | D9 | D10 |
| Nsp1 sequence | 101–200 | 141–240 | 161–260 | 181–280 | 201–300 |
| Segment name | D11 | D12 | D13 | D14 | D15 |
| Nsp1 sequence | 221–320 | 241–340 | 261–360 | 281–380 | 301–400 |
| Segment name | D16 | D17 | D18 | D19 | D20 |
| Nsp1 sequence | 321–420 | 341–440 | 361–460 | 381–480 | 401–500 |
| Segment name | D21 | D22 | D23 | D24 | D25 |
| Nsp1 sequence | 421–520 | 441–540 | 461–560 | 481–580 | 501–600 |
Each residue is referred to in the text in the form of segment-name:sequence-number; e.g., D2:21 refers to the first residue of segment D2.
Here we further investigate the properties of the computationally discovered brushlike structure (55). We focus on the structure's interaction with two proteins: a transport receptor, namely, the NTF2 dimer (PDB code: 1GY6), and an inert molecule of similar size, namely, the protein exonuclease (PDB code: 1AKO). Two NTF2 dimers were added to the brushlike structures (two wild-type brushes, one mutant brush), with one NTF2 dimer placed on top of the brush and the other inside the brush (Fig. 1 b). Likewise, two exonuclease molecules, supposedly inert to the (wild-type) brush, were added into a wild-type brush, again one placed on top of the brush and the other inside. Altogether, three NTF2 systems and one exonuclease system were built and simulated (Table 2). During the 200-ns, 350,000-atom simulations, the top-placed NTF2 dimers gradually entered both wild-type brushes, while the top-placed exonuclease molecule barely entered. In addition, the top-placed NTF2 dimer did not enter a mutant brush in a 180-ns, 350,000-atom simulation, in which all FG-repeats were replaced by SG-repeats.
Table 2.
Summary of MD simulations
| Simulation | System | No. of atoms | Simulation time | Final depth |
|---|---|---|---|---|
| ntfm1 | NTF2 + wild-type nsp1 brush 1 | 351,048 | 200 ns | 11 Å |
| ntfm2 | NTF2 + wild-type nsp1 brush 2 | 347,242 | 200 ns | 25 Å |
| ntfm3 | NTF2 + mutant nsp1 brush | 347,445 | 180 ns | -2 Å |
| exom6 | Exonuclease + wild-type nsp1 brush 1 | 351,228 | 200 ns | 3 Å |
Final depth column indicates the top-placed molecule's depth inside the brush averaged over the last 10 ns of each simulation (see Fig. 2).
Method
Two very similar wild-type nsp1 brushlike structures had been obtained previously (55) through two independent simulations of a wild-type nsp1 array. In addition, a mutant brushlike structure was obtained (55) by simulating an array with all FG-repeats mutated to SG-repeats. Here, we probed the three structures with a transport receptor (NTF2 dimer) and an inert molecule (exonuclease). Four systems were studied through all-atom molecular dynamics simulations: two NTF2 dimers added to each of the three brushlike structures, and two inert molecules of exonuclease added to one of the two wild-type brushes.
NTF2 systems
The NTF2 dimer was taken from the final state of simulation EX1 in Isgro and Schulten (17), where twelve binding spots for FG-repeats were reported for one NTF2 dimer, six for each monomer. The three brushlike structures adopted in the simulations ntfm1, ntfm2, and ntfm3 were the final all-atom structures of simulations Sim_WT2, Sim_WT1, and Sim_MT, respectively, as reported in Miao and Schulten (55). After adding one NTF2 dimer on top of each brush and embedding one inside each brush, the three systems were solvated separately into a 130 Å × 130 Å × 222 Å water box with 100 mM NaCl, the relative concentrations of Na+ and Cl− adjusted to render the whole system chargeless. This resulted in 351,048, 347,242, and 347,445 atoms for simulation ntm1, ntm2, and ntm3, respectively (Table 2).
Exonuclease system
The exonuclease molecule was taken from the protein data bank (PDB code: 1AKO). Before adding it to the wild-type nsp1 brushlike structure, the exonuclease molecule was equilibrated in solution. For this purpose, the protein was first solvated into a 115 Å × 110 Å × 106 Å box of water with 100 mM NaCl, with the relative concentrations of Na+ and Cl− adjusted to render the whole system chargeless. With the exonuclease molecule fixed, water and ions were locally energy-minimized for 20,000 time steps and then equilibrated in an NVT ensemble for 500 ps. The exonuclease was then set free and the whole system was again locally energy-minimized for 10,000 time steps and equilibrated in an NPT ensemble for 30 ns. The resulting exonuclease was then adopted in simulation exom6. Two exonuclease molecules were added into the same brushlike structure as in simulation ntfm1, and were positioned similarly as the two NTF2 dimers. The system was then solvated into a 130 Å × 130 Å × 222 Å water box with 100 mM NaCl; the relative concentrations of Na+ and Cl− were adjusted to render the whole system chargeless. This resulted in 351,228 atoms for simulation exom6 (Table 2).
Simulations placing proteins into the brush system
Before the simulations indicated in Table 2, each system was first simulated for a short time to accommodate the added NTF2 or exonuclease molecules in the rather unstructured environment of nsp1 brushes. We note that the embedding of NTF2 dimer and exonuclease into the various brushes posed little sterical hindrance as the brush segments exhibit large enough cavities. Our simulations followed a two-step protocol: with all protein atoms constrained (using a force constant of 20 kcal/mole/Å2 for N-terminal Cα atoms of nsp1 and a force constant of 2 kcal/mole/Å2 for other protein atoms), water and ions were locally energy-minimized for 20,000 time steps and then equilibrated in an NPT ensemble for 500 ps; with only NTF2/exonuclease atoms and the N-terminal Cα atoms of nsp1 constrained (force constant 0.2 kcal/mole/Å2), the whole system was again locally energy-minimized for 10,000 time steps and then equilibrated in an NPT ensemble for 10 ns. Subsequently, a local energy minimization of 10,000 time steps was performed for each system with only the N-terminal Cα atoms constrained (force constant 0.2 kcal/mole/Å2). Finally, the resulting systems were simulated as NPT ensembles for the time periods listed in Table 2, still with the N-terminal Cα atoms constrained (force constant 0.2 kcal/mole/Å2).
Simulation details
All simulations were performed using the program NAMD 2.6 (56). The simulations employed periodic boundary conditions to avoid surface effects, i.e., the simulation cell in all cases was replicated in all directions. The van der Waals interactions were cut off at 12 Å, with a switching function beginning at 10 Å for all simulations, to implement a smooth cutoff. Langevin dynamics was used to control temperature with a damping coefficient of 1 ps−1 and pressure was regulated via the hybrid Nosé-Hoover (57) Langevin (58) piston method. The piston oscillation period was set to 100 fs for all simulations (56) and the damping timescale of the hybrid Nosé-Hoover-Langevin piston method was set to 50 fs. The particle-mesh Ewald method (59) was used to calculate electrostatic forces without a cutoff; a multiple time-stepping algorithm (60,61) was utilized with a 2-fs step for bonded force evaluation, 4 fs for short-range nonbonded forces (within the cutoff), and 4 fs for long-range electrostatics (outside the cutoff) (56).
Results
During the simulations (Table 2), NTF2 dimers placed on top of the wild-type brushes entered the brushes spontaneously and much more quickly than did the exonuclease molecule placed on top of the wild-type brush or the NTF2 dimer on top of the mutant brush. Indeed, by the end of the simulations, the exonuclease molecule had barely entered the wild-type brush and, likewise, the NTF2 dimer on top of the mutant brush remained outside. As many FG-repeats as in the case of the NTF2 dimer were seen to interact with the top-placed exonuclease molecule, but did so only over relatively short time periods and involved only small binding surface areas. On the other hand, more charged residues were attracted and bound to the exonuclease surface.
NTF2 gradually entered the wild-type brush
Simulations ntfm1 and ntfm2 probed the interactions of NTF2 dimers with two wild-type nsp1 brushlike structures. Starting completely outside, the top-placed NTF2 dimer in simulation ntfm1 gradually entered the brush over the course of the 200-ns simulation, reaching a depth of 11 Å inside the brush (Fig. 2 and Fig. 3 a). In simulation ntfm2, the top-placed NTF2 dimer, initially 16 Å inside, continued entering the brush and reached a depth of 25 Å averaged over the last 10 ns (Fig. 2), i.e., NTF2 dimers in both simulations gradually entered the wild-type brushes.
Figure 2.
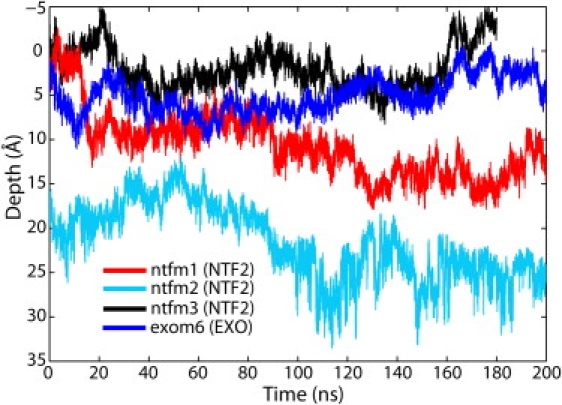
Depth of top-placed molecules. The time course of the top-placed molecules' penetration inside the brushlike structure is shown for simulation ntfm1 (NTF2 + wild-type nsp1 brush 1, red line), ntfm2 (NTF2 + wild-type nsp1 brush 2, cyan line), ntfm3 (NTF2 + mutant nsp1 brush, black line), and exom6 (exonuclease + wild-type nsp1 brush 1, blue line). The top surface of each brushlike structure defines the zero penetration depth, the inside of the brush corresponding to positive and the outside to negative depth. The motion of the proteins depicted here is shown in Movies S1b, S2b, S3b, and S4b in Supporting Material.
Figure 3.
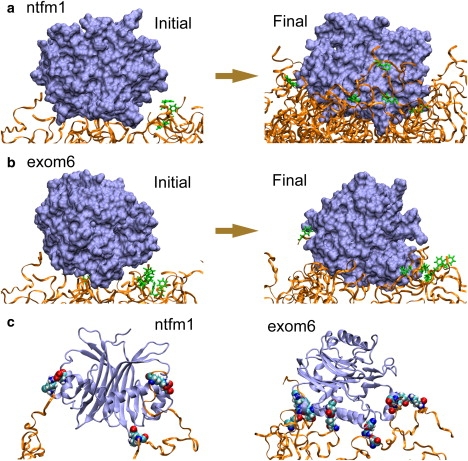
Snapshots of simulations ntfm1 and exom6. The top-placed molecules are colored ice blue and the brush segments colored orange. (a) Initial and final positions of the top-placed NTF2 dimer in simulation ntfm1. Starting completely outside the brush, approximately half of the NTF2 dimer has entered the brush at the end of simulation ntfm1. (b) Initial and final positions of the top-placed exonuclease molecule in simulation exom6. The exonuclease molecule has barely entered the brush at the end of simulation exom6. In panels a and b, any phenylalanines that had bound to the molecule are shown in green. (c) Electrostatic interaction between charged residues of the nsp1 brush and the top-placed molecules. Only three charged residues are seen closely bound to the top-placed NTF2 dimer (left), whereas six charged residues are seen closely bound to the top-placed exonuclease molecule (right). The charged residues shown are colored by atom names with hydrogen atoms in white, nitrogen atoms in dark blue, carbon atoms in cyan, and oxygen atoms in red. The systems depicted in (a, b) are shown also in Movies S1 and S4 in Supporting Material.
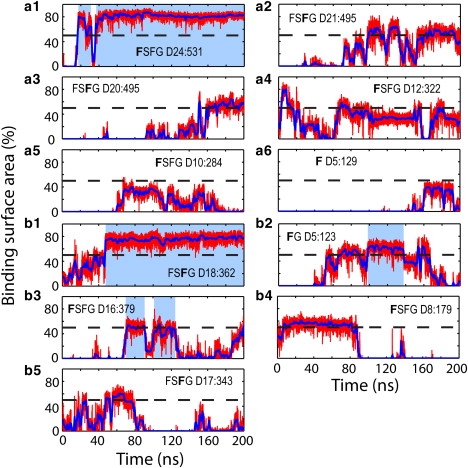
During both simulations, many phenylalanines of the FG-repeats were seen bound to NTF2 dimers; in total, there are 12 binding events observed in simulation ntfm1 and 11 binding events in simulation ntfm2. Figs. 4 and 5 track the binding surface area for each binding event over the 200 ns simulated; the binding surface areas are represented as a percentage of the phenylalanine side chain's total surface area. Some binding events, i.e., steady binding events, had a binding period of over 100 ns and a binding surface area of >50%, whereas other binding events lasted for a shorter time period or involved a smaller binding area. Snapshots of the steady binding events are shown in Fig. S4 in Supporting Material. Some FG-repeats with an FxFG sequence motif may have both of its phenylalanines bound to the NTF2 surface simultaneously, e.g., Phe D17:379 and Phe D17:381 (Table 1, Fig. 4, b1 and b3); Fig. S4 b also provides a snapshot of the concurrent binding of Phe D17:379 and Phe D17:381.
Figure 4.
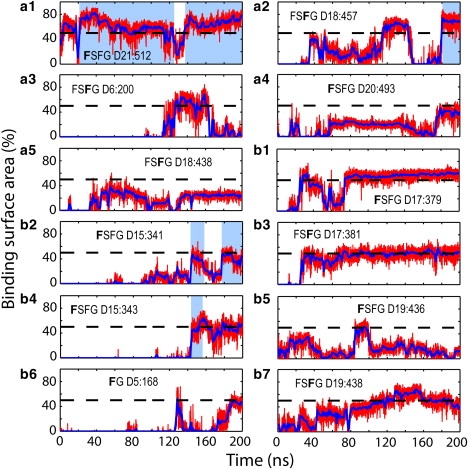
Binding events over the course of simulation ntfm1. Binding surface areas are shown as percentage of the surface of a phenylalanine side chain. The surface areas shown by red lines were calculated every 10 ps; blue solid lines represent the value averaged over 1-ns windows. The percentage value of 50% is indicated by a dashed black line. Binding periods to previously suggested binding spots are indicated by light-blue blocks. Binding events to the top-placed NTF2 dimer are shown in panels a1–a5 and binding events to the embedded NTF2 dimer in panels b1–b7. The phenylalanine of each binding event is identified by a bold letter; its segment name and sequence number are also labeled (see Table 1). The phenylalanine side-chain surface that was not accessible to the solvent due to binding is identified as the binding surface.
Figure 5.
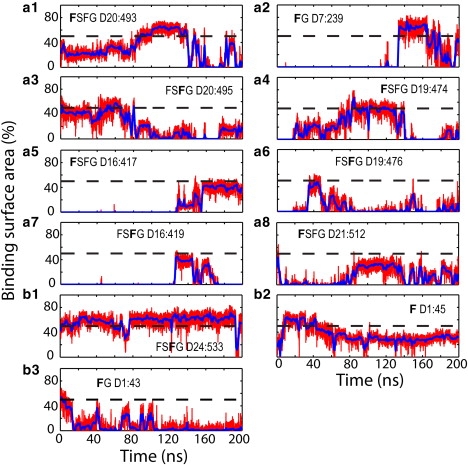
Binding events over the course of simulation ntfm2. Binding surface areas are shown as percentage of the surface of a phenylalanine side chain. The surface areas shown by red lines were calculated every 10 ps; blue solid lines represent the value averaged over 1-ns windows. The percentage value of 50% is indicated by a dashed black line. Binding periods to previously suggested binding spots are indicated by light-blue blocks. Binding events to the top-placed NTF2 dimer are shown in panels a1–a6 and binding events to the embedded NTF2 dimer in panels b1–b5. The phenylalanine of each binding event is identified by a bold letter; its segment name and sequence number are also labeled (see Table 1).
FG-repeats were not limited to the previously suggested (17) NTF2 binding spots. Binding to the previously suggested binding spots is indicated by light-blue blocks in Figs. 4 and 5. As one can see, only four binding events in each simulation contain periods during which the phenylalanines were bound to previously suggested binding spots. In simulation ntfm1, Phe D21:512, Phe D15:341, and Phe D15:343 were observed bound to binding spot 3 and Phe D18:457 was observed bound to binding spot 4. In simulation ntfm2, Phe D24:531 and Phe D18:362 were seen bound to binding spot 1 and Phe D15:123 and Phe D16:379 were seen bound to binding spot 2 (the binding spots are defined in (17)). All other phenylalanines were seen bound to alternative hydrophobic surface spots on NTF2.
However, of the many phenylalanines not bound to previously suggested binding spots, only two exhibited steady binding (i.e., binding for longer than 100 ns and involving a large binding surface area). The two phenylalanines, D17:379 and D17:381 from the same FxFG repeat, bound to the NTF2 surface simultaneously, with D17:379 bound to the area around Ala113, and D17:381 bound to the area centered at Ala31 (Fig. 4, b1 and b3). All other binding either exhibited a short binding period or involved a small surface area.
As NTF2 dimers moved around during the simulations, most phenylalanines became unbound from the NTF2 surface, readjusted themselves, and then became bound again to the same spot on NTF2 or shifted to a nearby spot. Accordingly, the binding surface areas shown in Figs. 4 and 5 drop and increase sporadically. In simulation ntfm1, the shift of binding was observed in four events. For the top-placed NTF2 dimer, Phe D21:512 initially bound to the area centered at Ala111 and then shifted to binding spot 3 centered at Phe14 (Fig. 4 a1); Phe D18:457 shifted from an area around Ile10 to binding spot 4 centered at Tyr19 (Fig. 4 a2); and Phe D20:493 unbound from the area around Asp25 and then rebound to the area centered at Ala31 (Fig. 4 a4). For the embedded NTF2 dimer, Phe D15:343 initially bound to binding spot 3 together with Phe D15:341; as NTF2 moved, both Phe D15:341 and D15:343 unbound from the binding spot. Later, Phe D15:341 re-bound to the area close to Leu21 while Phe D15:343 re-bound to binding spot 3 (Fig. 4, b2 and b4). In simulation ntfm2, all phenylalanines rebound to the spot where they unbound from, except Phe D5:123 (Fig. 5 b2), which shifted its binding position from the area centered at Pro95 to binding spot 2.
For the sake of comparison, a mutant brush system with two NTF2 dimers was also simulated. The mutant brushlike structure, in which all FG-repeats were mutated to SG-repeats, was adopted from the simulation reported in Miao and Schulten (55), where the SG-repeat brushlike structure was discussed in detail. We proposed in Miao and Schulten (55) that the mutant brushlike structure should block all kinds of large molecules including transport receptors due to a lack of FG-repeat binding opportunity, thus leading to cell lethality as reported in Frey et al. (48). Indeed, the top-placed NTF2 dimer was found not to enter the brush, fluctuating instead on top of the brush until the end of the simulation (Fig. 2). The NTF2 dimer clearly encountered hindrance when trying to enter the mutant brush, i.e., FG-repeats are essential for NTF2 dimers to enter the brush.
Top-placed inert molecule did not enter the brush
In simulation exom6, two exonuclease molecules were added to the same wild-type brush as described in simulation ntfm1 and placed at similar inside and outside positions as NTF2. The top-placed exonuclease molecule is found to barely enter the brush, fluctuating instead on top of the brush and reaching only a depth of 3 Å averaged over the last 10 ns of the simulation (Fig. 2 and Fig. 3 b). The exonuclease molecules engaged, nevertheless, in interactions with the FG-repeats; many phenylalanines were actually found to bind to hydrophobic areas on their surface. As shown in Fig. 6, there occurred 11 binding events during simulation exom6, which is comparable to the number of events seen in NTF2 simulations ntfm1 and ntfm2. However, binding to the top-placed exonuclease lasted only for short periods or involved only a small phenylalanine surface area (Fig. 6, a1–a8). Only one binding event to the embedded molecule exhibited an area of >50% and lasted longer than 100 ns (Fig. 6 b1); Fig. S4 e provides a snapshot of the binding.
Figure 6.
Binding events over the course of simulation exom6. Binding surface areas are shown as percentage of the surface of a phenylalanine side chain. The surface areas shown by red lines were calculated every 10 ps; blue solid lines represent the value averaged over 1-ns windows. The percentage value of 50% is indicated by a dashed black line. Binding events to the top-placed exonuclease are shown in panels a1–a8 and binding events to the embedded exonuclease in panels b1–b3. The phenylalanine of each binding event is identified by a bold letter; its segment name and sequence number are also labeled (see Table 1).
Interestingly, the charged residues of the brush were frequently attracted to oppositely charged residues on the surface of the exonuclease molecules. Some FG-repeat binding was even initiated by prior electrostatic binding. Of course, charged residues of NTF2 dimers can also attract oppositely charged residues of the nsp1 brushes. However, as the surface of exonuclease contains more (70 vs. 44) charged residues than does the surface of the NTF2 dimer, fewer charged residues of the brush were attracted and bound to NTF2. At the end of simulation ntfm1, there were only three negatively charged residues bound closely to positively charged residues of NTF2, although there were six charged residues bound closely to the top-placed exonuclease molecule at the end of simulation exom6 (Fig. 3 c). The electrostatic energy difference between binding and unbinding of those charged residues was calculated using the VMD (62) plug-in adaptive Poisson-Boltzmann solver (63), giving an electrostatic energy difference between binding and unbinding of −10 kcal/mol for NTF2 and −21 kcal/mol for exonuclease.
Further analysis
Changes in brush-height were tracked over each simulation (Fig. S2). During each simulation, the brush segments rearranged themselves, in particular near the added NTF2/exonuclease molecules, resulting in a decrease in brush-height. At the end of our simulations, the wild-type brushes reached a brush-height of ∼80 Å and the mutant brush reached a brush-height of a little over 85 Å.
Direct vertical (perpendicular to the brush's top surface) and lateral (parallel to the brush's top surface) movements of both the top-placed and embedded molecules were monitored during all simulations (Fig. S3). Overall, the top-placed molecules are seen to move more than the embedded molecules both vertically and laterally, which is not unexpected. In case of the embedded molecules, exonuclease moved more toward the bottom surface of the brush than did NTF2. In the case of the top-placed molecules, the positive absolute vertical movement does not reflect here an entering into the brush, because the brushes became shorter over the course of the simulations (Fig. S2); depth of the top-placed molecules inside the brush shown in Fig. 2 measures the movement of the top-placed molecules relative to the brushes' top surface.
Water residence times for all proteins were evaluated and averaged over the last 20 ns of simulations ntfm1, ntfm3, and exom6 (see Movie S1d, Movie S3d, and Movie S4d in Supporting Material). The overall picture is similar for all three cases: the embedded molecules experienced longer water residence times than the top-placed ones; water typically stayed longer on the surface areas that were in close contact with wild-type/mutant nsp1 segments; the center of the brush experienced longer water residence than either the bottom or top.
However, nsp1 segments experienced longer water residence times in the case of simulation ntfm1 than in cases of simulations ntfm3 and exom6. Although the same wild-type brush is used for simulations ntfm1 and exom6, more of the nsp1 residues (114 vs. 57) experienced water residence times of >250 ps in the case of NTF2 than in the case of exonuclease. Within 20 Å of the top-placed molecules, 24 nsp1 residues experienced water residence times longer than 250 ps in simulation ntfm1 (NTF2 + wild-type brush), whereas only four nsp1 residues experienced equally long water residence times in simulations exom6 (exonuclease + wild-type brush). A similar result holds when comparing the wild-type and mutant brushes: in the case of simulation ntfm3 (NTF2 + mutant brush), only 56 residues in the mutant brush are observed to experience a water residence time of longer than 250 ps. Within 20 Å of the NTF2 placed on top of the mutant brush, only four brush residues experienced water residence times longer than 250 ps.
Discussion
In our simulations, NTF2 dimers were seen to enter the wild-type brushlike structures made of native FG-nups, but not a brush made of mutant SG-nups (the pure brushlike structures are reported in (55)). Clearly, FG-repeats assisted the NTF2 dimers in entering the brushes. More than 10 phenylalanines were seen bound to the NTF2 dimers in each of the two simulations performed on wild-type brush-NTF2 systems. The phenylalanines were able to adjust their binding when NTF2 moves around by temporarily unbinding from NTF2 and then rebinding to it. Each NTF2 dimer exhibited at least one steady binding event, i.e., one that involved a long binding period and a large binding surface area. The fact that steady binding lasts longer and has a larger binding surface area indicates that it is stronger. Thus, such binding should contribute more than other less strong binding to the entrance of NTF2 dimers into the FG-repeat brush.
The wild-type brush was seen to be able to distinguish between the transport receptor NTF2 and the inert exonuclease at its surface. Although top-placed NTF2 dimers penetrated significantly into the brush, the top-placed exonuclease hardly did. Many FG-repeats engaged the top-placed exonuclease molecule in interactions, but only in weak ones, as judged by short binding periods and small binding areas. Because the surface of exonuclease is highly hydrophilic, it is hard for an FG-repeat to find a suitable hydrophobic spot with long steady binding.
The linker regions of nsp1 may also play a role in the scenario depicted above. Rich in charged amino acids, the linker region interacts strongly with the charged residues on the surface of NTF2 and exonuclease. Because exonuclease has many charged residues on its surface, it attracted also many charged residues of the linker region; for example, at the end of the simulations, exonuclease had six charged amino acids bound to it whereas NTF2 had only three.
NTF2 also contains charged residues on its surface that did attract charged residues of nsp1. At the same time, FG-repeats can bind to various spots on the NTF2 surface with a large binding area and long binding period. Exonuclease did not enter the brush, likely due to offering less favorable surface to FG-repeats. Notably, an NTF2 dimer did not enter a mutant brush lacking FG-repeats. It seems that an optimal balance between hydrophobic and electrostatic interaction is needed for transport receptors to enter an nsp1 brush. One should note that there are other types of FG-nups containing shorter linker regions and, thus, less charged residues than nsp1. Before drawing conclusions about the effect of charged residues, one needs to examine other types of FG-nups. A decisive role for the transport receptor-brush interaction may be played by water molecules. More nsp1 residues were observed to possess water residence times of longer than 250 ps, in the case of NTF2 placed on top of the wild-type brush, than in other cases.
We conclude that the brushlike structure discovered in Miao and Schulten (55) and further studied here shows great promise in explaining selective transport through the NPC. In the NPC central pore, the aggregate structure of all FG-nups may look similar to the brushlike structure investigated here, but details certainly differ as the NPC central pore is filled with a variety of FG-nups. Although 800 ns of overall simulation could discern some selectivity in regard to protein binding, future studies should take advantage of methodological advances speeding up MD simulations (64,65) and investigate the fascinating gating mechanism of NPCs on longer timescales.
Supporting Material
Four figures and 15 movies are available at http://www.biophysj.org/biophysj/supplemental/S0006-3495(10)00006-8.
Supporting Material
Acknowledgments
The work was supported by the National Institutes of Health (grants No. R01-GM067887 and P41-RR005969), and the National Science Foundation (grant No. PHY0822613). L.M. received a University of Illinois Computational Science and Engineering fellowship. Supercomputer time was provided by the National Center for Supercomputing Applications, the Pittsburgh Supercomputer Center, and the Texas Advanced Computing Center through the National Science Foundation and the Large Resources Allocation Committee (grant No. MCA93S028).
Molecular images in this article were prepared with VMD (62). The authors thank Peter L. Freddolino for helpful discussions.
References
- 1.Keminer O., Peters R. Permeability of single nuclear pores. Biophys. J. 1999;77:217–228. doi: 10.1016/S0006-3495(99)76883-9. [DOI] [PMC free article] [PubMed] [Google Scholar]
- 2.Rout M.P., Aitchison J.D., Chait B.T. The yeast nuclear pore complex: composition, architecture, and transport mechanism. J. Cell Biol. 2000;148:635–651. doi: 10.1083/jcb.148.4.635. [DOI] [PMC free article] [PubMed] [Google Scholar]
- 3.Cronshaw J.M., Krutchinsky A.N., Matunis M.J. Proteomic analysis of the mammalian nuclear pore complex. J. Cell Biol. 2002;158:915–927. doi: 10.1083/jcb.200206106. [DOI] [PMC free article] [PubMed] [Google Scholar]
- 4.Alber F., Dokudovskaya S., Rout M.P. The molecular architecture of the nuclear pore complex. Nature. 2007;450:695–701. doi: 10.1038/nature06405. [DOI] [PubMed] [Google Scholar]
- 5.Alber F., Dokudovskaya S., Sali A. Determining the architectures of macromolecular assemblies. Nature. 2007;450:683–694. doi: 10.1038/nature06404. [DOI] [PubMed] [Google Scholar]
- 6.Devos D., Dokudovskaya S., Sali A. Simple fold composition and modular architecture of the nuclear pore complex. Proc. Natl. Acad. Sci. USA. 2006;103:2172–2177. doi: 10.1073/pnas.0506345103. [DOI] [PMC free article] [PubMed] [Google Scholar]
- 7.Denning D.P., Uversky V., Rexach M. The Saccharomyces cerevisiae nucleoporin Nup2p is a natively unfolded protein. J. Biol. Chem. 2002;277:33447–33455. doi: 10.1074/jbc.M203499200. [DOI] [PubMed] [Google Scholar]
- 8.Denning D.P., Patel S.S., Rexach M. Disorder in the nuclear pore complex: the FG repeat regions of nucleoporins are natively unfolded. Proc. Natl. Acad. Sci. USA. 2003;100:2450–2455. doi: 10.1073/pnas.0437902100. [DOI] [PMC free article] [PubMed] [Google Scholar]
- 9.Lim R.Y., Huang N.P., Aebi U. Flexible phenylalanine-glycine nucleoporins as entropic barriers to nucleocytoplasmic transport. Proc. Natl. Acad. Sci. USA. 2006;103:9512–9517. doi: 10.1073/pnas.0603521103. [DOI] [PMC free article] [PubMed] [Google Scholar]
- 10.Denning D.P., Rexach M.F. Rapid evolution exposes the boundaries of domain structure and function in natively unfolded FG nucleoporins. Mol. Cell. Proteomics. 2007;6:272–282. doi: 10.1074/mcp.M600309-MCP200. [DOI] [PubMed] [Google Scholar]
- 11.Fahrenkrog B., Maco B., Aebi U. Domain-specific antibodies reveal multiple-site topology of Nup153 within the nuclear pore complex. J. Struct. Biol. 2002;140:254–267. doi: 10.1016/s1047-8477(02)00524-5. [DOI] [PubMed] [Google Scholar]
- 12.Paulillo S.M., Phillips E.M., Fahrenkrog B. Nucleoporin domain topology is linked to the transport status of the nuclear pore complex. J. Mol. Biol. 2005;351:784–798. doi: 10.1016/j.jmb.2005.06.034. [DOI] [PubMed] [Google Scholar]
- 13.Paulillo S.M., Powers M.A., Fahrenkrog B. Changes in nucleoporin domain topology in response to chemical effectors. J. Mol. Biol. 2006;363:39–50. doi: 10.1016/j.jmb.2006.08.021. [DOI] [PubMed] [Google Scholar]
- 14.Schwarz-Herion K., Maco B., Fahrenkrog B. Domain topology of the p62 complex within the 3-D architecture of the nuclear pore complex. J. Mol. Biol. 2007;370:796–806. doi: 10.1016/j.jmb.2007.05.030. [DOI] [PubMed] [Google Scholar]
- 15.Strawn L.A., Shen T., Wente S.R. Minimal nuclear pore complexes define FG repeat domains essential for transport. Nat. Cell Biol. 2004;6:197–206. doi: 10.1038/ncb1097. [DOI] [PubMed] [Google Scholar]
- 16.Isgro T.A., Schulten K. Binding dynamics of isolated nucleoporin repeat regions to importin-β. Structure. 2005;13:1869–1879. doi: 10.1016/j.str.2005.09.007. [DOI] [PubMed] [Google Scholar]
- 17.Isgro T.A., Schulten K. Association of nuclear pore FG-repeat domains to NTF2 import and export complexes. J. Mol. Biol. 2007;366:330–345. doi: 10.1016/j.jmb.2006.11.048. [DOI] [PubMed] [Google Scholar]
- 18.Isgro T.A., Schulten K. Cse1p-binding dynamics reveal a binding pattern for FG-repeat nucleoporins on transport receptors. Structure. 2007;15:977–991. doi: 10.1016/j.str.2007.06.011. [DOI] [PubMed] [Google Scholar]
- 19.Kalderon D., Roberts B.L., Smith A.E. A short amino acid sequence able to specify nuclear location. Cell. 1984;39:499–509. doi: 10.1016/0092-8674(84)90457-4. [DOI] [PubMed] [Google Scholar]
- 20.Adam S.A., Geracet L. Cytosolic proteins that specifically bind nuclear location signals are receptors for nuclear import. Cell. 1991;66:837–847. doi: 10.1016/0092-8674(91)90431-w. [DOI] [PubMed] [Google Scholar]
- 21.Michael W.M., Choi M., Dreyfuss G. A nuclear export signal in hnRNP A1: a signal-mediated, temperature-dependent nuclear protein export pathway. Cell. 1995;83:415–422. doi: 10.1016/0092-8674(95)90119-1. [DOI] [PubMed] [Google Scholar]
- 22.Fornerod M., Ohno M., Mattaj I.W. CRM1 is an export receptor for Leucine-rich nuclear export signals. Cell. 1997;90:1051–1060. doi: 10.1016/s0092-8674(00)80371-2. [DOI] [PubMed] [Google Scholar]
- 23.Görlich D., Panté N., Bischoff F.R. Identification of different roles for RanGDP and RanGTP in nuclear protein import. EMBO J. 1996;15:5584–5594. [PMC free article] [PubMed] [Google Scholar]
- 24.Hopper A.K., Traglia H.M., Dunst R.W. The yeast RNA1 gene product necessary for RNA processing is located in the cytosol and apparently excluded from the nucleus. J. Cell Biol. 1990;111:309–321. doi: 10.1083/jcb.111.2.309. [DOI] [PMC free article] [PubMed] [Google Scholar]
- 25.Becker J., Melchior F., Wittinghofer A. RNA1 encodes a GTPase-activating protein specific for Gsp1p, the Ran/TC4 homologue of Saccharomyces cerevisiae. J. Biol. Chem. 1995;270:11860–11865. doi: 10.1074/jbc.270.20.11860. [DOI] [PubMed] [Google Scholar]
- 26.Bischoff F.R., Klebe C., Ponstingl H. RanGAP1 induces GTPase activity of nuclear Ras-related Ran. Proc. Natl. Acad. Sci. USA. 1994;91:2587–2591. doi: 10.1073/pnas.91.7.2587. [DOI] [PMC free article] [PubMed] [Google Scholar]
- 27.Bischoff F.R., Krebber H., Ponstingl H. Human RanGTPase-activating protein RanGAP1 is a homologue of yeast Rna1p involved in mRNA processing and transport. Proc. Natl. Acad. Sci. USA. 1995;92:1749–1753. doi: 10.1073/pnas.92.5.1749. [DOI] [PMC free article] [PubMed] [Google Scholar]
- 28.Ribbeck K., Lipowsky G., Görlich D. NTF2 mediates nuclear import of Ran. EMBO J. 1998;17:6587–6598. doi: 10.1093/emboj/17.22.6587. [DOI] [PMC free article] [PubMed] [Google Scholar]
- 29.Smith A., Brownawell A., Macara I.G. Nuclear import of Ran:GDP is mediated by NTF2. Curr. Biol. 1998;8:1403–1406. doi: 10.1016/s0960-9822(98)00023-2. [DOI] [PubMed] [Google Scholar]
- 30.Ohtsubo M., Okazaki H., Nishimoto T. The RCC1 protein, a regulator for the onset of chromosome condensation locates in the nucleus and binds to DNA. J. Cell Biol. 1989;109:1389–1397. doi: 10.1083/jcb.109.4.1389. [DOI] [PMC free article] [PubMed] [Google Scholar]
- 31.Bischoff F.R., Ponstingl H. Catalysis of guanine nucleotide exchange on Ran by the mitotic regulator RCC1. Nature. 1991;354:80–82. doi: 10.1038/354080a0. [DOI] [PubMed] [Google Scholar]
- 32.Bayliss R., Ribbeck K., Stewart M. Interaction between NTF2 and xFxFG-containing nucleoporins is required to mediate nuclear import of RanGDP. J. Mol. Biol. 1999;293:579–593. doi: 10.1006/jmbi.1999.3166. [DOI] [PubMed] [Google Scholar]
- 33.Morrison J., Yang J.C., Neuhaus D. Solution NMR study of the interaction between NTF2 and nucleoporin FxFG repeats. J. Mol. Biol. 2003;333:587–603. doi: 10.1016/j.jmb.2003.08.050. [DOI] [PubMed] [Google Scholar]
- 34.Ribbeck K., Görlich D. Kinetic analysis of translocation through nuclear pore complexes. EMBO J. 2001;20:1320–1330. doi: 10.1093/emboj/20.6.1320. [DOI] [PMC free article] [PubMed] [Google Scholar]
- 35.Quimby B.B., Leung S.W., Corbett A.H. Functional analysis of the hydrophobic patch on nuclear transport factor 2 involved in interactions with the nuclear pore in vivo. J. Biol. Chem. 2001;276:38820–38829. doi: 10.1074/jbc.M105054200. [DOI] [PubMed] [Google Scholar]
- 36.Bayliss R., Leung S.W., Stewart M. Structural basis for the interaction between NTF2 and nucleoporin FxFG repeats. EMBO J. 2002;21:2843–2853. doi: 10.1093/emboj/cdf305. [DOI] [PMC free article] [PubMed] [Google Scholar]
- 37.Lane C.M., Cushman I., Moore M.S. Selective disruption of nuclear import by a functional mutant nuclear transport carrier. J. Cell Biol. 2000;151:321–332. doi: 10.1083/jcb.151.2.321. [DOI] [PMC free article] [PubMed] [Google Scholar]
- 38.Rexach M., Blobel G. Protein import into nuclei: association and dissociation reactions involving transport substrate, transport factors, and nucleoporins. Cell. 1995;83:683–692. doi: 10.1016/0092-8674(95)90181-7. [DOI] [PubMed] [Google Scholar]
- 39.Liu S.M., Stewart M. Structural basis for the high-affinity binding of nucleoporin Nup1p to the Saccharomyces cerevisiae importin-β homologue, Kap95p. J. Mol. Biol. 2005;349:515–525. doi: 10.1016/j.jmb.2005.04.003. [DOI] [PubMed] [Google Scholar]
- 40.Cushman I., Bowman B.R., Moore M.S. Computational and biochemical identification of a nuclear pore complex binding site on the nuclear transport carrier NTF2. J. Mol. Biol. 2004;344:303–310. doi: 10.1016/j.jmb.2004.09.043. [DOI] [PubMed] [Google Scholar]
- 41.Bayliss R., Littlewood T., Stewart M. GLFG and FxFG nucleoporins bind to overlapping sites on importin-β. J. Biol. Chem. 2002;277:50597–50606. doi: 10.1074/jbc.M209037200. [DOI] [PubMed] [Google Scholar]
- 42.Strawn L.A., Shen T., Wente S.R. The GLFG regions of Nup116p and Nup100p serve as binding sites for both Kap95p and Mex67p at the nuclear pore complex. J. Biol. Chem. 2001;276:6445–6452. doi: 10.1074/jbc.M008311200. [DOI] [PubMed] [Google Scholar]
- 43.Bayliss R., Littlewood T., Stewart M. Structural basis for the interaction between FxFG nucleoporin repeats and importin-β in nuclear trafficking. Cell. 2000;102:99–108. doi: 10.1016/s0092-8674(00)00014-3. [DOI] [PubMed] [Google Scholar]
- 44.Chaillan-Huntington C., Braslavsky C.V., Stewart M. Dissecting the interactions between NTF2, RanGDP, and the nucleoporin XFXFG repeats. J. Biol. Chem. 2000;275:5874–5879. doi: 10.1074/jbc.275.8.5874. [DOI] [PubMed] [Google Scholar]
- 45.Clarkson W.D., Kent H.M., Stewart M. Separate binding sites on nuclear transport factor 2 (NTF2) for GDP-Ran and the phenylalanine-rich repeat regions of nucleoporins p62 and Nsp1p. J. Mol. Biol. 1996;263:517–524. doi: 10.1006/jmbi.1996.0594. [DOI] [PubMed] [Google Scholar]
- 46.Iovine M.K., Watkins J.L., Wente S.R. The GLFG repetitive region of the nucleoporin Nup116p interacts with Kap95p, an essential yeast nuclear import factor. J. Cell Biol. 1995;131:1699–1713. doi: 10.1083/jcb.131.6.1699. [DOI] [PMC free article] [PubMed] [Google Scholar]
- 47.Bednenko J., Cingolani G., Gerace L. Importin beta contains a COOH-terminal nucleoporin binding region important for nuclear transport. J. Cell Biol. 2003;162:391–401. doi: 10.1083/jcb.200303085. [DOI] [PMC free article] [PubMed] [Google Scholar]
- 48.Frey S., Richter R.P., Görlich D. FG-rich repeats of nuclear pore proteins form a three-dimensional meshwork with hydrogel-like properties. Science. 2006;314:815–817. doi: 10.1126/science.1132516. [DOI] [PubMed] [Google Scholar]
- 49.Frey S., Görlich D. A saturated FG-repeat hydrogel can reproduce the permeability properties of nuclear pore complexes. Cell. 2007;130:512–523. doi: 10.1016/j.cell.2007.06.024. [DOI] [PubMed] [Google Scholar]
- 50.Lim R.Y.H., Fahrenkrog B., Aebi U. Nanomechanical basis of selective gating by the nuclear pore complex. Science. 2007;318:640–643. doi: 10.1126/science.1145980. [DOI] [PubMed] [Google Scholar]
- 51.Jovanovic-Talisman T., Tetenbaum-Novatt J., Chait B.T. Artificial nanopores that mimic the transport selectivity of the nuclear pore complex. Nature. 2009;457:1023–1027. doi: 10.1038/nature07600. [DOI] [PMC free article] [PubMed] [Google Scholar]
- 52.Ribbeck K., Görlich D. The permeability barrier of nuclear pore complexes appears to operate via hydrophobic exclusion. EMBO J. 2002;21:2664–2671. doi: 10.1093/emboj/21.11.2664. [DOI] [PMC free article] [PubMed] [Google Scholar]
- 53.Peters R. Translocation through the nuclear pore complex: selectivity and speed by reduction-of-dimensionality. Traffic. 2005;6:421–427. doi: 10.1111/j.1600-0854.2005.00287.x. [DOI] [PubMed] [Google Scholar]
- 54.Patel S.S., Belmont B.J., Rexach M.F. Natively unfolded nucleoporins gate protein diffusion across the nuclear pore complex. Cell. 2007;129:83–96. doi: 10.1016/j.cell.2007.01.044. [DOI] [PubMed] [Google Scholar]
- 55.Miao L., Schulten K. Transport-related structures and processes of the nuclear pore complex studied through molecular dynamics. Structure. 2009;17:449–459. doi: 10.1016/j.str.2008.12.021. [DOI] [PMC free article] [PubMed] [Google Scholar]
- 56.Phillips J.C., Braun R., Schulten K. Scalable molecular dynamics with NAMD. J. Comput. Chem. 2005;26:1781–1802. doi: 10.1002/jcc.20289. [DOI] [PMC free article] [PubMed] [Google Scholar]
- 57.Martyna G.J., Tobias D.J., Klein M.L. Constant pressure molecular dynamics algorithms. J. Chem. Phys. 1994;101:4177–4189. [Google Scholar]
- 58.Feller S.E., Zhang Y.H., Brooks B.R. Constant pressure molecular dynamics simulation—the Langevin piston method. J. Chem. Phys. 1995;103:4613–4621. [Google Scholar]
- 59.Darden T., York D., Pedersen L. Particle mesh Ewald. An N·log(N) method for Ewald sums in large systems. J. Chem. Phys. 1993;98:10089–10092. [Google Scholar]
- 60.Grubmüller H., Heller H., Schulten K. Generalized Verlet algorithm for efficient molecular dynamics simulations with long-range interactions. Mol. Simul. 1991;6:121–142. [Google Scholar]
- 61.Schlick T., Skeel R., Schulten K. Algorithmic challenges in computational molecular biophysics. J. Comput. Phys. 1999;151:9–48. [Google Scholar]
- 62.Humphrey W., Dalke A., Schulten K. VMD: visual molecular dynamics. J. Mol. Graph. 1996;14 doi: 10.1016/0263-7855(96)00018-5. 33–38, 27–28. [DOI] [PubMed] [Google Scholar]
- 63.Baker N.A., Sept D., McCammon J.A. Electrostatics of nanosystems: application to microtubules and the ribosome. Proc. Natl. Acad. Sci. USA. 2001;98:10037–10041. doi: 10.1073/pnas.181342398. [DOI] [PMC free article] [PubMed] [Google Scholar]
- 64.Freddolino P.L., Liu F., Schulten K. Ten-microsecond molecular dynamics simulation of a fast-folding WW domain. Biophys. J. 2008;94:L75–L77. doi: 10.1529/biophysj.108.131565. [DOI] [PMC free article] [PubMed] [Google Scholar]
- 65.Freddolino P.L., Schulten K. Common structural transitions in explicit-solvent simulations of villin headpiece folding. Biophys. J. 2009;97:2338–2347. doi: 10.1016/j.bpj.2009.08.012. [DOI] [PMC free article] [PubMed] [Google Scholar]
Associated Data
This section collects any data citations, data availability statements, or supplementary materials included in this article.