

Abstract
Large, solute-free interfacial zones have recently been described in aqueous solutions. Found next to hydrophilic surfaces, these “exclusion zones” are commonly several hundred micrometers wide and represent regions of water that appear to be more ordered than bulk water. We report here that other polar solvents including methanol, ethanol, isopropanol, acetic acid, D2O and dimethyl sulfoxide (DMSO) show similar near-surface exclusion zones, albeit of smaller magnitude. Microelectrode measurements show that these zones are negatively charged and grow in response to incident infrared radiation, similar to exclusion zones in aqueous solutions. Hence, near-surface exclusion zones appear to be features characteristic not only of water but of other polar liquids as well.
Introduction
The presence of ordered vicinal water near interfaces has been long recognized 1–4. Recently, Zheng and Pollack 5 and Zheng et al. 6 found that water ordering next to hydrophilic surfaces may be more extensive than generally thought. The authors reported that colloidal particles and various solutes in aqueous solution were extensively excluded from regions next to various hydrophilic surfaces. The width of the solute-free zone, or “exclusion zone” (EZ), was typically several hundred micrometers. From UV-Vis absorption spectra, as well as infrared spectra and NMR imaging, it appears that these large solute-free zones constitute a phase of water that is physically distinct from, and less mobile than, bulk water.6–8 The surprising result was that the ordered regions were considerably more extensive than expected.
An early review of the solid-liquid interface by Henniker9 (1949) cites evidence for long-range — far beyond the two or three molecular layers generally implied — structural changes in water. The review also cites more than 100 papers indicating that many liquids other than water are profoundly impacted by the presence of an interface.
To explore whether polar liquids are impacted by interfaces in a manner similar to water, we examined a variety of liquids to determine whether they too produce exclusion zone-like features. We found that many of those liquids did produce exclusion zones, although smaller than those found with water.
Materials and Methods
Nafion
Nafion tubing (TT-050 with 1.35 mm outside diameter, Perma Pure LLC) was used in all experiments. Tubing was deemed preferable to a sheet because its edge could be more clearly defined in the microscopic image. Before use, the tubing was immersed in the respective solvent for 10 min. All experiments were carried out at 22–23 °C.
Deionized water
The deionized water used in all experiments was obtained from a NANOpure® Diamond™ ultrapure water system. The purity of water from this system is certified by resistivity values up to 18.2 mΩ-cm, which exceeds ASTM, CAP and NCCLS Type I water requirements. In addition, the deionized water was passed through a 0.2-micron hollow fiber filter to ensure bacteria- and particle-free water.
Microsphere suspension in D2O and polar solvents
Polybead carboxylate microspheres (2.65% solids-latex, Polysciences Inc.), hydrophilic silica microspheres (SiO2, Polysciences Inc.), and sulfate microspheres (2.65% solids-latex, Polysciences Inc.) of 1-μm diameter were used in the experiments. All the microspheres came suspended in water. In order to re-suspend them in the respective solvents, the microspheres were first dehydrated in a drying oven (Thelco LAB, Precision Scientific Co.). For this procedure, a 2 μL droplet of stock suspension was deposited in a beaker which was then placed in the oven with desiccant (Drierite Co. LTD) for 24 hours at 35° C. The dried microspheres were then deposited into the solvent and mixed by sonication (Ultrasonic cleaner, Sinosonic Industrial Co.). The solvents investigated included deuterium oxide D2O (99.9%, Cambridge Isotope Lab Inc.), methanol (> 99.8% and <0.002% water, Sigma-Aldrich), ethanol (100% Ethanol 200 Proof, Decon labs), isopropanol (99.9% and < 0.04% water, J. T. Baker), dimethyl sulfoxide (99.9% and < 0.04% water, J. T. Baker), acetic acid (> 99.8%, Fisher Scientific), acetone (>99.5% and < 0.3% water, EMD Chemicals Inc.) and diethyl ether (≥ 99% and ≤ 0.03% water, Sigma-Aldrich).
For the non-polar solvent diethyl ether, the microspheres (caboxylate, polystyrene and silica) did not dissolve sufficiently, yielding low concentrations that made observations challenging. High toxicity further added to complications.
Microscope and Image Analysis
A Zeiss Axiovert-35 microscope was used for all observations. For image recording we used a high-resolution single CCD chip color digital camera (CFW-1310C), well suited for bright-field and low-light color video microscopy, as well as for photo documentation. Pixel resolution was 1360 × 1024 and dynamic range was 10 bits. The CCD sensor of that camera employs the widely used Bayer color-filter arrangement.
Chamber for microscopic observation
The chamber was made using a glass slide, 1-mm thick, secured to the bottom of a 4.5-mm thick plastic (polycarbonate) block (length 7.7 cm × width 2.5 cm) with a 1.8-cm circular hole in the center. A glass slide, 1-mm thick, was used to cover the chamber during the experiment in order to diminish any evaporation-driven convection and to limit exposure of the solvent to water vapor from the air.
Light sources
A series of infrared LEDs were used to explore the effects of radiant energy on the size of the exclusion zone. All details of these sources and incident power measurements can be found in Chai et al.10.
Potential measurement
The chamber used for potential measurement is shown in Figure 1. It was made using five glass slides bonded together with silicon glue. The Nafion tubing (TT-070, Perma Pure LLC) used here was 1.8 mm in outer diameter, but increased to 2.5 mm after swelling in ethanol. Hence, the swollen Nafion tubing fitted the width of chamber very well, and the microelectrode could easily find the highest surface that could be imaged by microscope. The Nafion tubing inside the chamber was set on a PDMS platform of 2.5 mm width and 5 mm height. The tube was placed on this raised stage instead of directly on the chamber floor to optimize the view of the Nafion boundaries and to avoid obstructions caused by the glued edges of the chamber.
Figure 1.
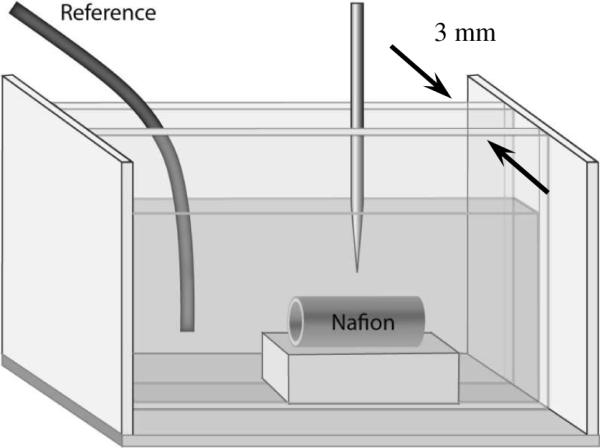
Potential distribution measurement setup. The cell dimension is 7.5 × 4 × 3 mm, in length, height and width respectively.
To make the electrical measurements, reference and probe electrodes were used. The reference electrode was positioned remotely in the bulk water, while the microelectrode probe was advanced vertically by a motor at a speed of 10 μm/s. The microscope and CCD camera were used to monitor electrode-tip position to confirm position and to help avoid tip breakage.
The probe electrodes used for potential measurements were made using standard tapered glass microelectrodes. Thin-walled, single-barrel borosilicate capillary tubes (O.D. = 1.2 mm, World Precision Instruments, Model TW150F-6) were single-pulled using a standard electrode puller (Electrode Puller P-87, Sutter Instruments). The pulled electrodes were immersed in a 3M KCl solution with the tip facing upward, so that the solution climbed to the tip by capillary action, allowing the tip of the electrode to be bubble free. The microelectrode was then back-filled using a flexible long syringe tip. The resistance was measured to be ~ 10 MΩ. The electrodes were connected to an Electro 705 battery-operated, low noise, wide-band electrometer preamplifier (World Precision Instruments Inc.), designed for intracellular voltage measurement.
Results
1. Microscopic observation of solute-free zones
Exclusion zones were initially explored in aqueous solutions. A representative result is shown in Figure 2. The zone begins to form when the Nafion is immersed in the aqueous microsphere suspension and reaches a stable size after approximately five minutes. Typical EZ size at that time in water is approximately 200 μm.
Figure 2.
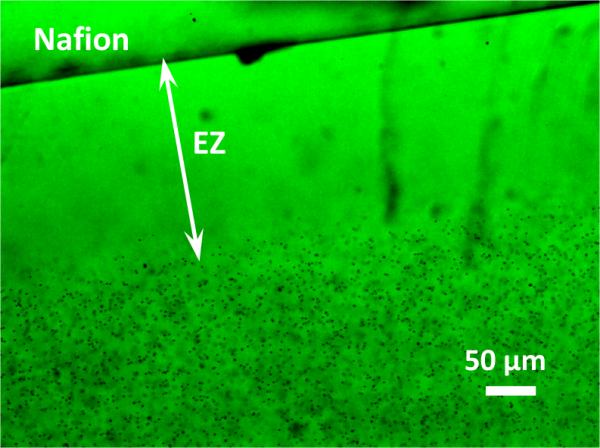
Solute-free aqueous exclusion zone (“EZ”) adjacent to Nafion surface. Width of the exclusion zone, extending from Nafion surface to boundary of microsphere zone, is approximately 200 μm.
To prepare microsphere suspensions in other solvents, a volume of 2 μL dried carboxylate microspheres was suspended in 1 ml solvent, achieving a microsphere concentration of 0.2% (vol/vol). This suspension was injected into the experimental chamber after the Nafion tube had been positioned in the middle of the chamber floor. It should be noted that the Nafion tubing expanded substantially after immersion in polar solvents. For example, after 10 minutes of immersion in ethanol, the length increased by 35 – 40% and the diameter increased by ~25%. This increase can be compared to the ~ 6% increase in both length and diameter in water. Nafion swelling was not the cause of the EZ, as exclusion zones have been observed in samples that do not swell at all6. The height of the microsphere solution was set to just cover the expanded Nafion tubing, requiring a volume of approximately 8 ml.
The chamber was then moved to the microscope stage for observation. Convection currents inside the chamber were noticeable, and were largely eliminated by placing a cover slide over the chamber to reduce evaporation.
Figure 3 shows a representative image of a solute-free zone in ethanol. The image was taken 10 minutes after exposure. The zone was smaller and less regular than that seen in aqueous media. To measure the width of the EZ, 60 equally spaced points along the EZ boundary were sampled, extending over 6 mm. The EZ width was 38 ± 3.1 μm (n = 5 experiments).
Figure 3.
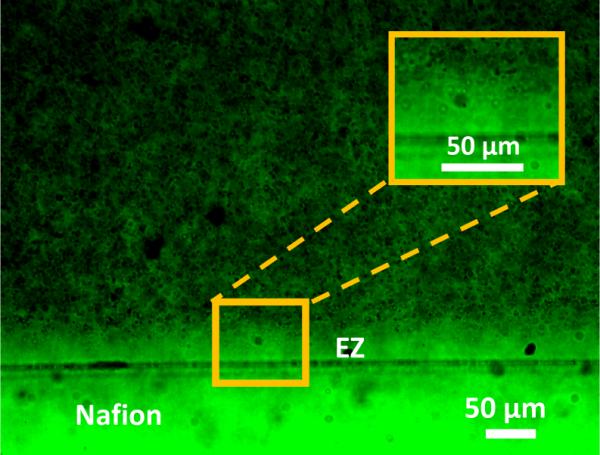
Solute-free zone in ethanol suspension of carboxylate microspheres. Image obtained after 10 minutes of exposure.
EZs were measured similarly in other solvent suspensions and the results are shown in Table 1. Measurements were made after approximately 10 minutes. In the majority of these polar solvents the EZ was detectable within 30 seconds and increased in size with time. EZ formation in DMSO, however, was notably slower than the rest. Within the first 5 minutes no EZ was detectable. Once the EZ became visible, it increased in size, typically reaching 45 μm after 10 minutes and increasing further to approximately 200 μm by 20 minutes. Additionally, heavy water (deuterium oxide) was tested. The size of the EZ was 200 ± 20.3 μm (n = 5), compared to the EZ of H2O, which was 220 ± 17.8 μm (n = 5).
Table 1.
Exclusion-zone size measured in various polar solvents. Mean +/− Standard Deviation.
| Solvent | H2O | D2O | methanol | ethanol | acetic acid | isopropanol | DMSO |
| EZ size (μm) | 220±17.8 | 200±20.3 | 102 ±8.5 | 38±2.1 | 30±4.8 | 51±3.5 | 47±6.7 |
Two solvents did not result in detectable exclusion zones. In acetone, the microspheres dissolved; hence, no results could be obtained. In the non-polar solvent, diethyl ether, the microspheres adhered to the Nafion surface; hence, no EZ could be observed.
2. EZ-width changes with time
The results above were obtained at a fixed time of 10 minutes after mixing. However, the change of EZ size over time was somewhat different for the different liquids, and we opted to study dynamics in ethanol in further detail. A section of Nafion tubing was prepared as described earlier and the microsphere suspension was added to the chamber at t = 0. Typical results are shown in Figure 4 EZ size increased during the first 10 – 15 minutes, then diminished for a period, and finally grew again.
Figure 4.
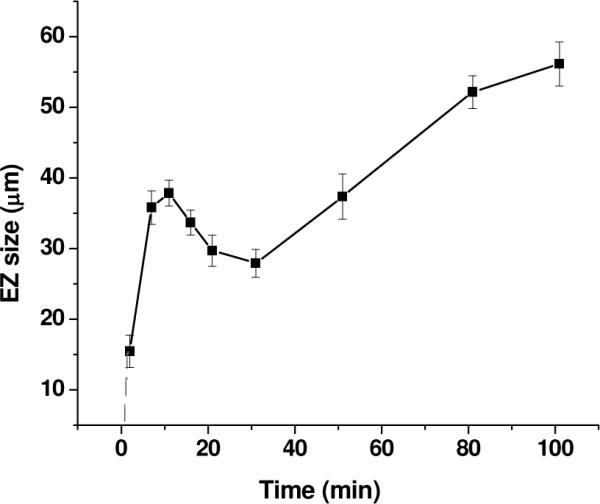
Time course of EZ size change in ethanol (n = 6 experiments). A seventh experiment gave grossly disparate results and was not included. The dashed line extends the curve to t = 0.
3. Effect of microsphere charge and size on EZ width
In order to control for microsphere repulsion from the Nafion surface as the possible source of exclusion, we tested microspheres of different charge polarity. This was done for ethanol, isopropanol and methanol solutions. Beyond the standard negatively charged carboxylate microspheres, two additional types were used: positively charged 1-μm amino-coated microspheres, and nearly neutral 1-μm polystyrene microspheres. Silica microspheres were used as well, but could not be suspended in all solvents. All EZ measurements were made following 10 –15 minutes of incubation.
The results, summarized in Table 2, show that EZ size did not depend significantly on the charge of the microsphere. Some differences were noted, particularly in ethanol, but generally the results were independent of the type of microsphere used. Thus, microsphere-charge functionalization did not play a significant role in EZ formation.
Table 2.
EZ sizes (μm) in different solvents with different types of microspheres, with standard deviation
| solvents | ethanol | isopropanol | methanol |
|---|---|---|---|
| microspheres | |||
| carboxylate | 38±3.1 | 51±3.5 | 102±8.5 |
| polystyrene | 31±4.2 | 54±4.6 | / |
| amino | 50±2.9 | 53±3.1 | / |
| silica | - | - | 107±10.2 |
silica microspheres could not be dissolved in ethanol or isopropanol.
polystyrene and amino microspheres became transparent in methanol.
Similarly, we considered the effect of microsphere size. Carboxylate microspheres of diameters 1 μm, 2 μm and 4.5 μm were suspended in ethanol, and the corresponding EZ sizes were, respectively, 38 ± 3.1, 87 ± 10.9 and 171 ± 13.8 μm.
One limiting factor for determining the role of microsphere size was the force of gravity, as larger microspheres settled more rapidly. For example, the 4.5-μm microspheres were fully settled by 20 min, and hence the EZ was not readily measurable at the longest times. Nonetheless, EZs were seen with various microsphere sizes, with larger microspheres resulting in larger EZs, similar to earlier results obtained with aqueous solutions8.
4. Controls for presence of residual water
A potential artifact in some of these experiments was the presence of residual water. Some water may have remained after microsphere dehydration and a possibility is that it was this residual water alone that gave rise to the EZ; i.e., the EZ contained water alone and none of the other solvent. To test for this possibility, the volume fraction of microspheres (carboxylate, 1 μm) was varied: 0.01%, 0.2% and 1%. This variation would change the water content by a factor of 100 times. EZ sizes were, respectively, 47± 1.2 μm, 37 ± 1.4 μm, and 38 ± 1.3 μm (n = 5 experiments). Despite the two order of magnitude concentration range, EZ size differed little. In fact, the lowest concentration, where the smallest amount of residual water is to be expected, gave the largest exclusion zone. Hence, residual water cannot account for the exclusion zones observed in ethanol, and by extension, probably not in the other solvents as well.
5. Effect of incident infrared radiation
EZ development in water was found earlier to depend on incident electromagnetic radiation, especially in the infrared range8. Thus, 3.1-μm infrared radiation — the wavelength at which water absorption is highest — produced the largest EZ expansion. Based on this similarity, two questions arise: (1) Does IR exposure bring similar EZ expansion in other polar solvents as it does in water? (2) If so, what is the spectral dependence, and is it similar to that of water?
LEDs of several wavelengths ranging from 1.7 μm to 3.6 μm were used to measure EZ-size changes in response to added incident radiation. Measurements were made at 10 – 15 minutes, the time at which the EZ became relatively stable (Fig. 4). The chamber was covered by a 1-mm-thick CaF2 cover slide, which diminished evaporation-induced convection. The transmittance of this CaF2 slide in the infrared region was confirmed by FT-IR and was at least 80% of that in the visible region. The light beam that emerged from the pinhole used to confine the beam to a small spot was directed to the middle of the EZ. After 5 minutes of exposure, the LED was turned off and the image of the EZ was immediately recorded.
EZ expansion was consistently observed with this incident radiation. The EZ boundary could be observed clearly, although occasionally several microspheres remained within the expanded zone along regions of the Nafion surface. Certain regions along the Nafion surface expanded considerably more than others. This nonuniformity might have arisen from infrared-intensity nonuniformity, and was seen also in experiments with water. EZ size was calculated by averaging all 60 EZ values measured along the entire Nafion tube.
The expansion ratios, defined as the expanded EZ size divided by the control EZ size, are plotted in Figure 5. The largest EZ expansion occurred at a wavelength of 3.4 μm. This wavelength is the same as that showing the maximum infrared absorption in ethanol10.
Figure 5.
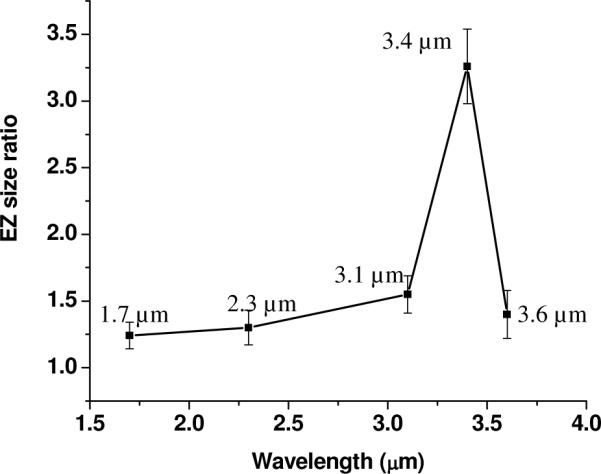
EZ-expansion ratios in ethanol as a function of wavelength (n = 5 experiments).
6. Electrical potential measurements
The near-Nafion potential distribution in water is known6, and was re-measured as a reference and represented in Figure 6 as the blue curve. The potential distribution in ethanol was measured as well with respect to a remote reference electrode and displayed as the red curve. Since the noise arising in the ethanol solution was relatively larger than in water the signal was filtered to reduce the noise. When the probe tip was positioned well beyond the exclusion-zone boundary, the potential difference was almost zero, although slightly positive. (Note that minor potential shifts may arise out of spatial and temporal variations of zero baseline level.) As the probe advanced close enough to the surface, negative potentials began to register, the magnitude increasing with increasing proximity to the surface, much like that of water. One difference between water and ethanol is the distance required to reach zero potential, approximately 300 μm and 50 μm respectively. These distances are comparable to the relative EZ sizes, 280 μm in water and 38 μm in ethanol.
Figure 6.
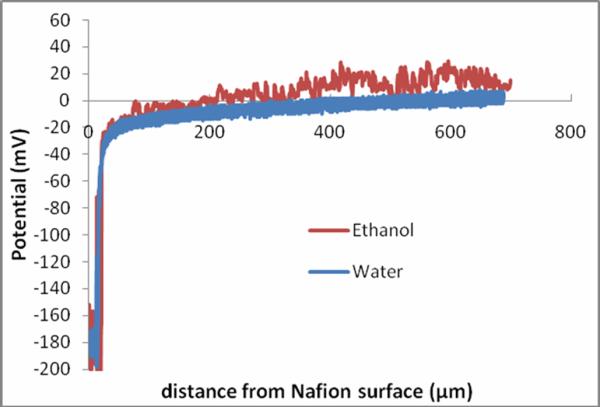
Average potential distributions adjacent to Nafion surface in water and ethanol (n = 6).
Measurements in isopropanol resulted in negative potentials as well, but no systematic measurements were undertaken. A hypothesis worth considering is that the negative electrical potential of the EZ is a general feature of these solvents.
Discussion
Previous results from this laboratory have confirmed the presence of extensive interfacial exclusion zones in water. Projecting out to a maximum of hundreds of micrometers from the surface, these zones appear to be more ordered and more stable than bulk water5–9,16. Because they exclude particles and solutes, they have been termed “exclusion zones.” Substantial exclusion zones are seen next to many hydrophilic surfaces in aqueous systems5–8,16.
The question addressed here is whether exclusion zones are found in liquids other than water, especially polar liquids. While not envisioned in contemporary thinking, the early literature contains numerous reports of broad interfacial zones in many liquids, extending up to hundreds of micrometers from the respective surfaces (c.f., Henniker, 1949). The existence of such reports raised the question whether those interfacial zones might correspond to exclusion zones.
We found that this was indeed the case. All polar liquids studied, including ethanol, methanol, isopropanol, acetic acid and DMSO showed sizable exclusion zones. Although the polar liquid exclusion zones were not as large as the zone found in water, the sizes were nevertheless appreciable, ranging from tens of micrometers to more than two hundred micrometers. As with water, the exclusion zones' presence was detectable with microspheres of negative, positive and near-neutral polarity; hence, these zones did not likely arise out of some electrostatic-repulsion phenomenon. Also as observed in the aqueous system, zone sizes were larger when larger microsphere probes were tested, a reflection, presumably of the EZ's jagged outer boundary. It appears, then, that exclusion zones are common features of many polar liquids — not a surprise given the large number of early reports indicating large interfacial zones.
Another seemingly common feature among water-based exclusion zones and polar solvent-based exclusion zones is the presence of a negative potential gradient. Consistently, the negative potential was highest near the Nafion surface and lower farther outward from the surface. Earlier results obtained with water had shown proton-borne positive charge in the zone beyond the EZ, and such positive charge was even more evident in the case of ethyl alcohol, where potential measurements showed positive electrical potential in that zone (Fig 7). Hence, the presence of interfacial charge separation might be a common feature among the different solvents.
In previous studies, we found that the charge separation in water was fueled by incident radiant energy, particularly in the infrared region of the spectrum11. To test whether that might be the case with the polar solvents as well, we exposed the ethyl alcohol setup to infrared light. The results confirmed substantial EZ expansion in the presence of infrared, implying that the energetic basis for EZ buildup in the polar solvents was similar to that of water.
Additionally, we found a remarkable wavelength correspondence between expansion and absorption. In the case of water, the wavelength most effective for expanding the EZ was the same wavelength that water absorbs most strongly, ~3.0 μm, which corresponds to the OH-stretch17–19. In the case of ethyl alcohol the similarity persisted. Here the wavelength absorbed most strongly, 3.4 μm, was again the wavelength most effective in producing EZ expansion. Thus, the correspondence is seen in both water and ethanol.
From this correspondence, one might speculate what happens when radiant energy is absorbed in polar liquids. The prevailing understanding is that the absorbed energy is converted into heat alone19–20. The fact that the most strongly absorbed incident wavelengths also expand the EZ most profoundly implies that the absorbed energy may be used as well for conferring nonthermal potential energy to the system. The potential energy could exist in the form of entropy loss, i.e., as increased order in the interfacial zone, and possibly also as increased interfacial charge separation.
Among the polar solvents that showed an EZ, methanol, ethanol, isopropanol and acetic acid are protic solvents, which are presumed to strongly solvate negatively charged solutes via hydrogen bonding similar to water22–23. On the other hand, EZ formation was also found in dimethyl sulfoxide, which is an aprotic solvent24–27. For this solvent, EZ formation was relatively slower than the rest and became visible, expanding to approximately 200 μm in 20 minutes. The difference of behavior might arise from different mechanisms of solvation, the latter thought to arise from dipole-dipole interactions22–28. However, the reason that dipole-dipole interaction slows down EZ buildup compared to hydrogen binding needs to be explored in future work.
In summary it appears that water is less unique than anticipated, at least in terms of exclusion-zone formation. The presence of exclusion zones seems to be a general phenomenon not only in aqueous systems but many or all polar liquid systems. Although the observed interfacial features are unexpected by contemporary standards, we stress that they are fully anticipated by the results of earlier research (Henniker, 1949). Thus, polar liquids have extensive interfacial zones that are physically and perhaps chemically different from the respective bulk fluids. How exactly these zones differ structurally remains to be elucidated.
Acknowledgements
The authors thank Jeff Magula for fabrication of the experimental chambers. This study was supported by NIH Grants (AT-002362, AR-44813 and GM-093842) and ONR Grant (N0001405-1-0773).
References
- 1.Klier K, Zettlemoyer AC. J. Colloid Interface Sci. 1977;58(2):216–229. [Google Scholar]
- 2.Hillig WB. In: Growth and Perfection of Crystals. Doremus RH, Roberts BW, Turnbull D, editors. John Wiley and Sons; New York: 1958. p. 350. [Google Scholar]
- 3.Clegg JS. Am J Physiol. 1984;246:R133–151. doi: 10.1152/ajpregu.1984.246.2.R133. [DOI] [PubMed] [Google Scholar]
- 4.Ling GN. The hidden history of a fundamental revolution in biology. Pacific Press Inc; New York: 2001. [Google Scholar]
- 5.Zheng JM, Pollack GH. Phys. Rev. E. 2003;68:031408. doi: 10.1103/PhysRevE.68.031408. [DOI] [PubMed] [Google Scholar]
- 6.Zheng JM, Chin WC, Khijniak E, Pollack GH. Adv. Colloid Interface Sci. 2006;127:19–27. doi: 10.1016/j.cis.2006.07.002. [DOI] [PubMed] [Google Scholar]
- 7.Zheng JM, Pollack GH. In: Water and the Cell. Pollack GH, Cameron IL, Wheatley DN, editors. Springer; Netherlands: 2006. pp. 165–174. [Google Scholar]
- 8.Chai BH, Zheng JM, Zhao Q, Pollack GH. J. Phys. Chem. A. 2008;112(11):2242–2247. doi: 10.1021/jp710105n. [DOI] [PubMed] [Google Scholar]
- 9.Henniker JC. Rev. Mod. Phys. 1949;21(2):322–341. [Google Scholar]
- 10.Chu PM, Guenther FR, Rhoderich GC, Lafferty WJ. Quantitative infrared databse. In: Linstrom PJ, Mallard WG, editors. NIST Chemistry WebBook, NIST standard reference database number 69. national Institute of Standards and Technology; Gaithersburg MD: p. 20899. http://webbook.nist.gov, (retrieved November 9, 2009) [Google Scholar]
- 11.Chai BH, Yoo H, Pollack GH. J. Phys. Chem B. 2009;113(42):13953–13958. doi: 10.1021/jp908163w. [DOI] [PMC free article] [PubMed] [Google Scholar]
- 12.Verwey EJ, Overbeek JTG. Trans. Faraday Soc. 1946;42B:117–123. [Google Scholar]
- 13.Levine S. Trans. Faraday Soc. 1976;42B:102–117. [Google Scholar]
- 14.Langmuir I. J. Chem. Phys. 1938;6:873–896. [Google Scholar]
- 15.Warren BE. Phys. Rev. 1933;44(12):969–973. [Google Scholar]
- 16.Pollack GH, James C. In: Phase Transitions in Cell Biology. Pollack GH, Wei-Chun C, editors. Springer; Netherlands: 2008. pp. 143–152. [Google Scholar]
- 17. [accessed January 4, 2010]; http://www.lsbu.ac.uk/water/vibrat.html.
- 18.Venyaminov SY, Prendergast FG. Anal. Biochem. 1997;248(2):234–245. doi: 10.1006/abio.1997.2136. [DOI] [PubMed] [Google Scholar]
- 19.Bertie JE, Ahmed MK, Eysel HH. J. Phys. Chem. 1989;93(6):2210–2218. [Google Scholar]
- 20.Lidström P, Tierney J, Wathey B, Westman J. Tetrahedron. 2001;57(45):9225–9283. [Google Scholar]
- 21.Anderson RR, Parrish JA. Science. 1983;220(4596):524–527. doi: 10.1126/science.6836297. [DOI] [PubMed] [Google Scholar]
- 22.Loudon GM. Organic Chemistry. 4th ed. Oxford University Press; New York: 2002. p. 317. [Google Scholar]
- 23.Parker AJ. Quart. Rev.Chem. Soc. 1962;16:163–187. [Google Scholar]
- 24.Lowery TH, Richardson KS. Mechanism and Theory in Organic Chemistry, Harper Collins Publishers. 3rd ed. 1987. p. 183. [Google Scholar]
- 25.Parker AJ. Advan.Phys. Org. Chem. 1967;5:173. [Google Scholar]
- 26.Kosower EM. An Introduction to Physcial Organic Chemistry. John Wiley and Sons, Inc.; New York, N. Y.: 1968. [Google Scholar]
- 27.Price E. In: The Chemistry of Non-Aqueous Solvents. Lagowski JJ, editor. Vol. 1. Academic Press; New York, N. Y.: 1966. [Google Scholar]
- 28.Parker AJ. Chemical Reviews. 1969;69(1):1–32. [Google Scholar]